Improvise, Adapt and Overcome
2026 was on track to be a very decent year for equity markets, more than decent in fact. The AI trade had its challenges, but the exuberance was still largely in play, interest rates were pointing lower, and U.S. fiscal policy was expected to turn stimulatory. All the stars were aligned for a tip-top year before this war came along, and investors are itching to get back to normal; just as they did after the global tariffs farce a year ago. More than anything, they want to buy the dip.
Given the plethora of “risk-off geopolitical events” we have experienced over the last 5 years, the
lesson we have learnt is to wait for the point of maximum pain and buy the market.
We have no doubt that once it looks like we are approaching the end of the conflict in Iran and the Strait of Hormuz flows freely again, the market with bounce. However, the economic environment has changed:
-
-
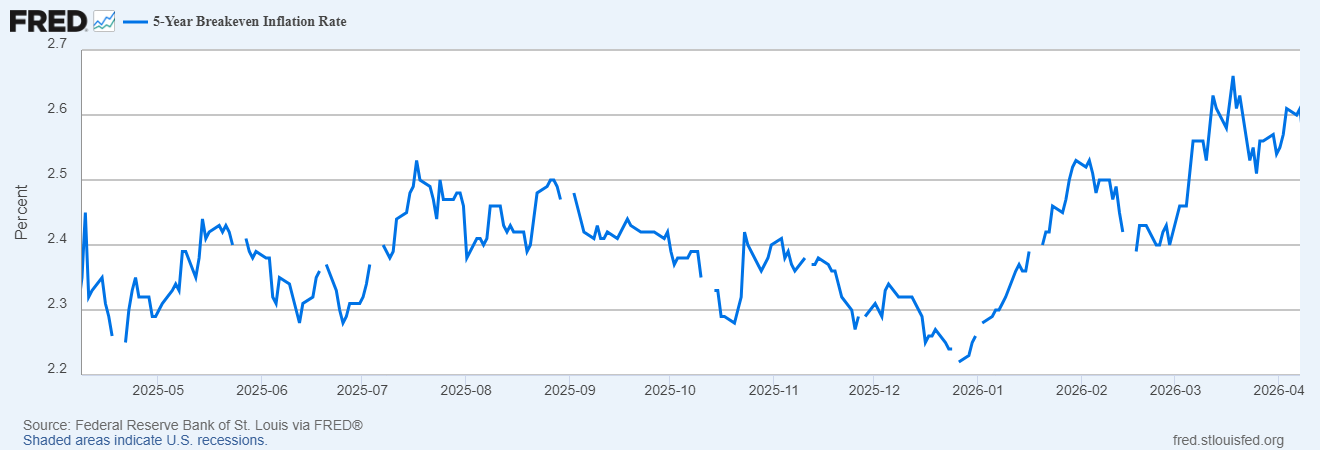
- Inflation expectations have risen. 5-year U.S. inflation expectations have increased from 2.2% to
2.6% since the beginning of the year.
- Inflation expectations have risen. 5-year U.S. inflation expectations have increased from 2.2% to
-
The OECD recently increased their expectations for G20 inflation to 4% in 2026, up from 2.8%, with U.S. inflation increasing to 4.2%.
-
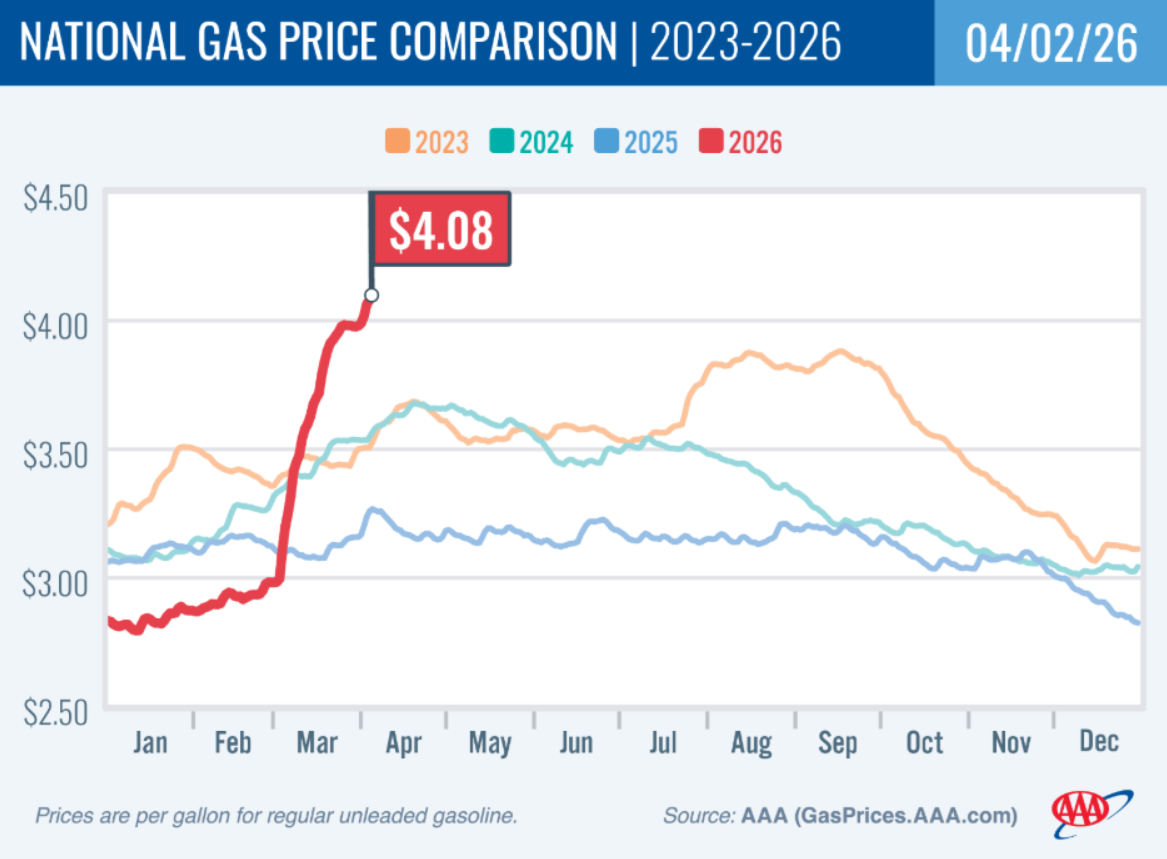
- The Consumer is under more pressure. Petrol prices have moved up globally eating into discretionary income, with ripple effects into cost of goods as petroleum-based raw materials and logistical costs move higher.
-
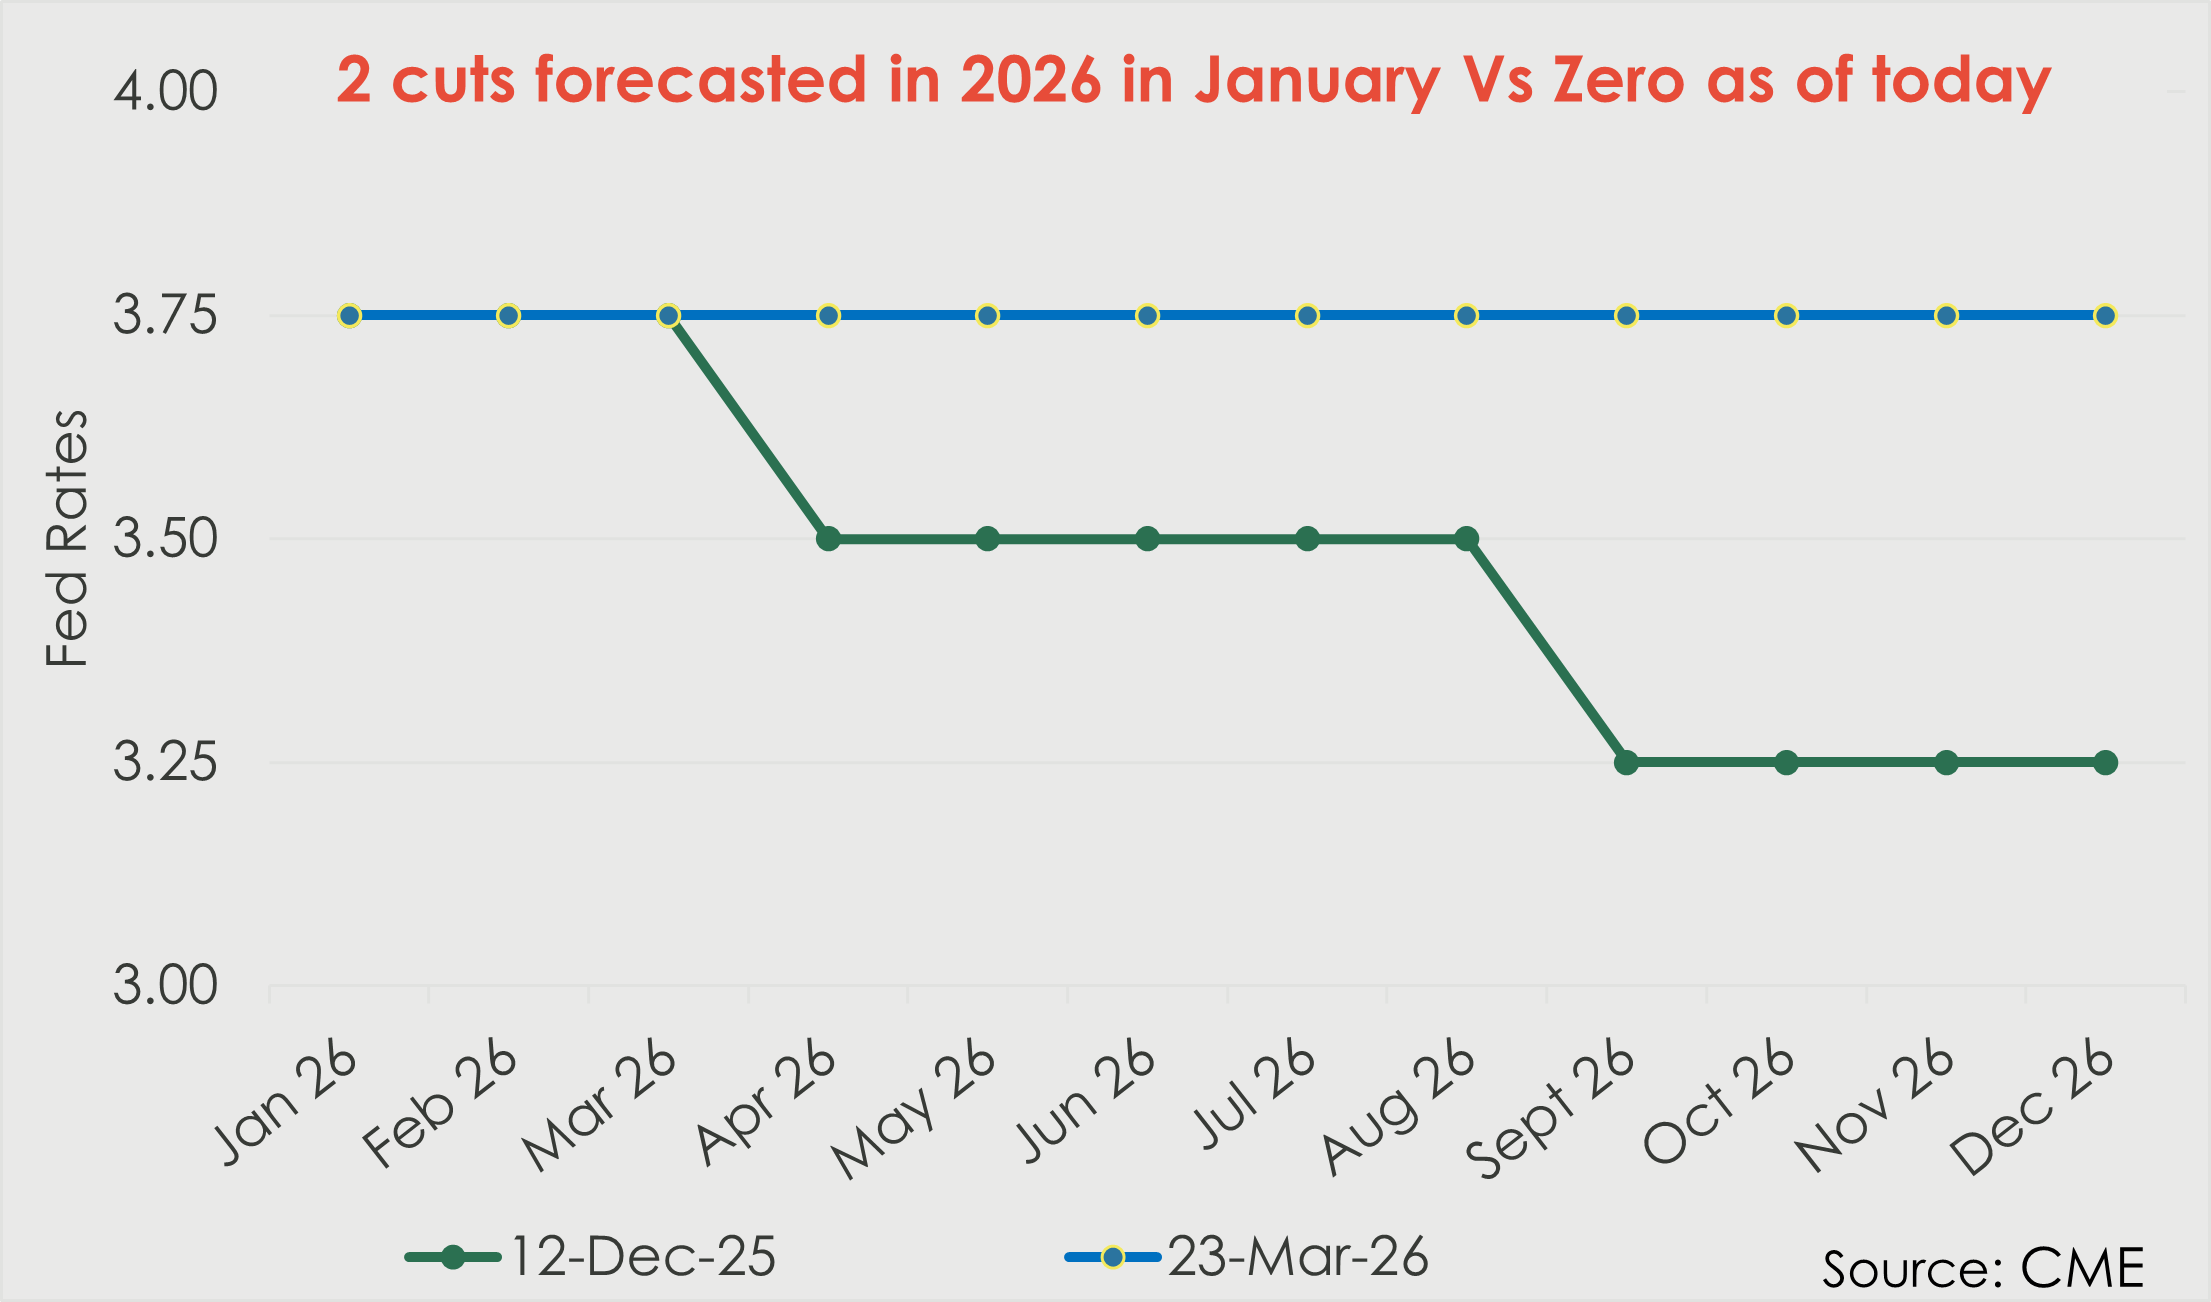
- Interest Rates are more likely to move higher than lower. Entering 2026, the expectations were for two further cuts this year, providing further monetary support to the economy. As the conflict in Iran continues to support elevated oil prices, any prospects for rate cuts have fallen away, with the next move by the Fed more likely to be a hike.
-
- Valuations have pulled back significantly. We entered 2026 with S&P 500 valuations at historical highs, around 23x. Over the last 6 weeks, we have seen valuations pull back approximately 17% to 19x.
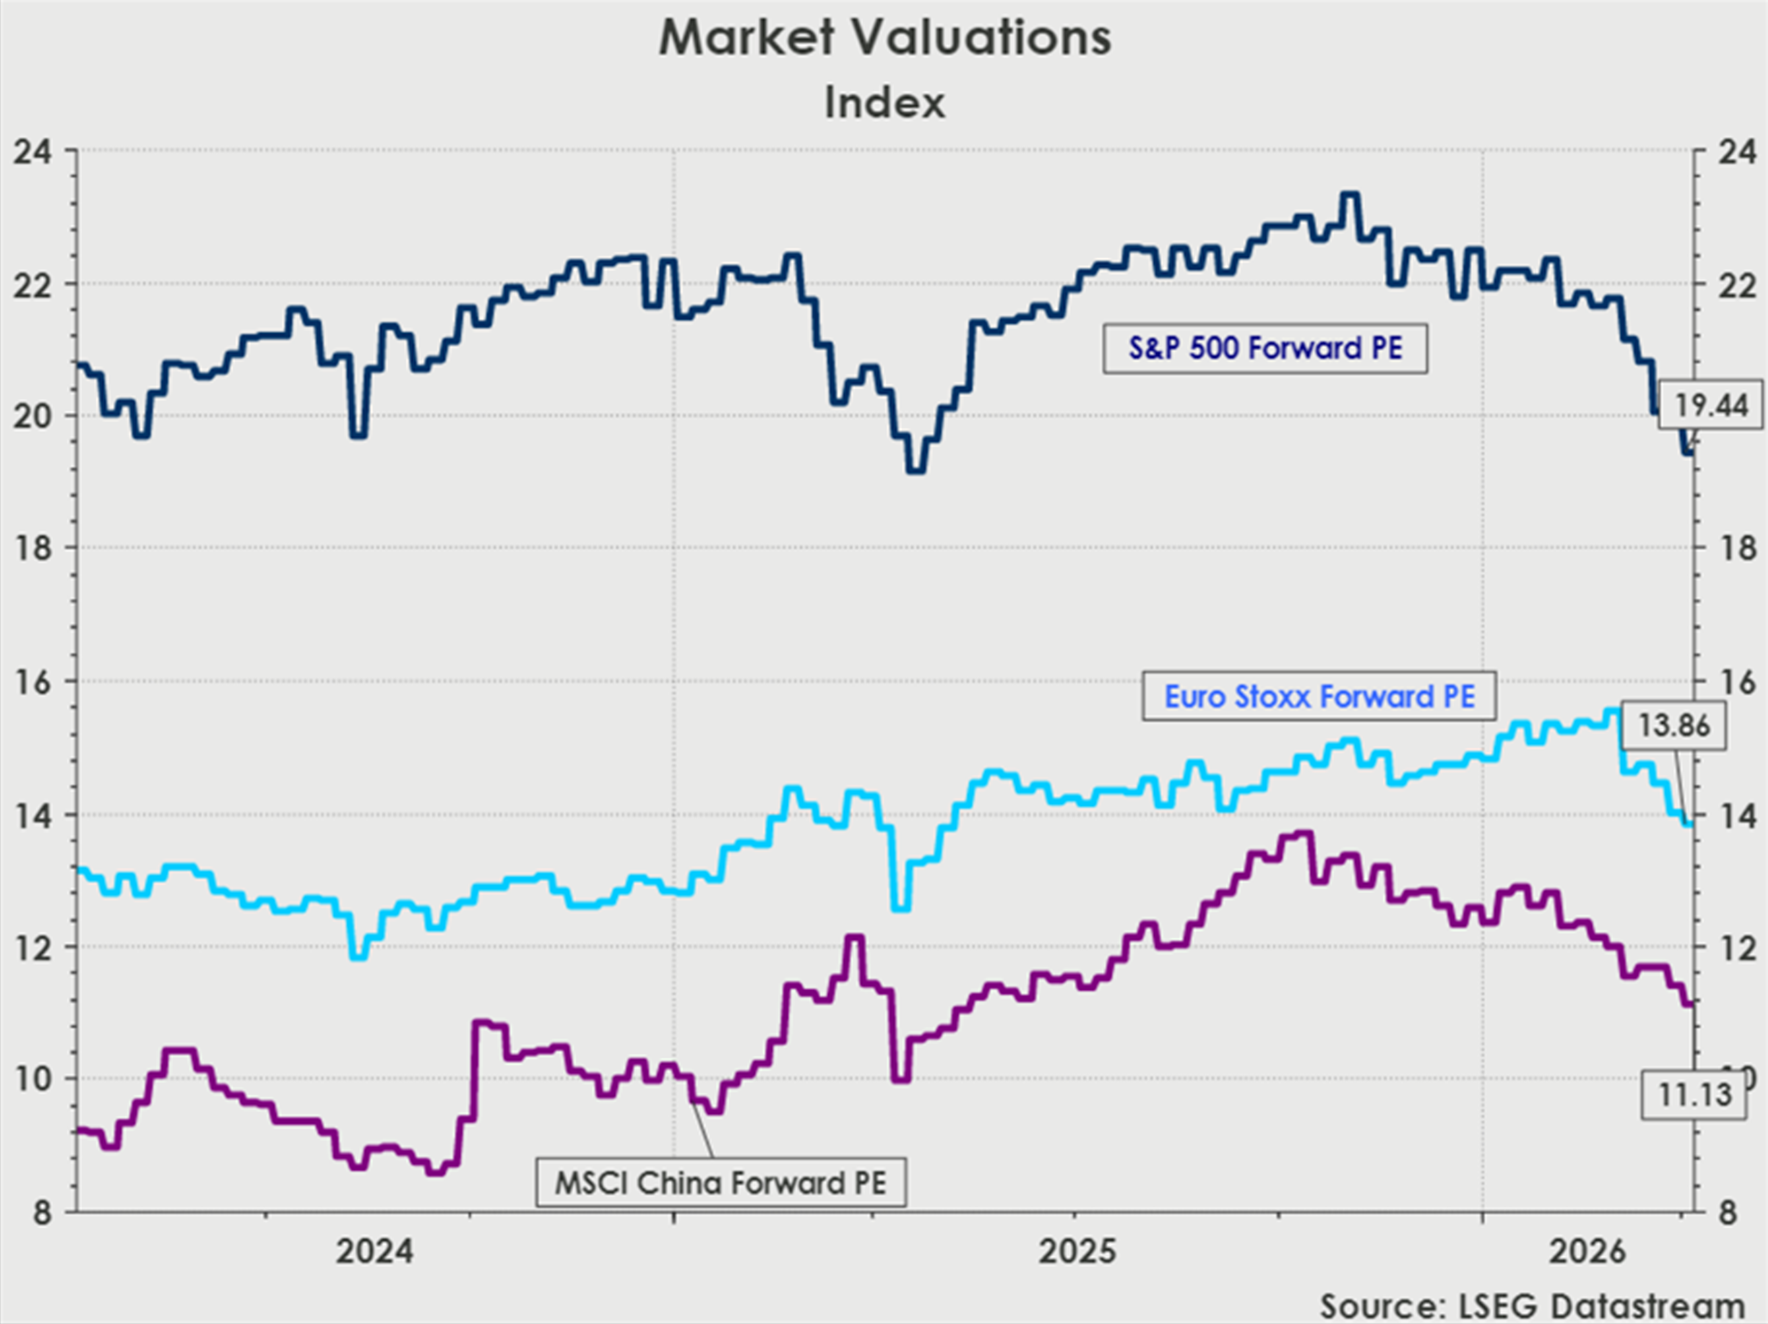
Despite this pullback in valuations, we have seen earnings estimates moving up; thus, lessening the impact on the market drawdown.
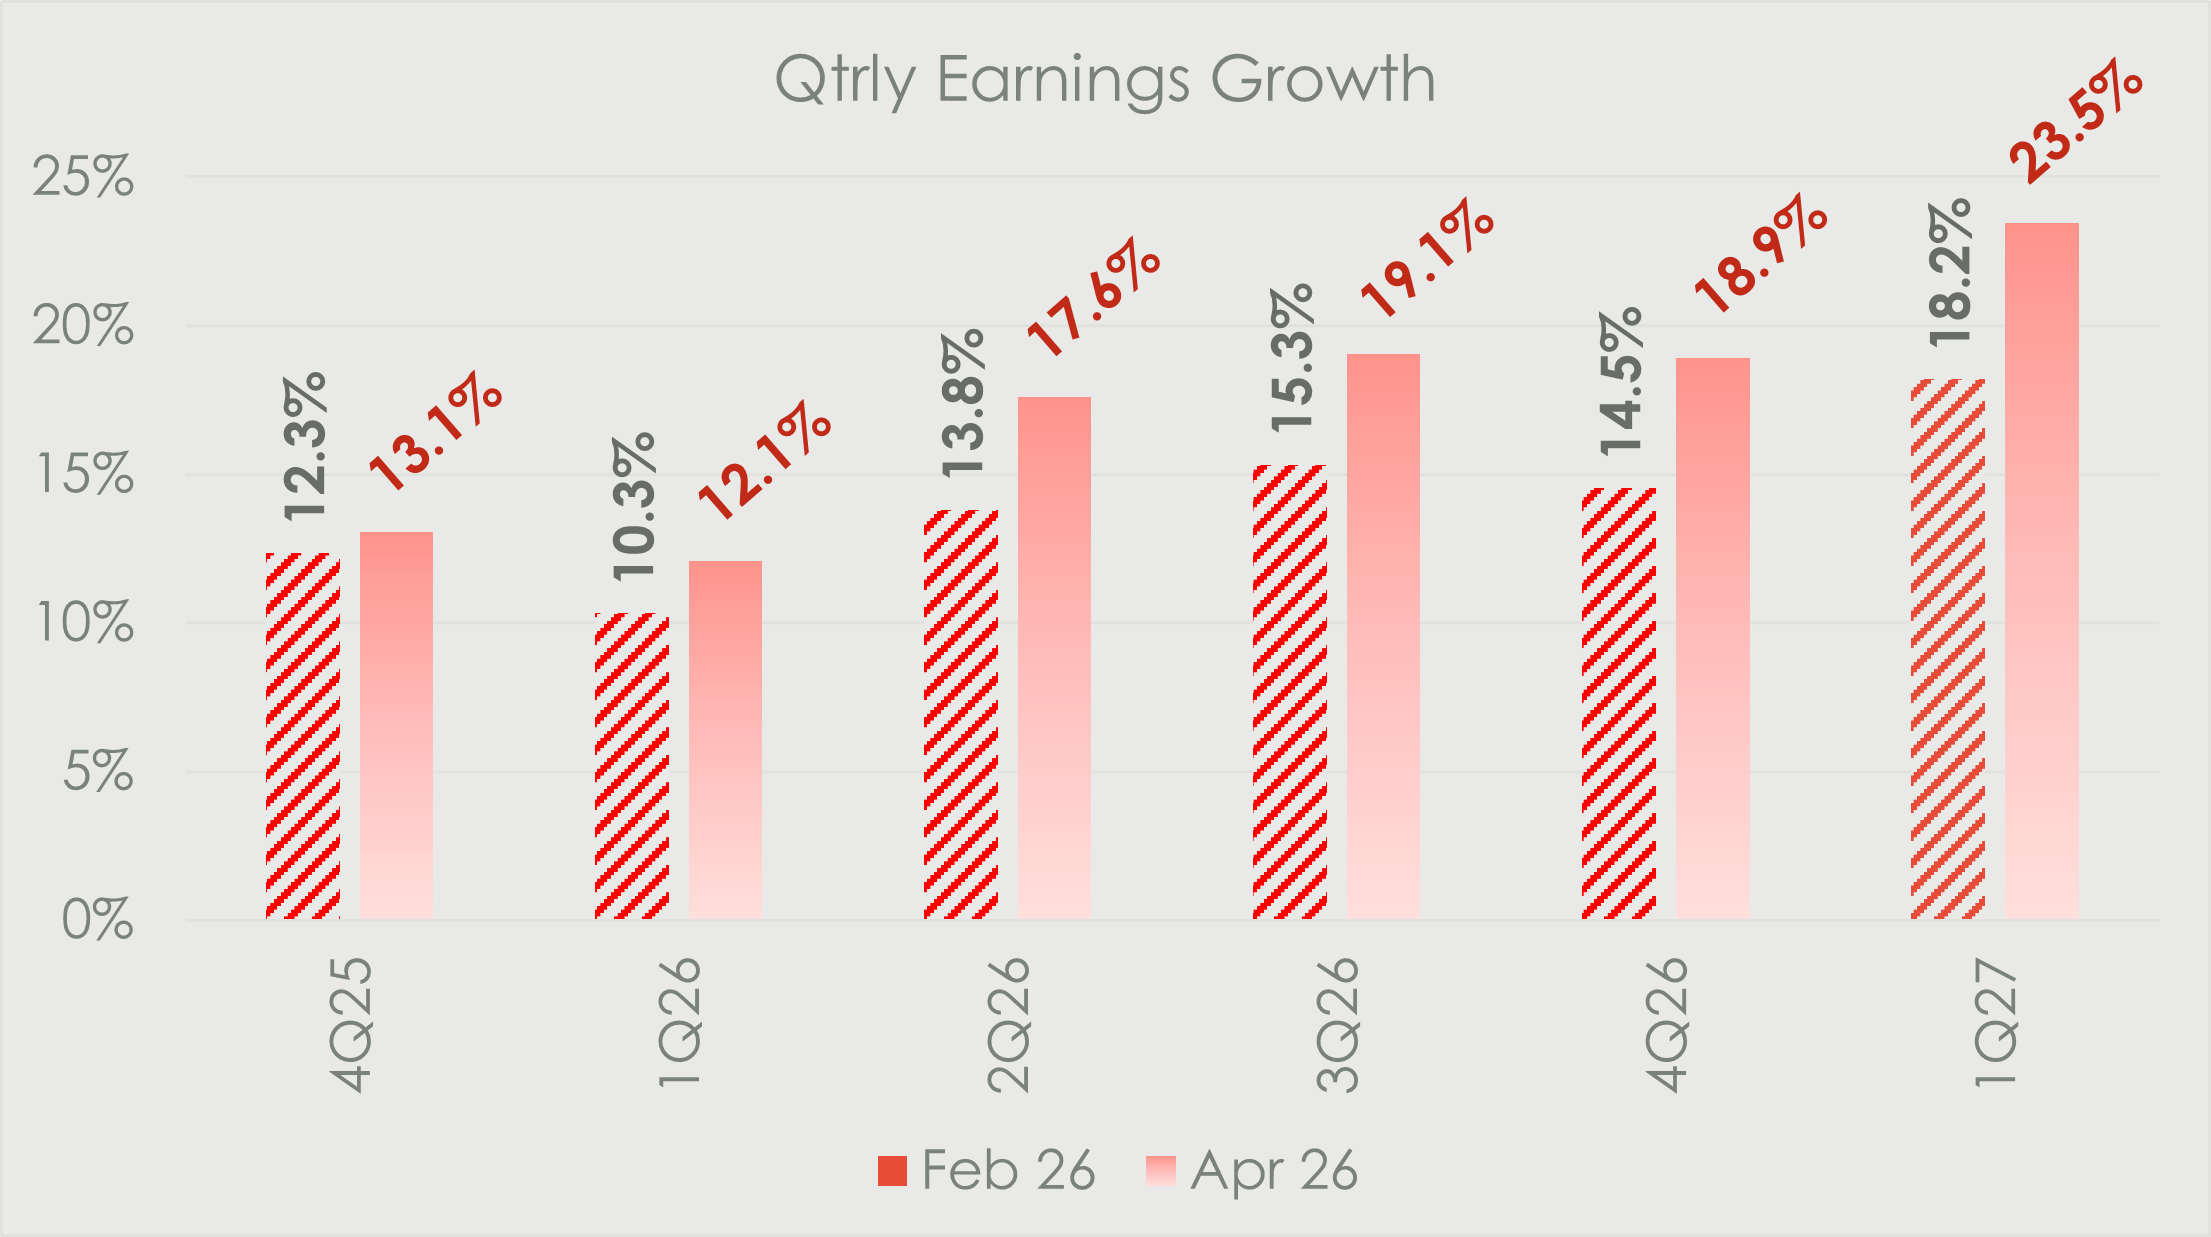
Given the duration of the conflict and the elevated oil and refined product prices, we believe that earnings during 2026 will be impacted. According to Jefferies’ estimates an average crude price of $90 for the year will reduce S&P 500 earnings growth by 5ppts. 1Q26 reporting season starts next week, where we will begin to hear from management teams about their expectations for the rest of the year given the changing economic environment.
Improvise, Adapt and Overcome
Given what we have been through in the last month and a half, it seems apt that we follow the motto of the U.S. Marines: Improvise, Adapt and Overcome. There is no doubt in our minds that the world is on a slightly different path than it was in February. With this in mind, it is prudent for us to keep our investment strategy fluid, quickly adapting to this changing environment:
-
- In an increasing cost environment, the adoption of AI to increase productivity could accelerate; benefitting the AI ecosystem which remains in overdrive.
- In a world where economic growth is slowing, growth becomes a precious commodity.
- Companies with pricing power justify premium valuations. A new commodity cycles kicks off as countries rebuild, replenish supplies, and look to secure strategic independence.
In this month’s Wood for the Trees we address the following areas:
Much like the changing global dynamics brought about by the conflict in the Middle East, local market investment factors are also shifting. We revisit our investment outlook for the rest of 2026.
Given the current turbulence in the Middle East, it is easy to become myopic and not see the wood for the trees. As we head into 2026 there a several major events that have the potential to move markets, none more so than the U.S. midterms in November. Liza keeps us updated on what we can expect.
The volatility in March and changing investment environment has led to a few changes and tweaks to the portfolios. We take you through all the portfolio movements for the month.
Pepkor is one of the most exciting SA growth stories we have seen since Capitec. Anda had the opportunity to join the Pepkor management team at their Capital Markets Day in Cape Town recently. He takes us through his takeaways in more detail, coming away with renewed excitement about Pepkor’s new ventures into the financial services and informal sector space.

By the Numbers
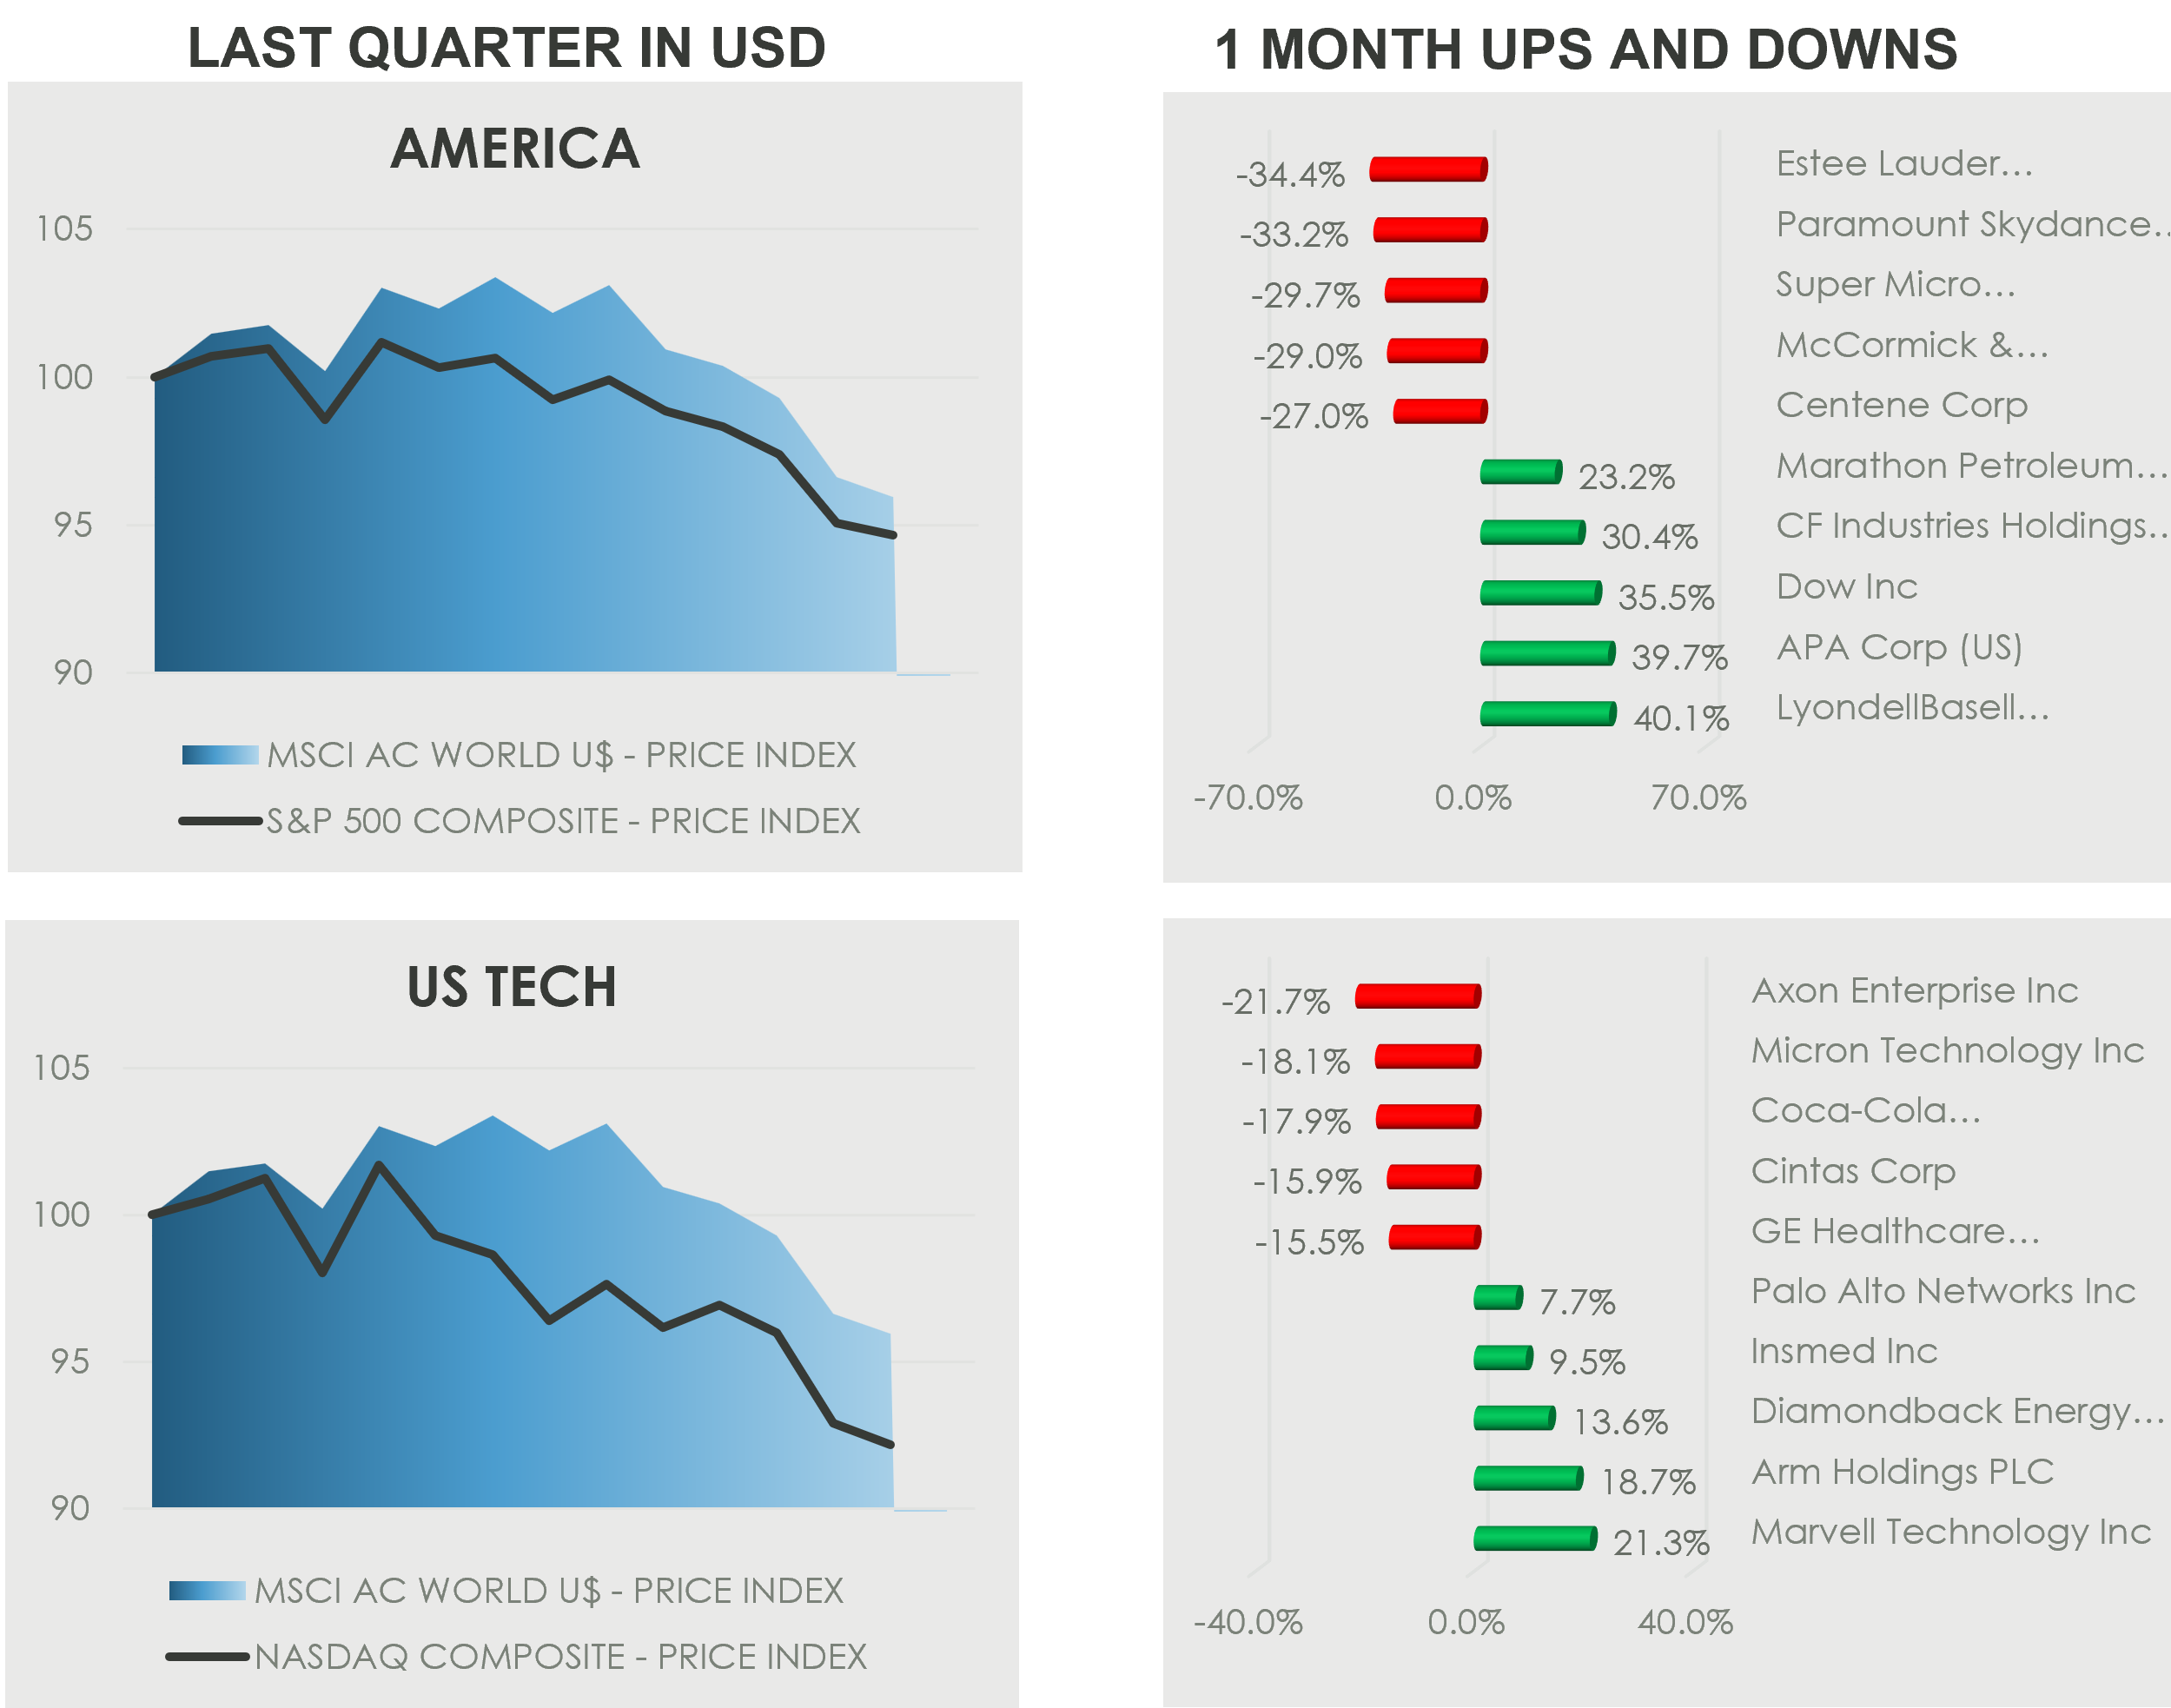
Global markets pulled back in March as conflict in the Middle East escalated, leading to broad-based selling. The price of oil spiked as markets focused on the disruption to global oil supplies, with knock-on implications for inflation and economic growth. In the U.S., the S&P 500 declined -5.1% and the Nasdaq 100 fell -4.9%.
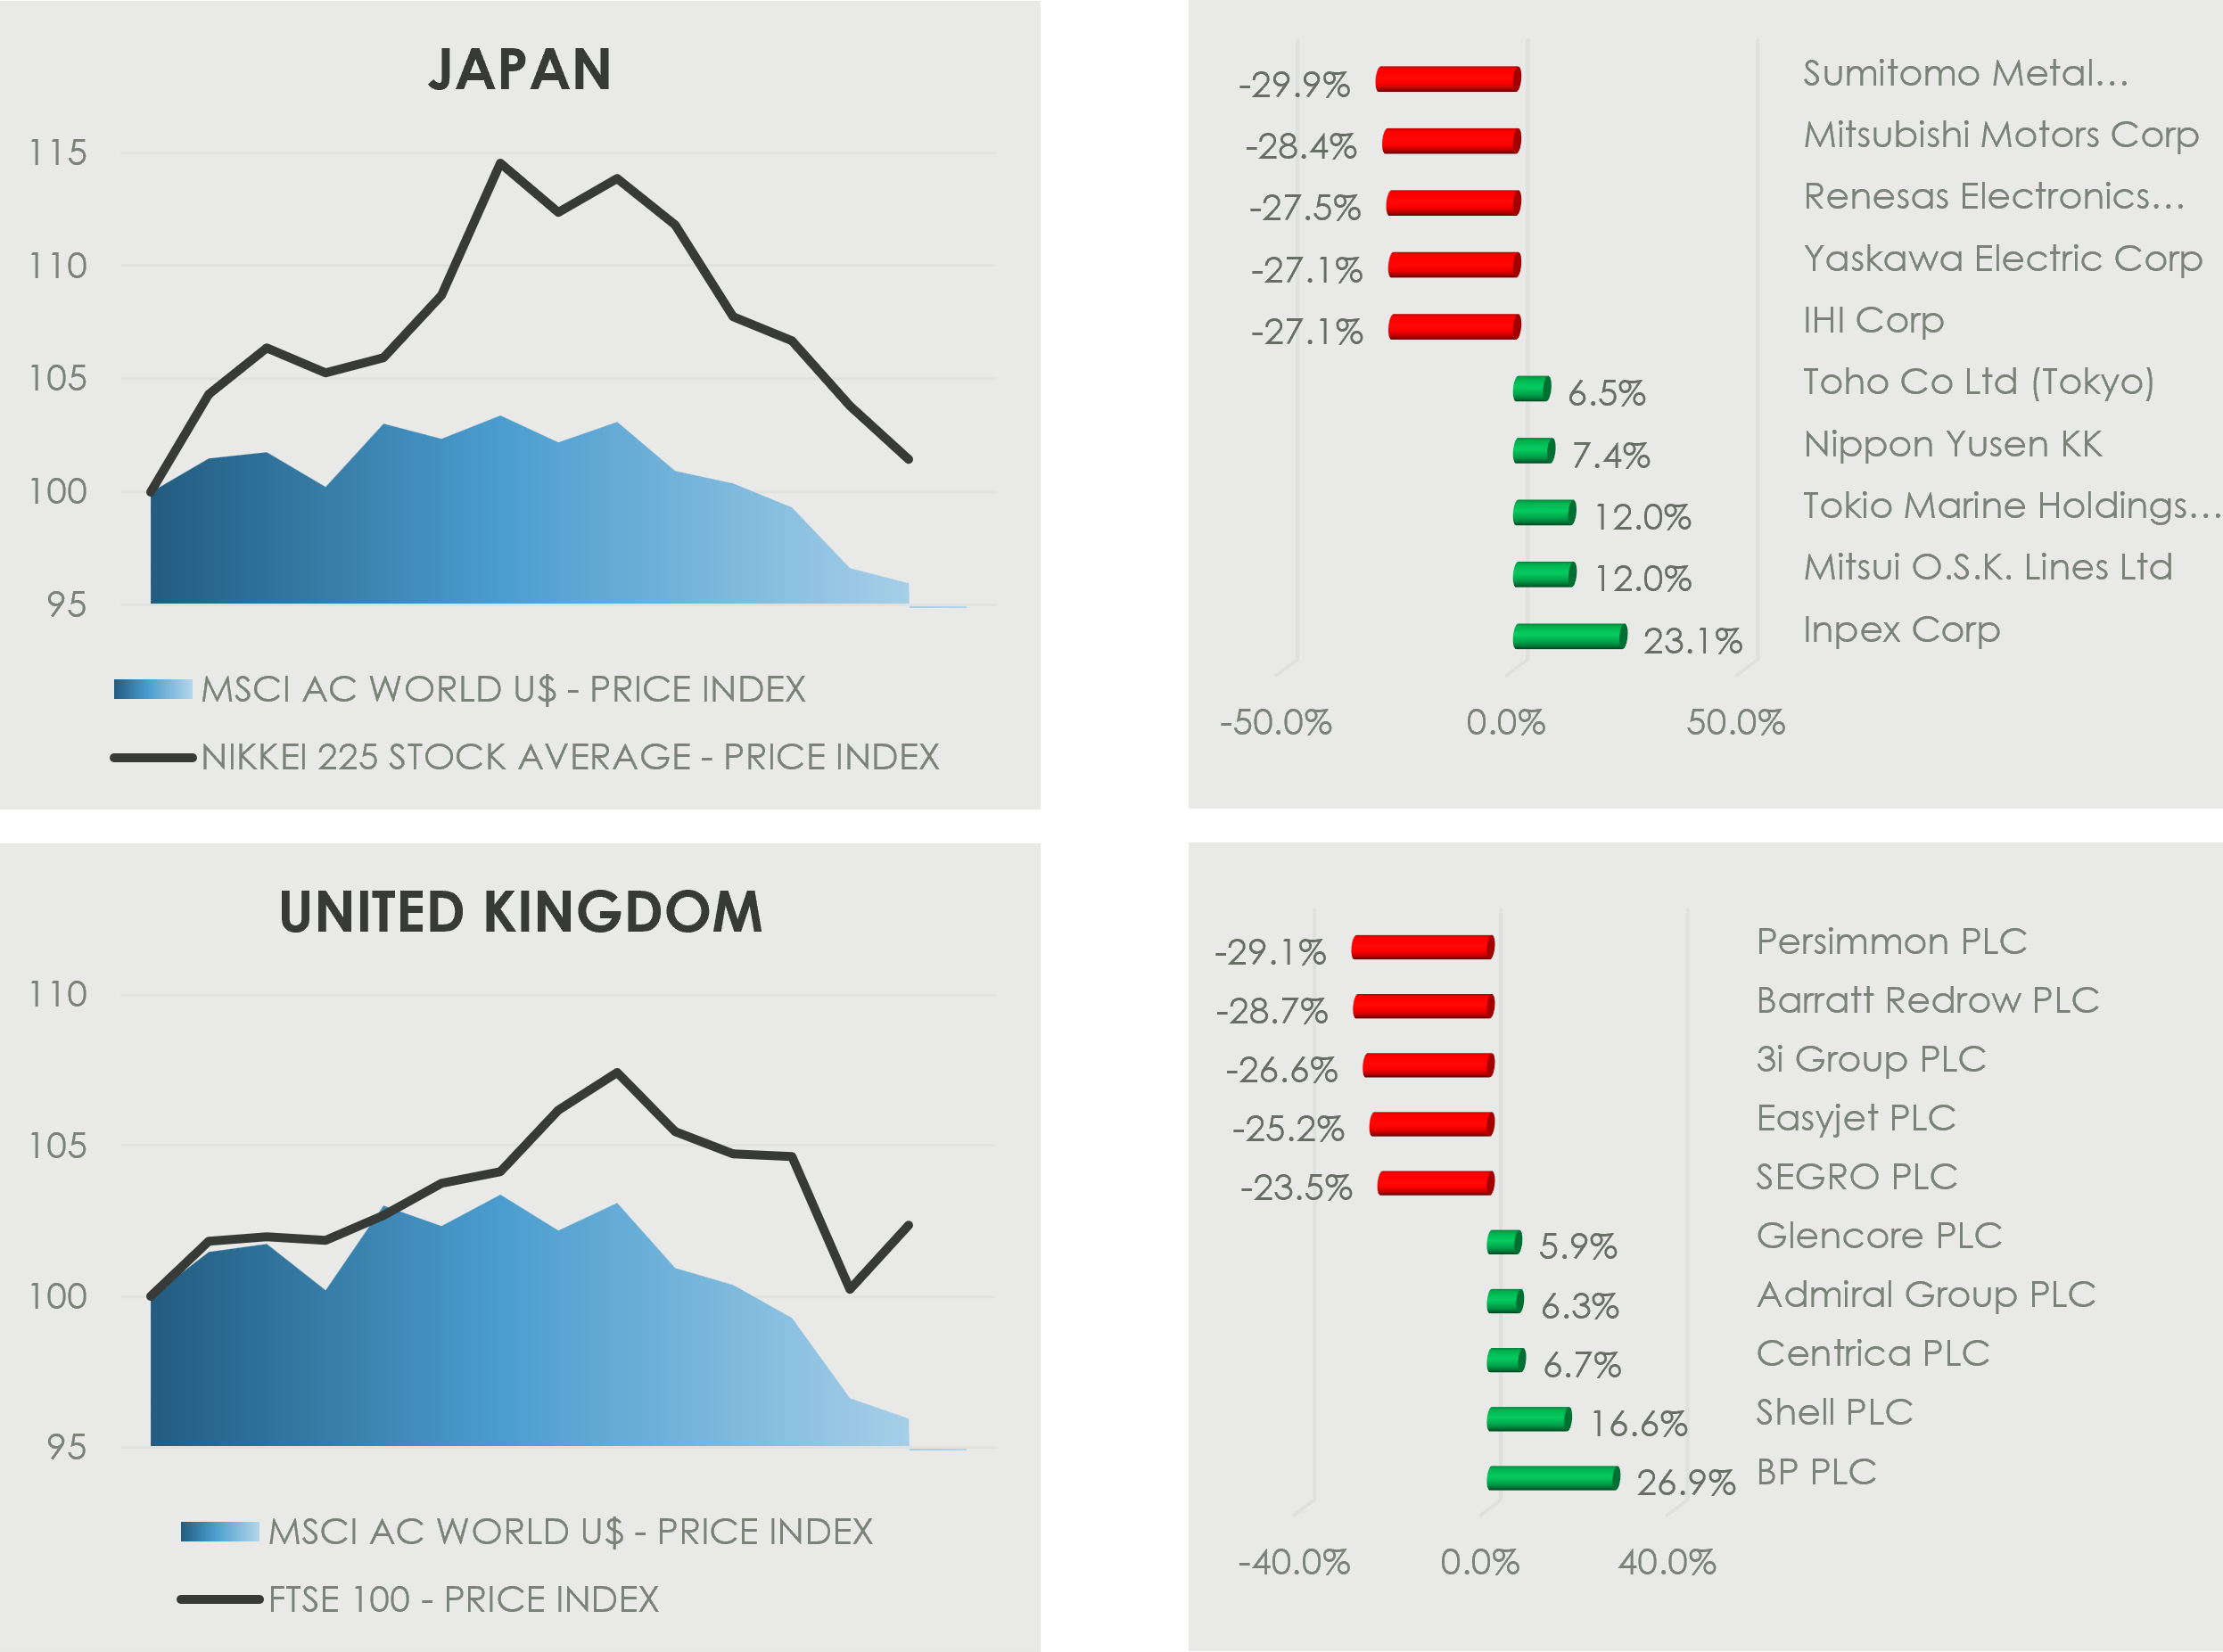
Energy and chemicals led the gains; LyondellBasell (+40.1%), APA Corp (+39.7%), Dow (+35.5%), CF Industries (+30.4%), Marathon Petroleum (+23.2%), and Diamondback Energy (+13.6%). Semiconductor and AI-related names, Marvell (+21.3%) rallied after forecasting better-than-expected revenue, and Arm (+18.7%) gained after unveiling a new AI chip. On the downside, Estée Lauder (–34.4%) and McCormick (-29.0%) fell after confirming that they are both in merger talks with Puig and Unilever’s food business,respectively. Super Micro Computer (–26.9%) dropped after the U.S. Justice Department charged three employees with smuggling U.S.-made servers through Taiwan to China.
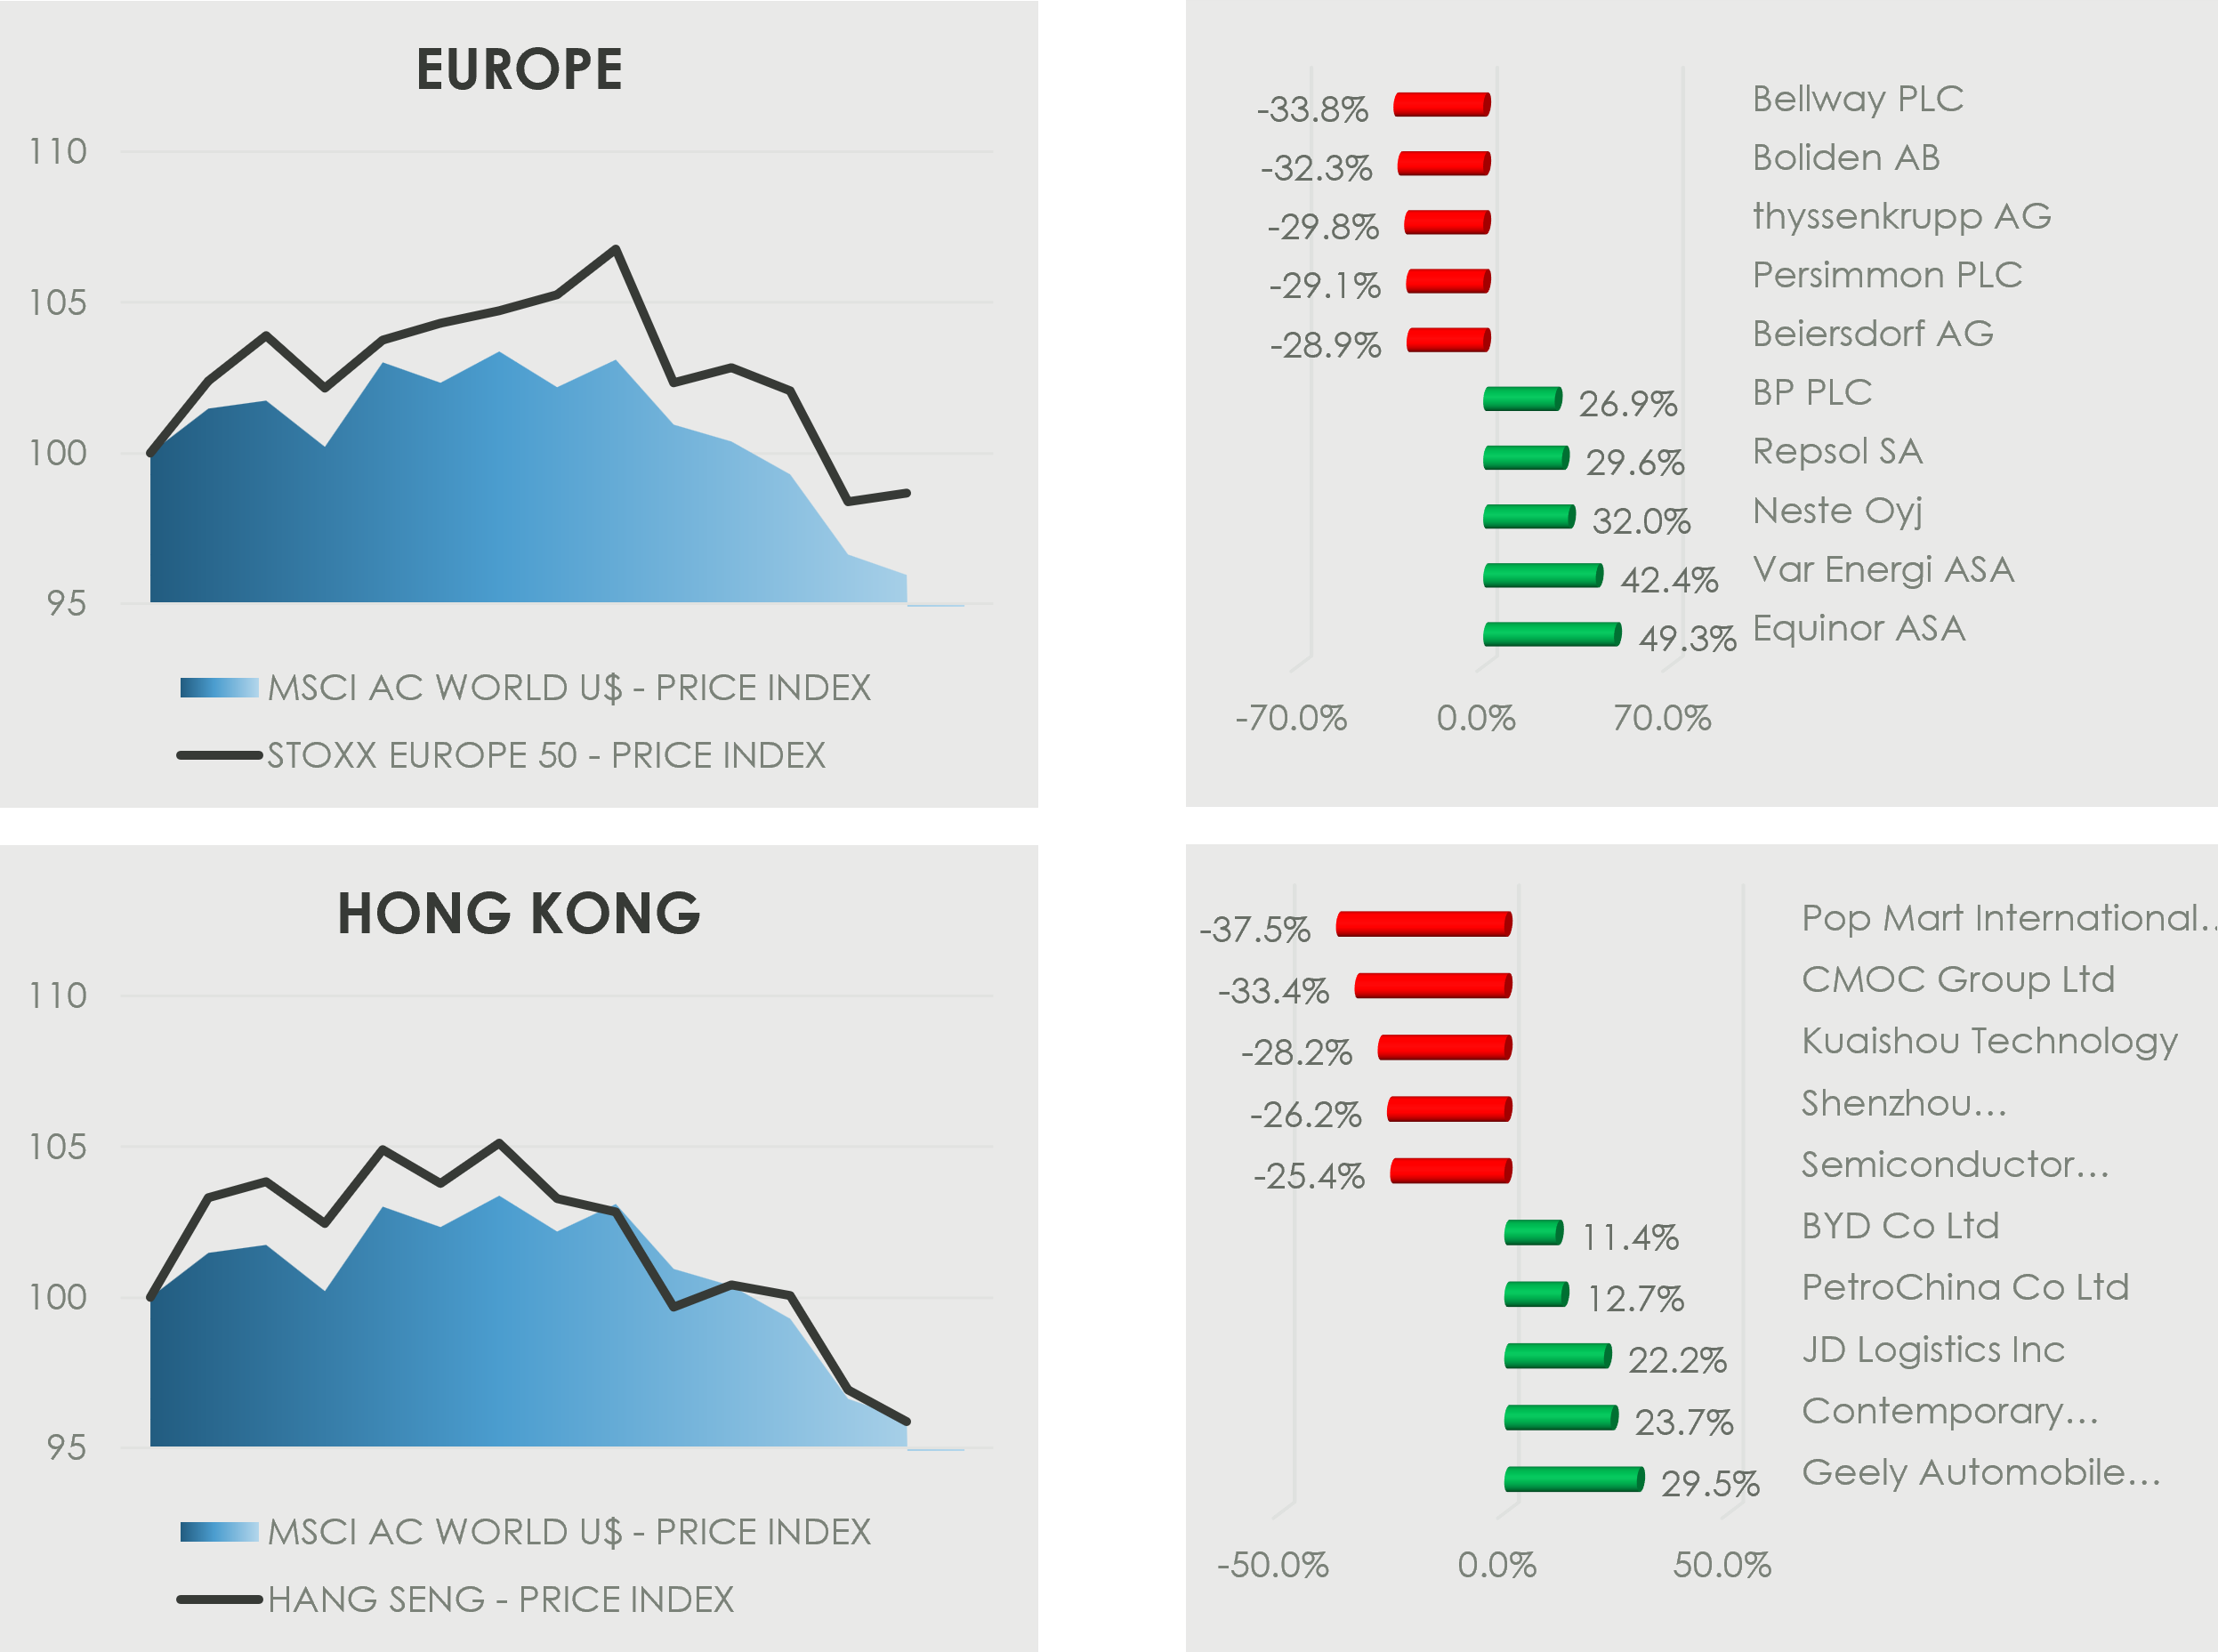
In Europe, losses were more pronounced as the FTSE 100 dropped -6.7%, Europe 600 fell -8.0%, and Germany’s DAX declined -10.3%. Energy was also the standout sector. Equinor (+49.3%), Var Energi (+42.4%), Neste (+32.0%, Repsol (+29.6%), BP (+26.9%), and Shell (+16.6%) all closed higher on higher oil and gas prices. By contrast, Bellway (-33.8%), Persimmon (–29.1%) and Barratt Redrow (–8.7%) declined amid ongoing pressure in the housing market.
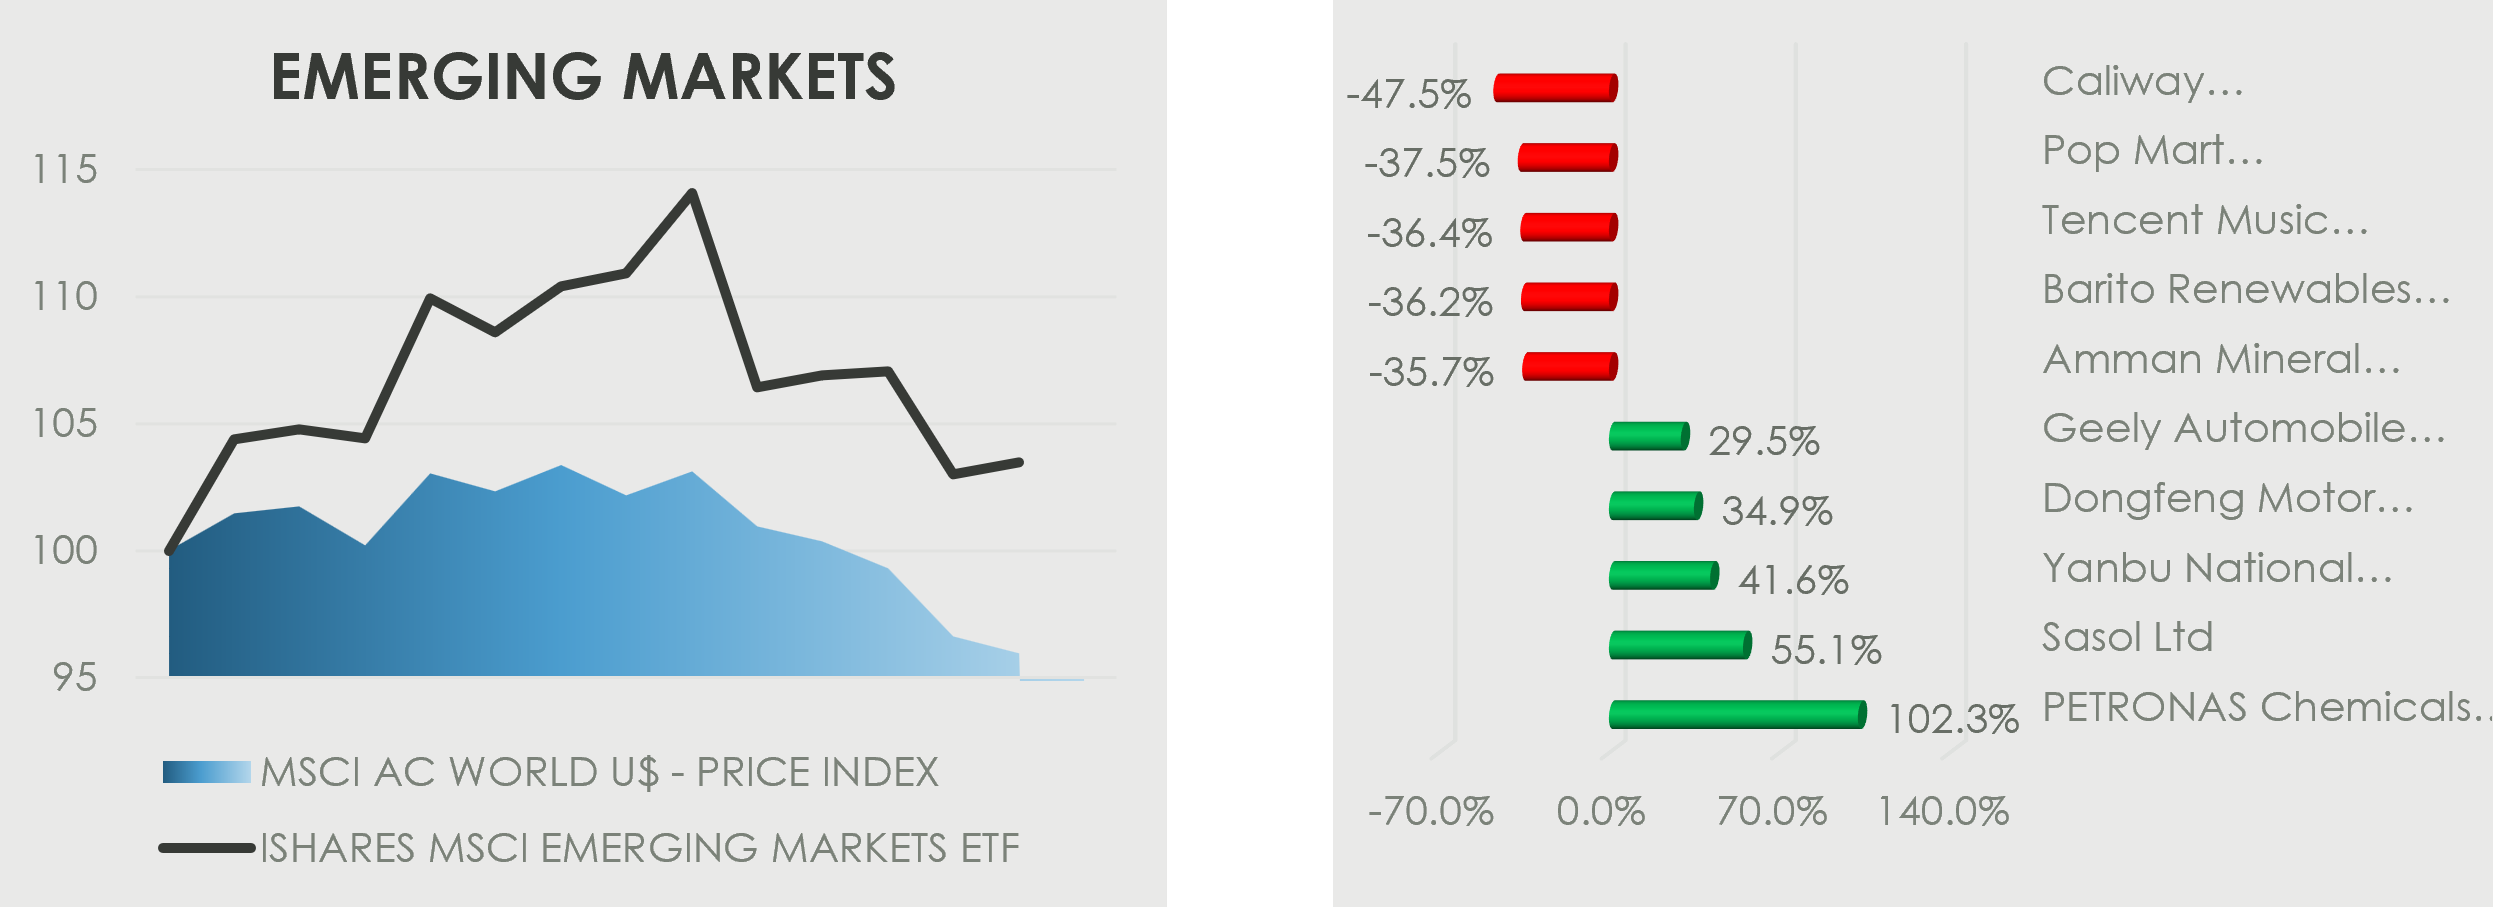
In Hong Kong and Emerging markets, autos and energy stocks led the market. On the energy side: Petronas (+102.3%), Sasol (+55.1%), Yanbu National (+41.6%), and PetroChina (+12.7%). Dongfeng (+34.9%), Geely (+29.5%), and BYD (+11.4%) advanced on stronger vehicle sales, and JD Logistics (+22.2%) benefitted from improved delivery volumes. On the other hand, Pop Mart (-37.5%) and Tencent Music (-36.4%) fell after missing earnings estimates.
Looking Beyond the Noise: Key Highlights for the Rest of 2026
With headlines changing by the hour, it is easy to get swamped by the day-to-day noise. Looking further out, however, there are several important events in the remainder of 2026 that could have an impact on
markets.
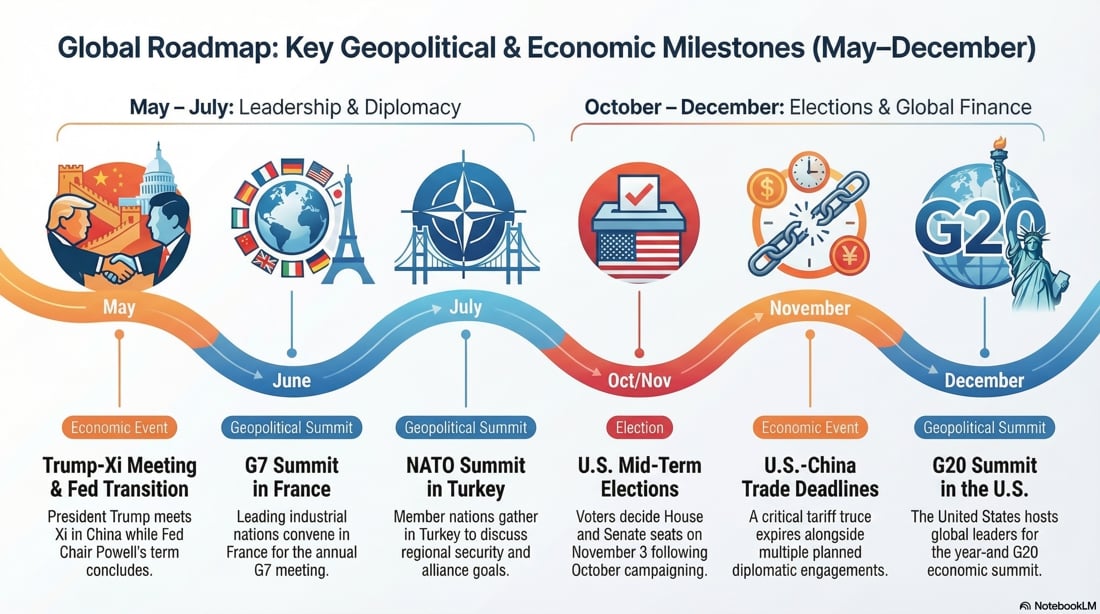
Starting near-term, attention will be on the expected meeting between President Donald Trump and President Xi Jinging. Originally, the two were reported to meet at the end of March, early April but are now due to meet mid-May. Washington experts don’t expect there to be an escalation in relations, but rather one of stability, with potential upside surprise. They expect the current tariff deal between the U.S. and China to remain in place for the next 3 years – as countries decide to rather stay with the certainty of current deals instead of receiving new tariffs such as Section 301 etc, after the U.S. Supreme Court ruled that the IEEPA tariffs were made outside of the President’s authority.
In the U.S., May brings another milestone: the end of Jerome Powell’s term as Fed Chair. Even if the broad path of monetary policy remains data dependent – with the Fed’s dual mandate of maximum
employment and stable inflation – the market will be sensitive to any indication of who the next Fed Chair may be and whether that implies a shift in policy tone. Understandably, the Fed’s next steps will also have to be determined keeping in mind that the higher oil prices will have knock-on implications for inflation and economic growth.
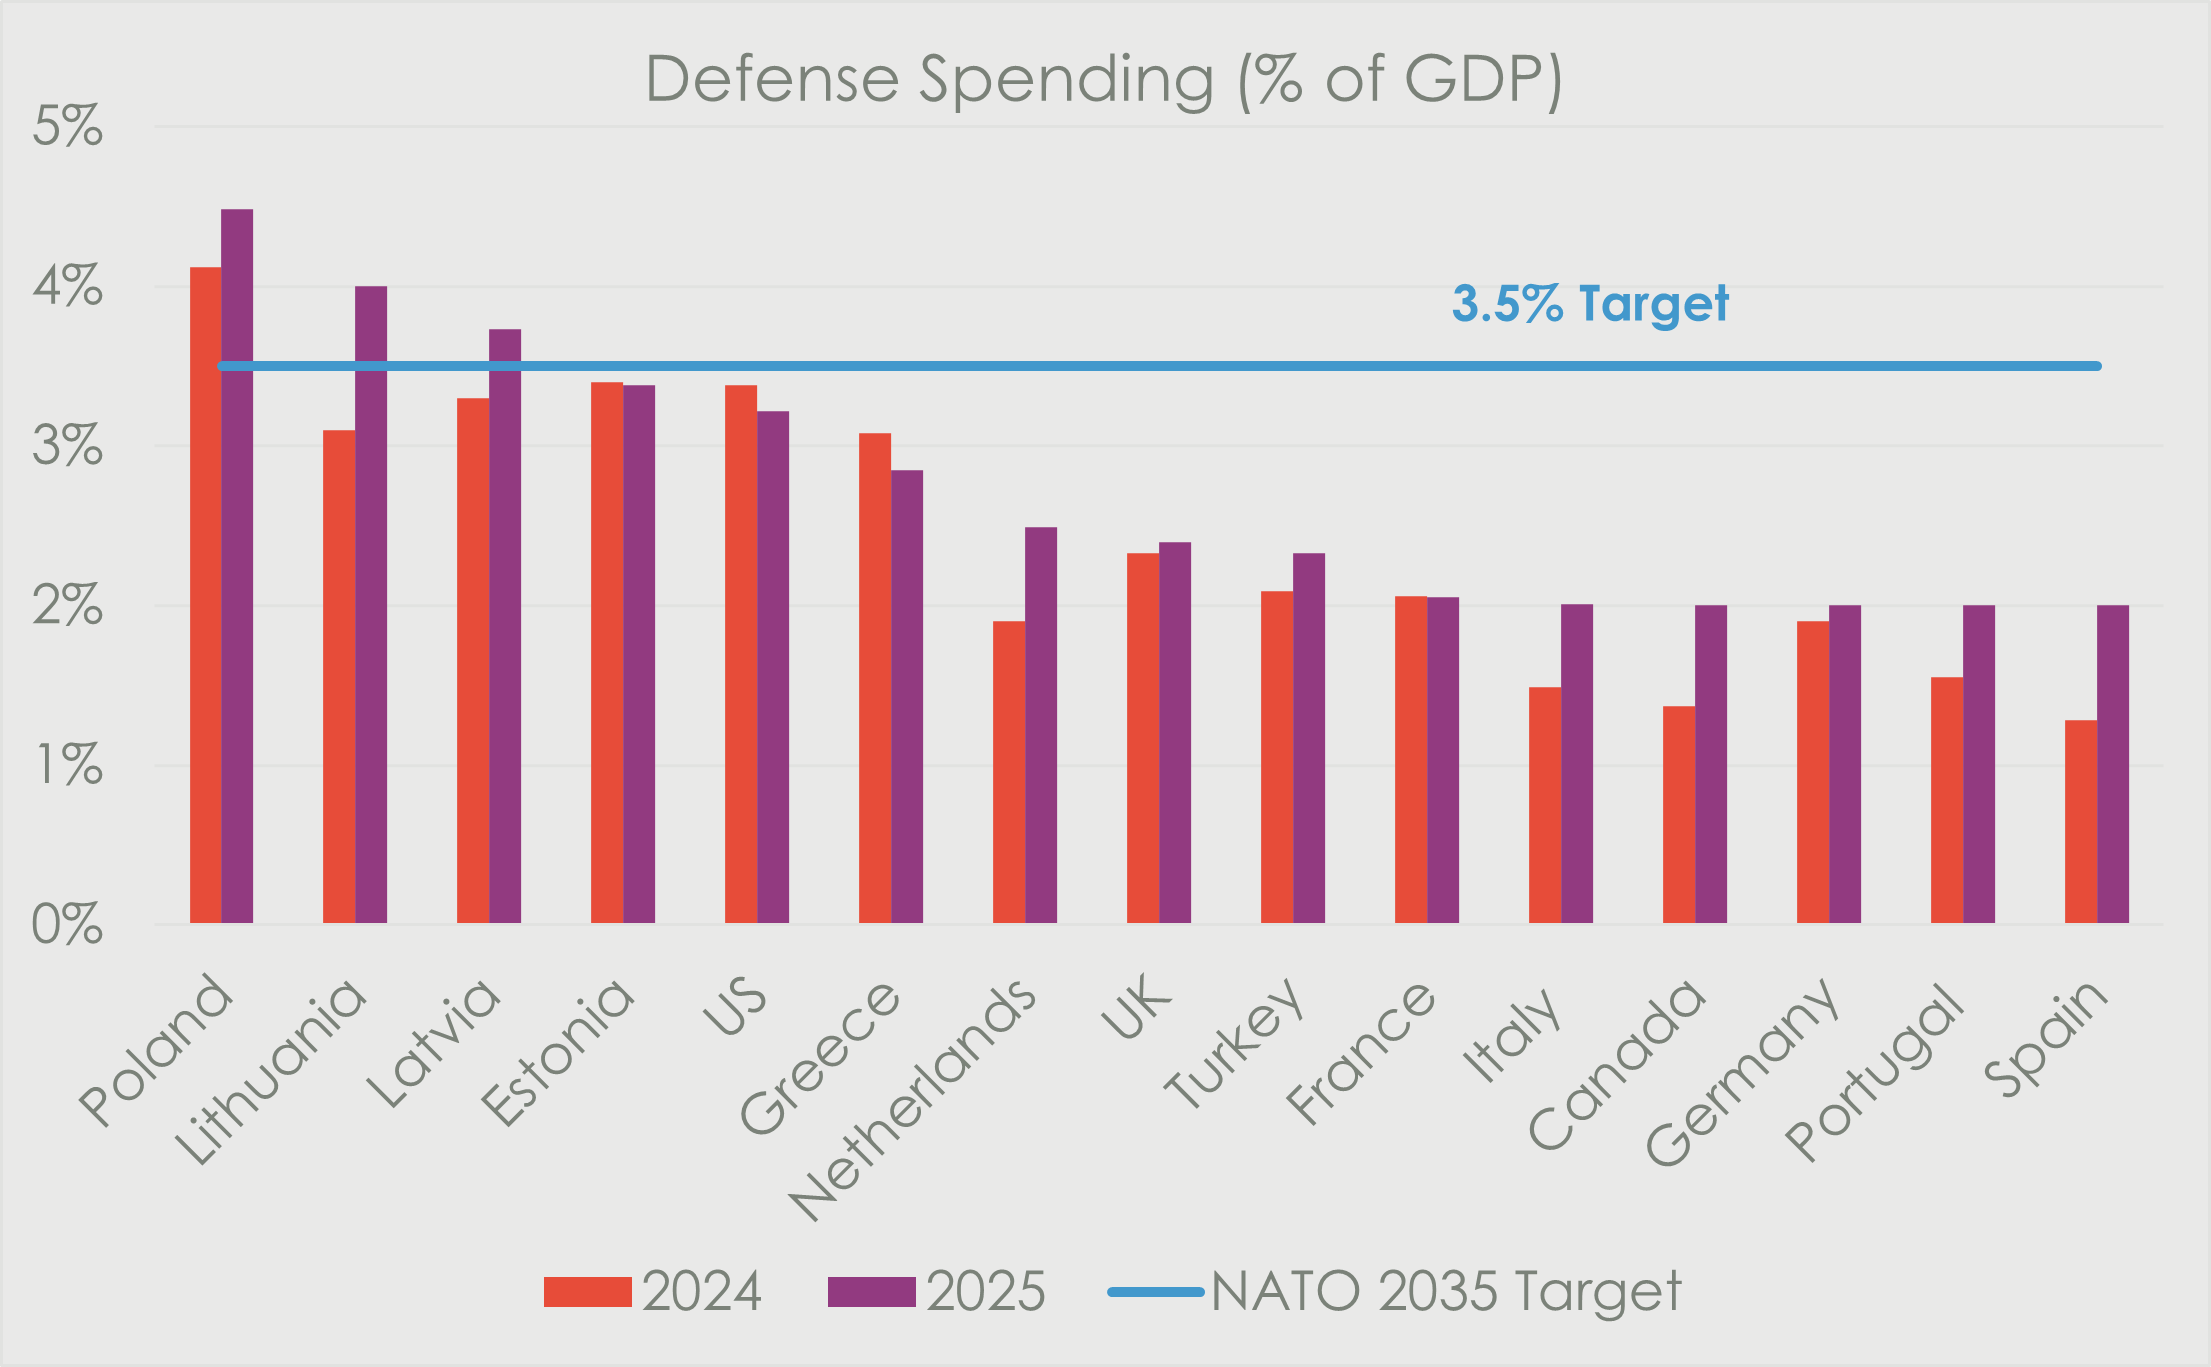
Geopolitics will be in focus in the middle of the year, with the G7 meeting in France and the NATO summit in Turkey, as well as the G20 meeting in the U.S. at the end of the year. Neither event is likely to drive markets in isolation, but both will help shape the backdrop for defence spending, transatlantic relations/alliances, and broader geopolitical dynamics that investors will have to navigate.
Later in the year, all eyes will be on U.S. midterm elections that will be held on November 3rd, 2026. These elections are particularly important because they will determine who fills the seats in the House of Representatives and the Senate, and consequently determine who has legislative power in the U.S. government. If one party controls both chambers, it becomes much easier to pass laws and address key policy areas such as taxes, healthcare, and regulation.
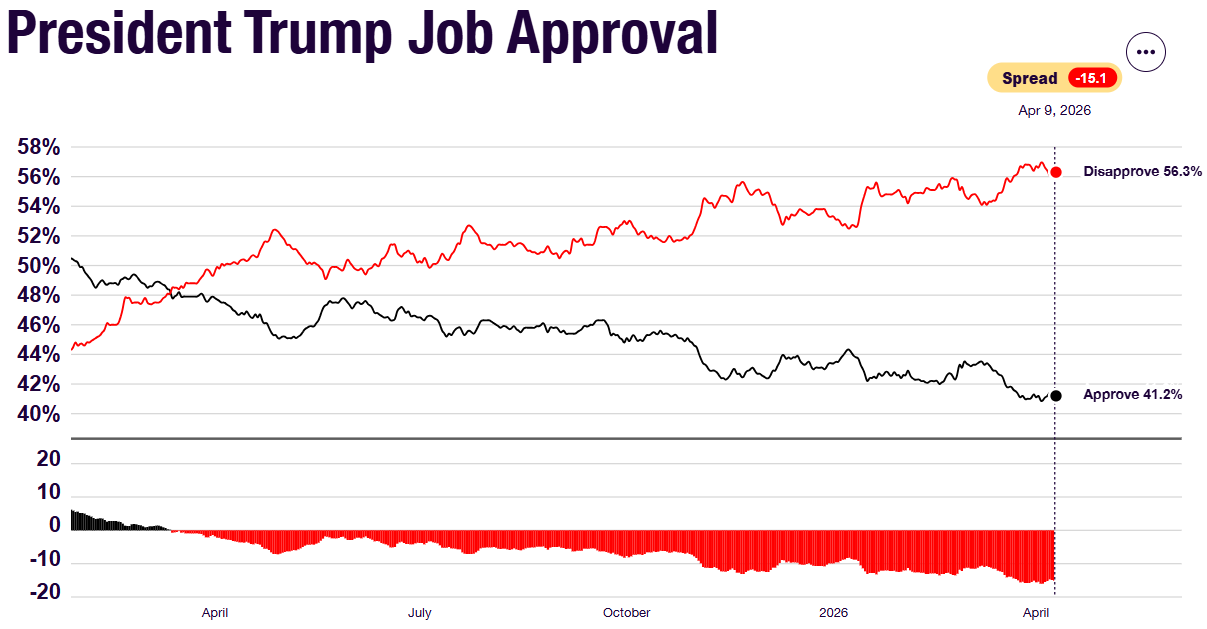
As it currently stands, President Trump’s approval rating has recently hit new lows, with rising fuel prices and growing disapproval on jobs prospects and the economy.

By the Numbers
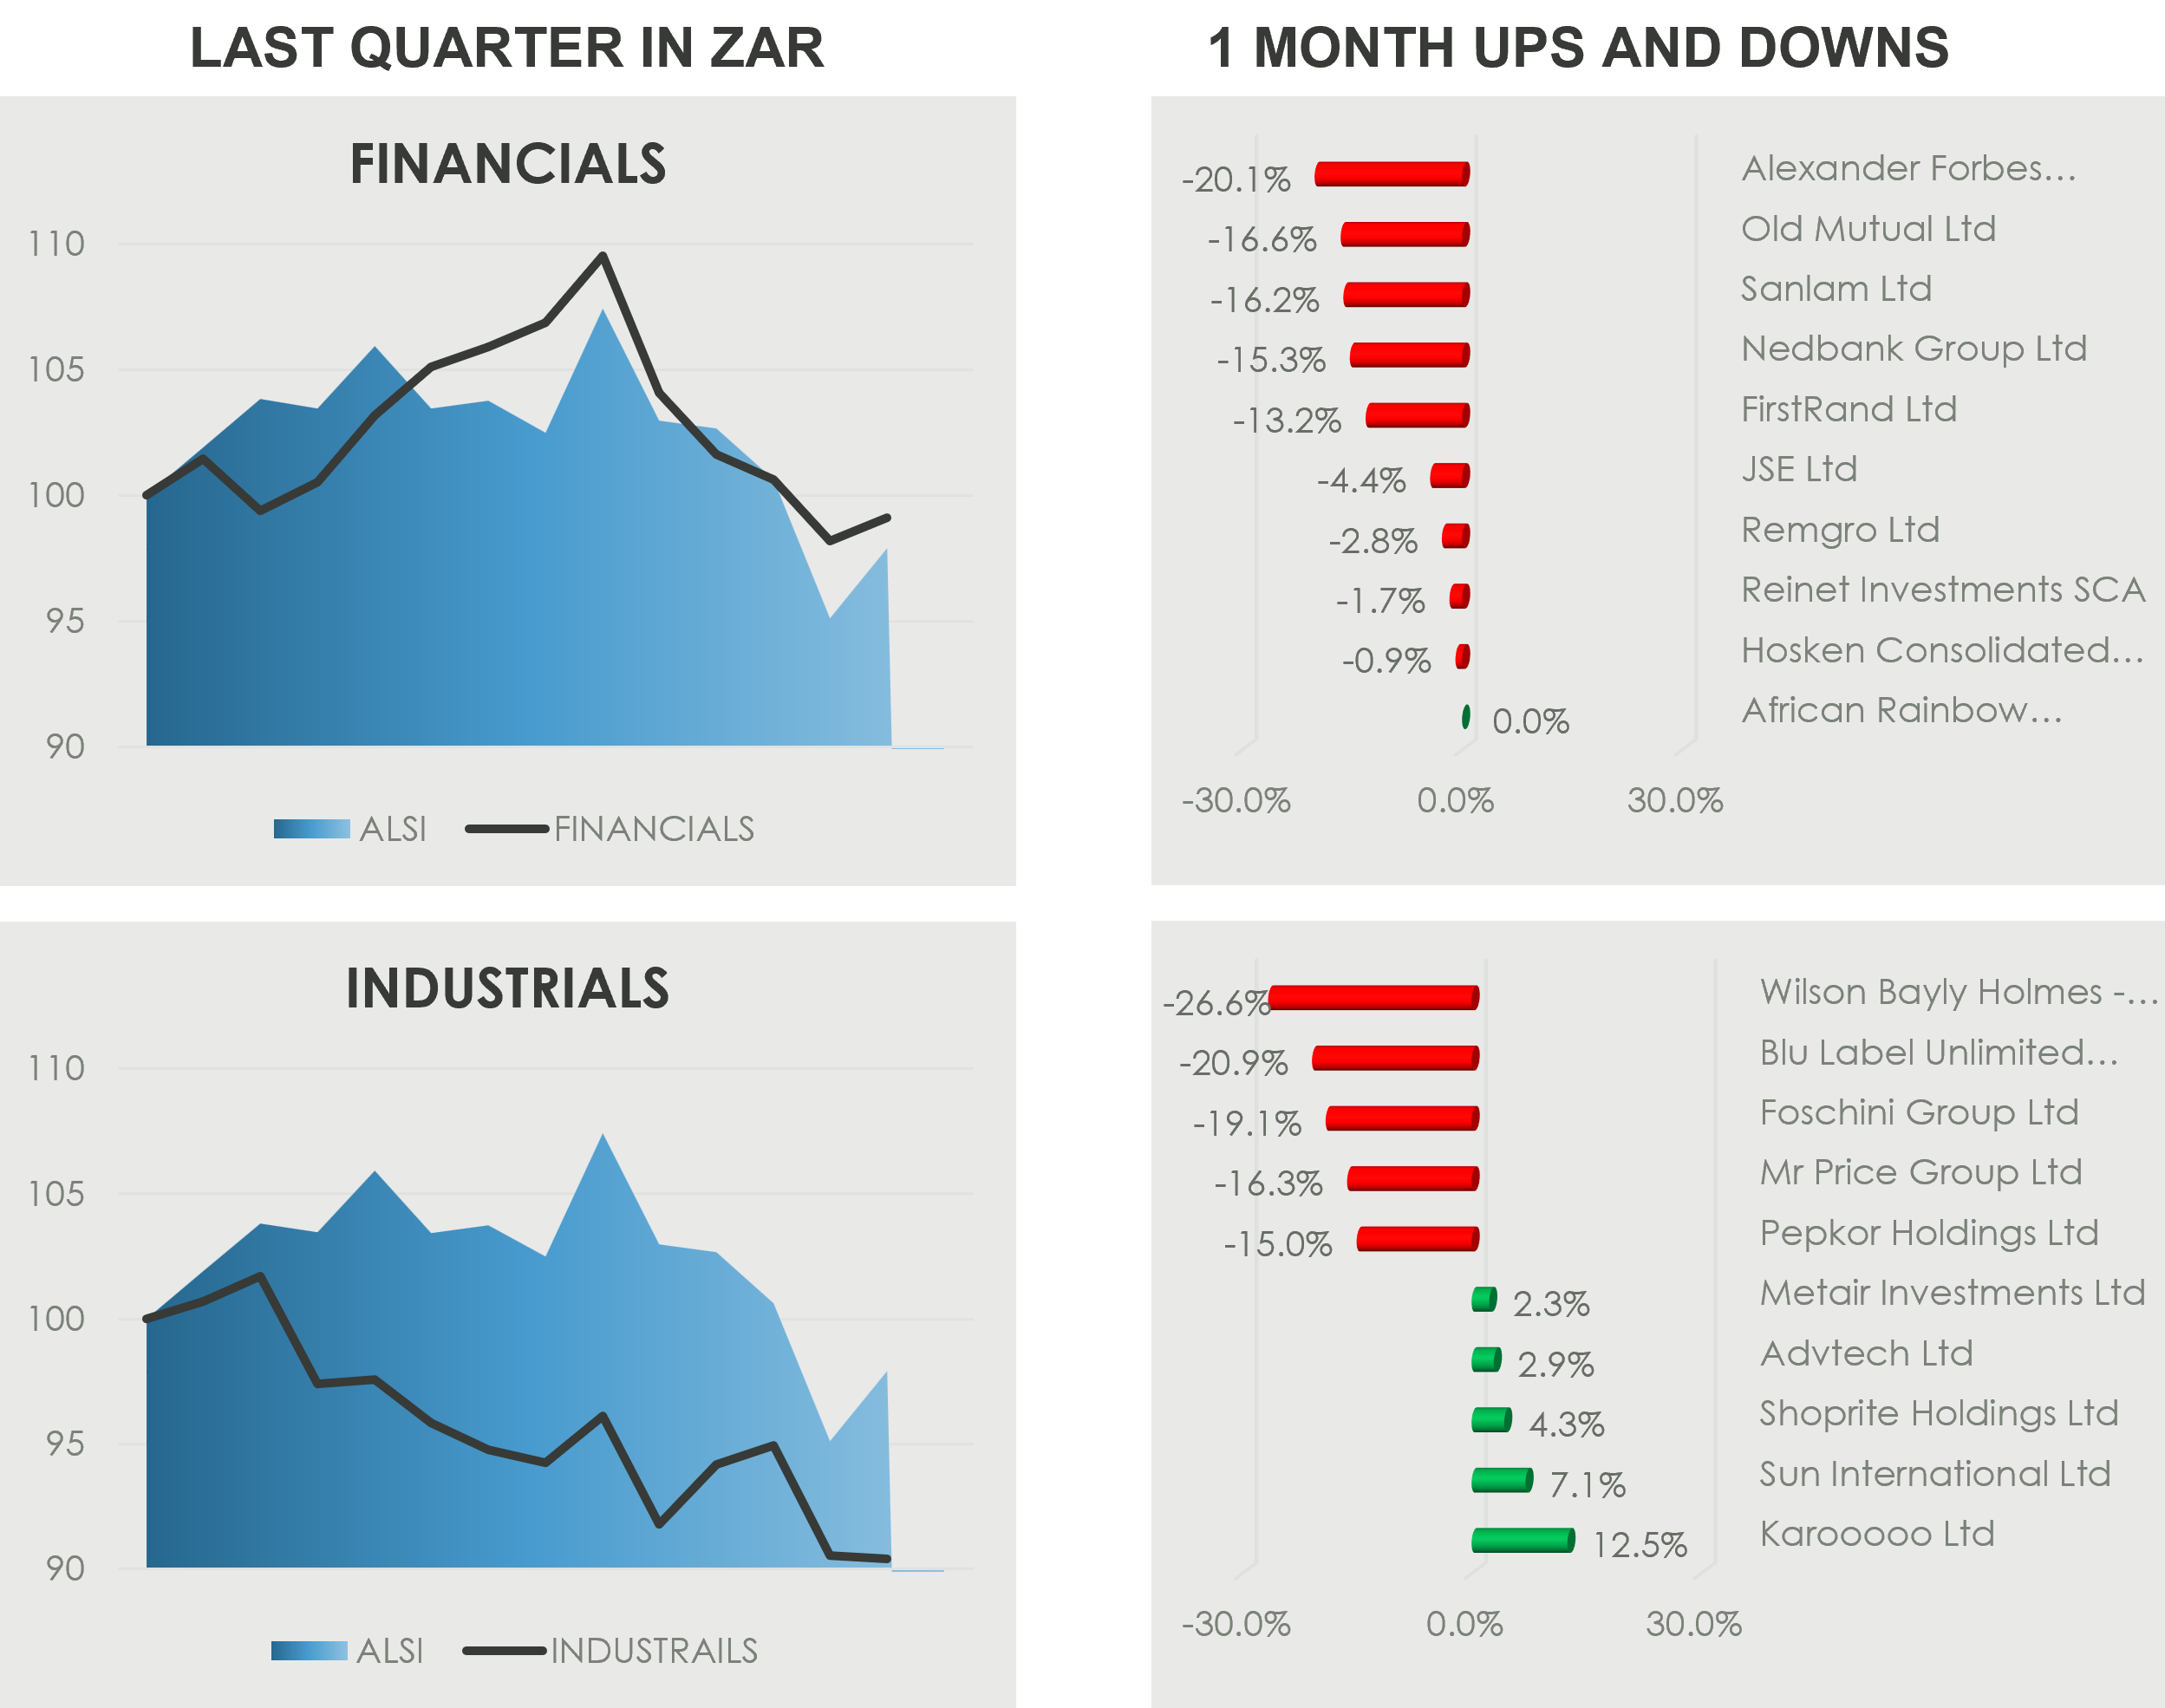
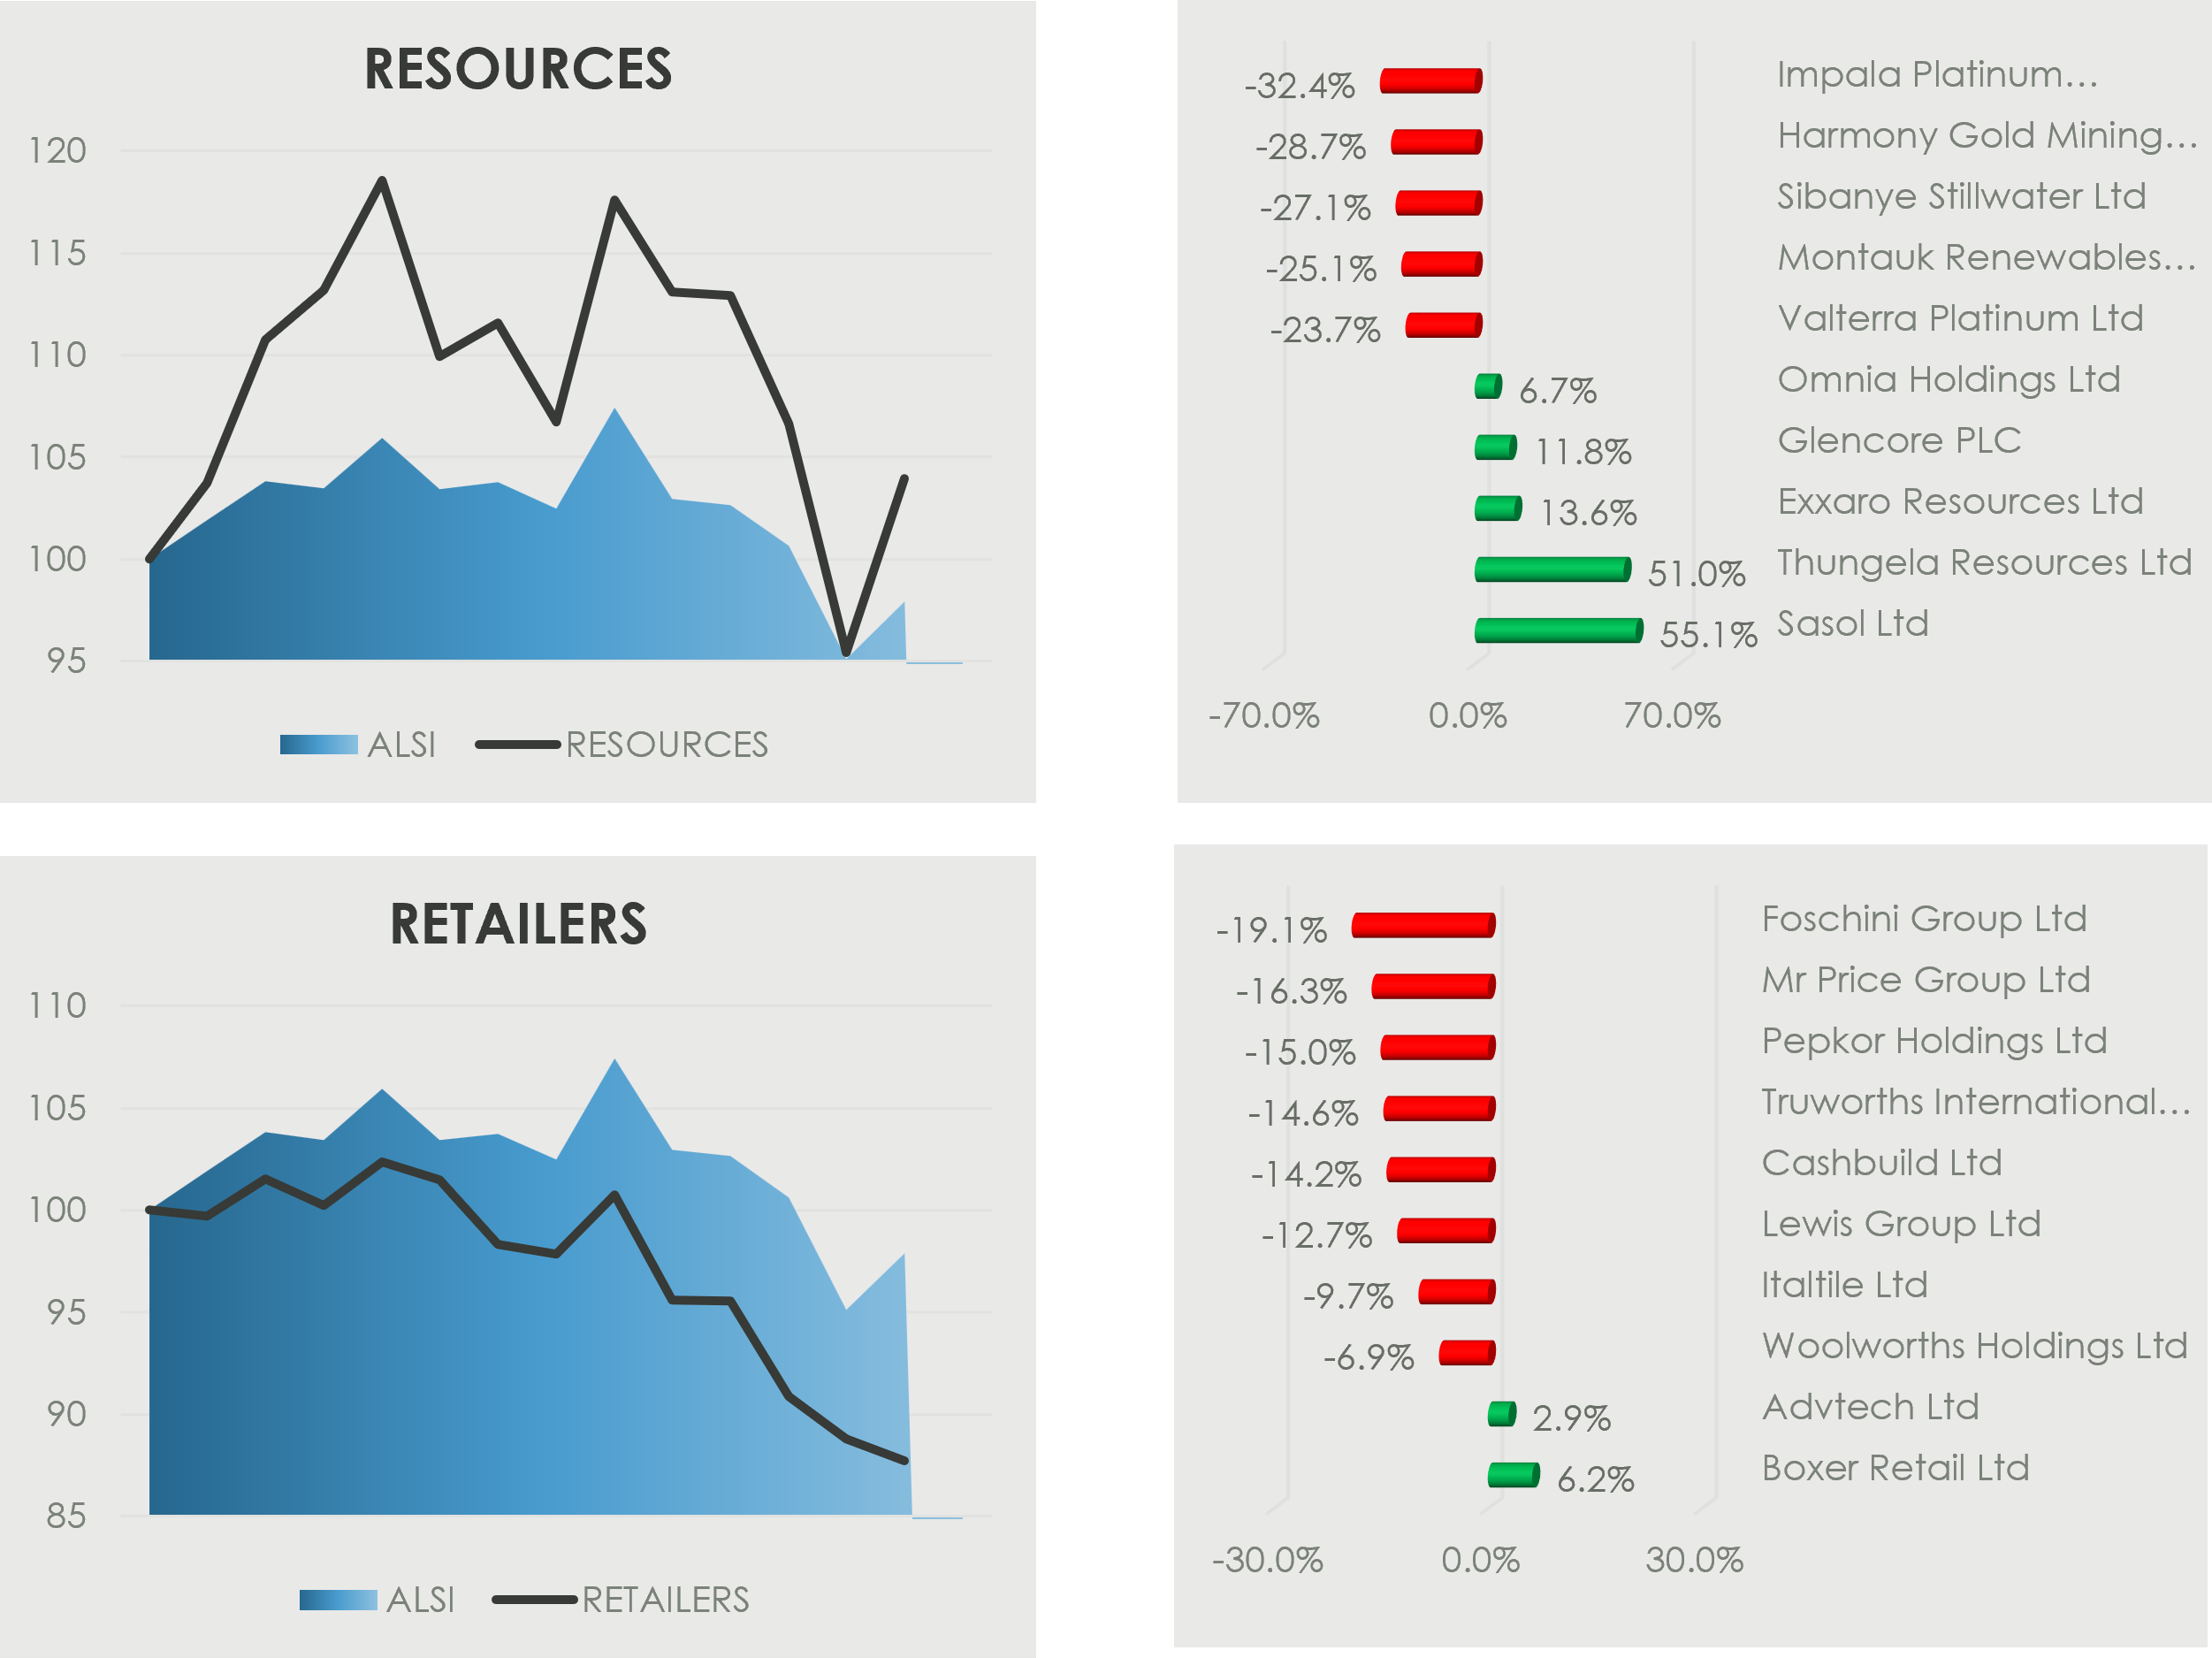
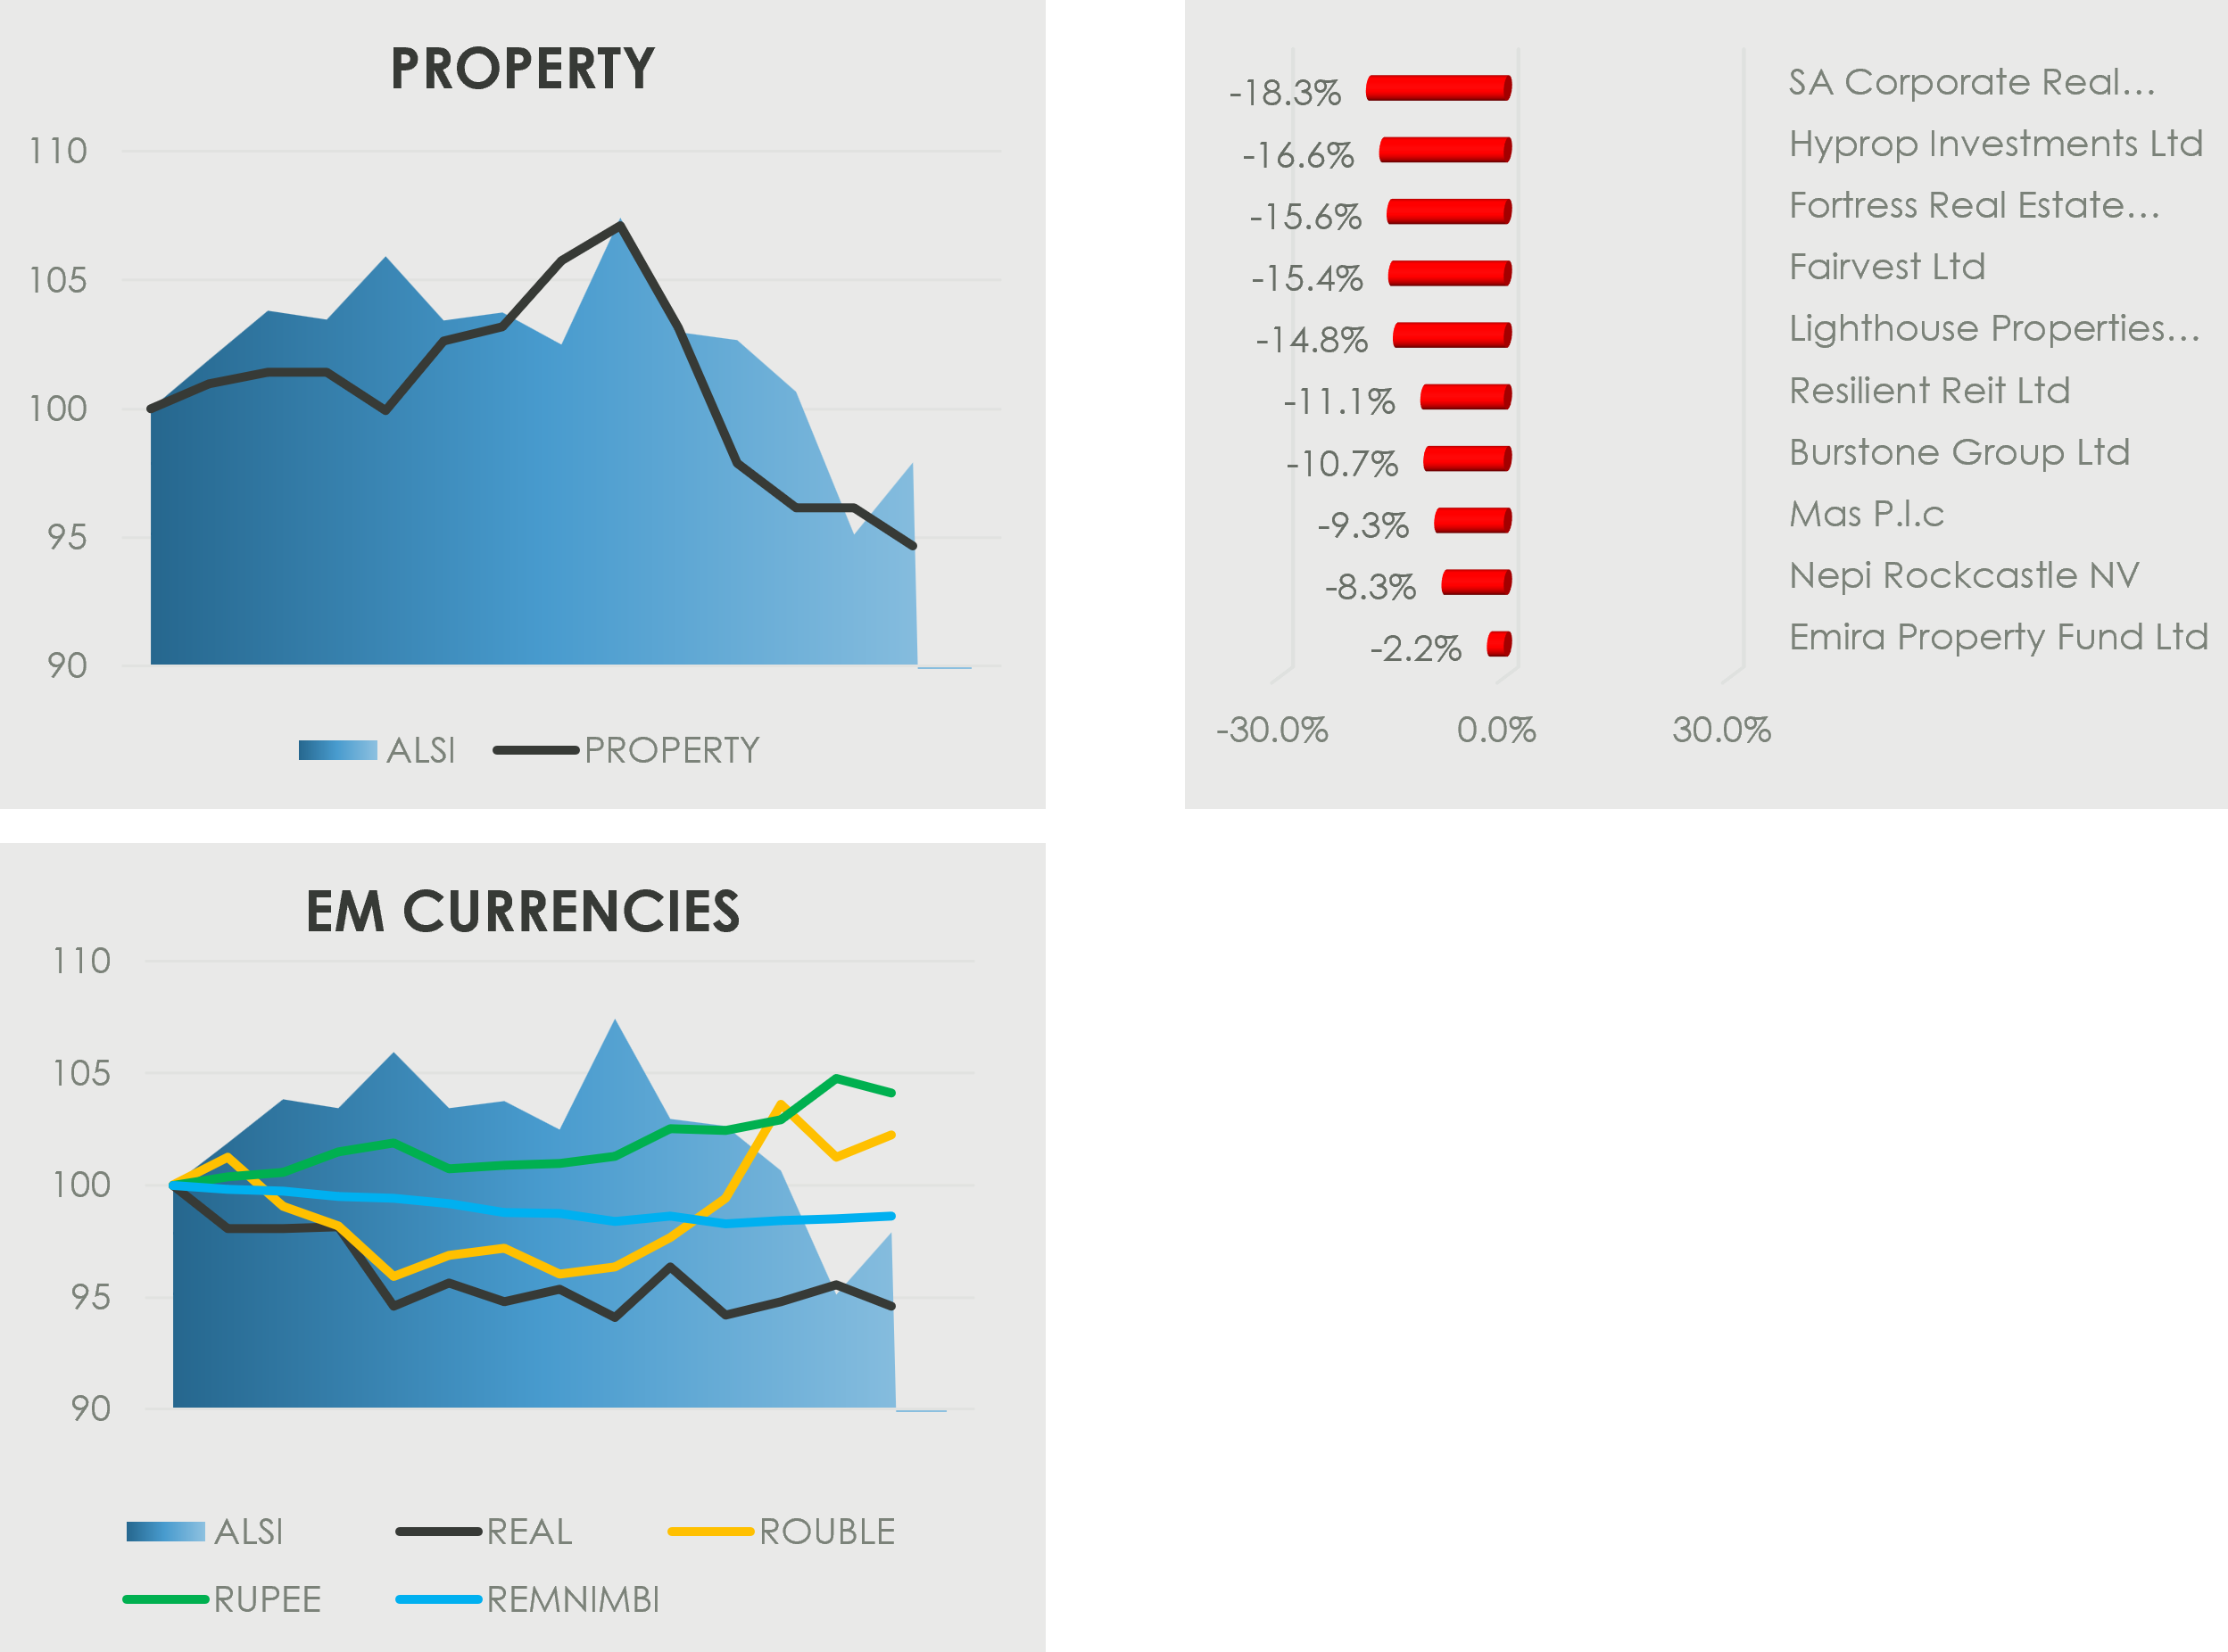
South African equities followed global peers lower, with the ALSI delivering one of its weakest monthly performances, declining 11.2% in March (+1.5% YTD). The sell-off was broad-based, with all sectors ending in negative territory. Resources led the declines (–17.8%), followed by Property (–11.8%), Financials (–10.3%), and Industrials (–5.4%).
Within Resources, performance was mixed. Energy and coal names provided pockets of strength,supported by higher commodity prices. Sasol surged 55.1% on the back of rising oil prices, while Thungela
Resources (+51.0%) and Exxaro Resources (+13.6%) benefitted from firmer coal prices. Glencore (+11.8%) also gained amid higher coal prices and renewed merger speculation.
In contrast, precious metals stocks came under pressure, with declines across PGMs and gold counters. Implats (–32.4%), Sibanye (–27.1%) and Valterra (-23.7%) led losses, while gold majors including Harmony Gold (–28.7%) also weakened as bullion prices softened.
Property stocks were broadly weaker, reflecting higher-for-longer interest rate expectations. SA Corporate (–18.3%) led the declines, alongside Hyprop (–16.6%), Fortress (–15.6%), Fairvest (-15.4%) and Lighthouse (–14.8%).
Financials also came under pressure in the broader risk-off environment. Alexander Forbes (–20.1%) was theweakest performer, with Old Mutual (–16.6%) and Sanlam (–16.2%) also declining. Banks softened despite solid results, with Nedbank and FirstRand down 15.3% and 13.2%, respectively.
Industrials delivered mixed performance. Karooooo (+12.5%) gained on strong subscriber growth, while Sun International (+7.1%) benefited from improved gaming revenues and a special dividend. Food retailers were resilient, with Shoprite up 4.3% for the month, after delivery solid 1H26 results that indicate continued dominance in the market. Boxer was up 6.3% as the company also reported continued market share gains in its 48-week trading update. However, other consumer-facing and construction names lagged. Foschini (–19.1%) remained under pressure after guiding for a 20%+ decline in earnings amid weak trading conditions across the UK and Australia, while Mr Price (–16.3%) and Pepkor (–15.0%) also declined. WBHO (–26.6%) was the standout laggard after reporting flat earnings amid weaker building activity.
2026 Outlook Revisited
Central to our local outlook for 2026 was a continuation of falling inflation in the South African economy, which would see the central bank continue its cutting cycle through the year. This, along with further improvements in South Africa’s macro fundamentals, was poised to support an acceleration in GDP growth closer to the 2% level and improving consumer and business confidence. We therefore expected South African equities to achieve double-digit earnings growth and a valuation rerating.
South African macro-economic data from immediately before war broke out remained on a positive trajectory. Business and consumer confidence saw further upticks which were corroborated by multi-year strength in vehicle sales and further gains in credit extension. In February, we saw inflation continue to fall, coming in at the new long-term target of 3%, while retail sales grew at a faster pace than anticipated.
Iran Conflict: Revision of Expectations
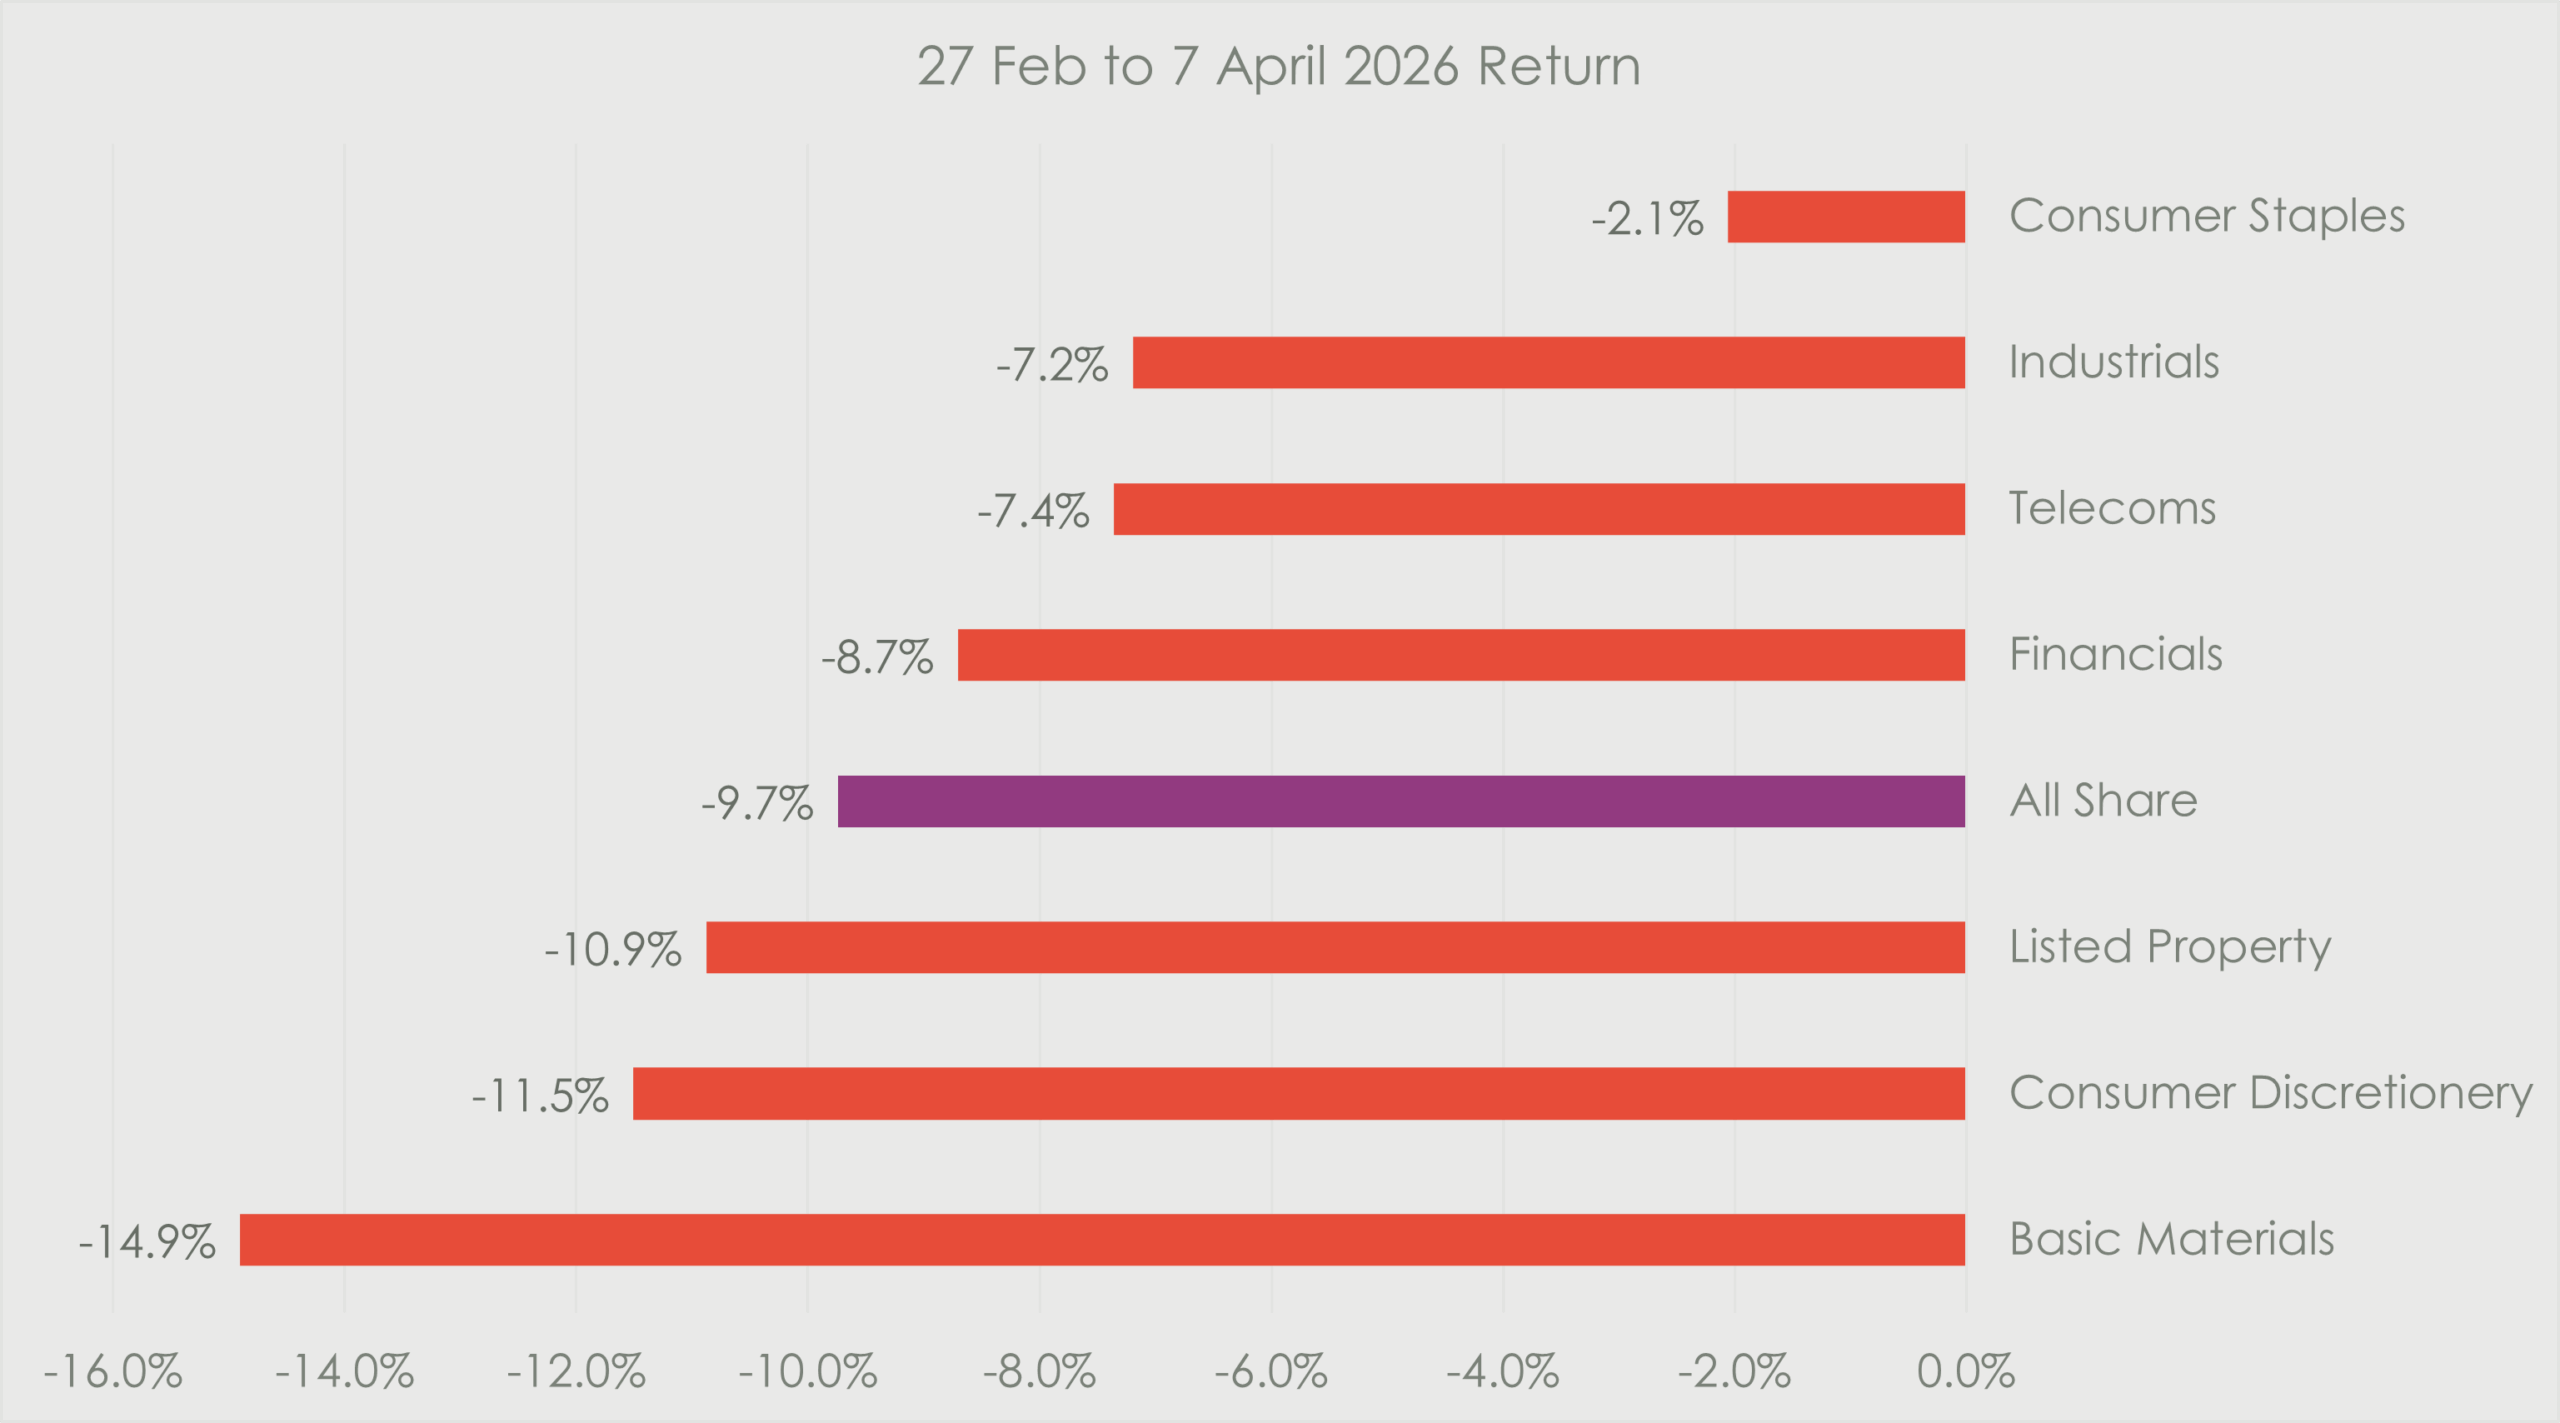
Since the Iran conflict began, we have seen our expectations derailed, with global markets adopting a risk-off posture. Oil prices accelerated as much as 39% in USD, with the situation further exacerbated by the rand weakening by over 5% against the dollar. South African 10-year bond yields have jumped from below 8% to just over 9%, during the period. Additionally, precious metals saw a sharp reversal in fortunes, with gold down nearly 10% and platinum registering a -17% return.
The basic materials sector has borne the brunt of the selling, as investors took the opportunity to book profits from 2025’s historic run. As a result of its outsized exposure to the sector, the JSE has underperformed the rest of emerging markets, since the beginning of the war.
Impacts on the Real Economy
The primary transmission channel for this geopolitical shock in the South African economy has been an increase in petrol and diesel prices, which rose by 16% and 41% respectively at the start of April. Additionally, illuminating paraffin, used for heating and cooking by a large portion of South Africans saw increases of 130%. The impact of these increases is expected to flow through into higher inflation, while also adversely affecting consumer spending and industrial output.
While the market has reacted to the first-order impact of higher oil prices on the global economy, it is our sense that there are second-order impacts that will continue to be a drag on the global economy even in the event of a relatively swift resolution to the war.
The Gulf region accounts for 20%-30% of oil and natural gas flows into the global economy, as well as significant fertilizer and aluminium supply. Damage to critical infrastructure in the region ensures that supply will remain constrained and prices elevated for an extended period. In our view, therefore, the impact on
the South African economy will extend beyond any successful de-escalation of conflict.
The Reserve bank, at their March meeting, responded by holding interest rates steady. Furthermore, they increased their expectations for inflation in 2026 to 3.7%, from 3.3%. The market is now pricing in a significant chance of rate hikes this year, relative to the expectation of a continuation of the cutting cycle, prior to war breaking out. This is expected to translate into downward revisions of GDP and earnings growth.
Valuations and Positioning
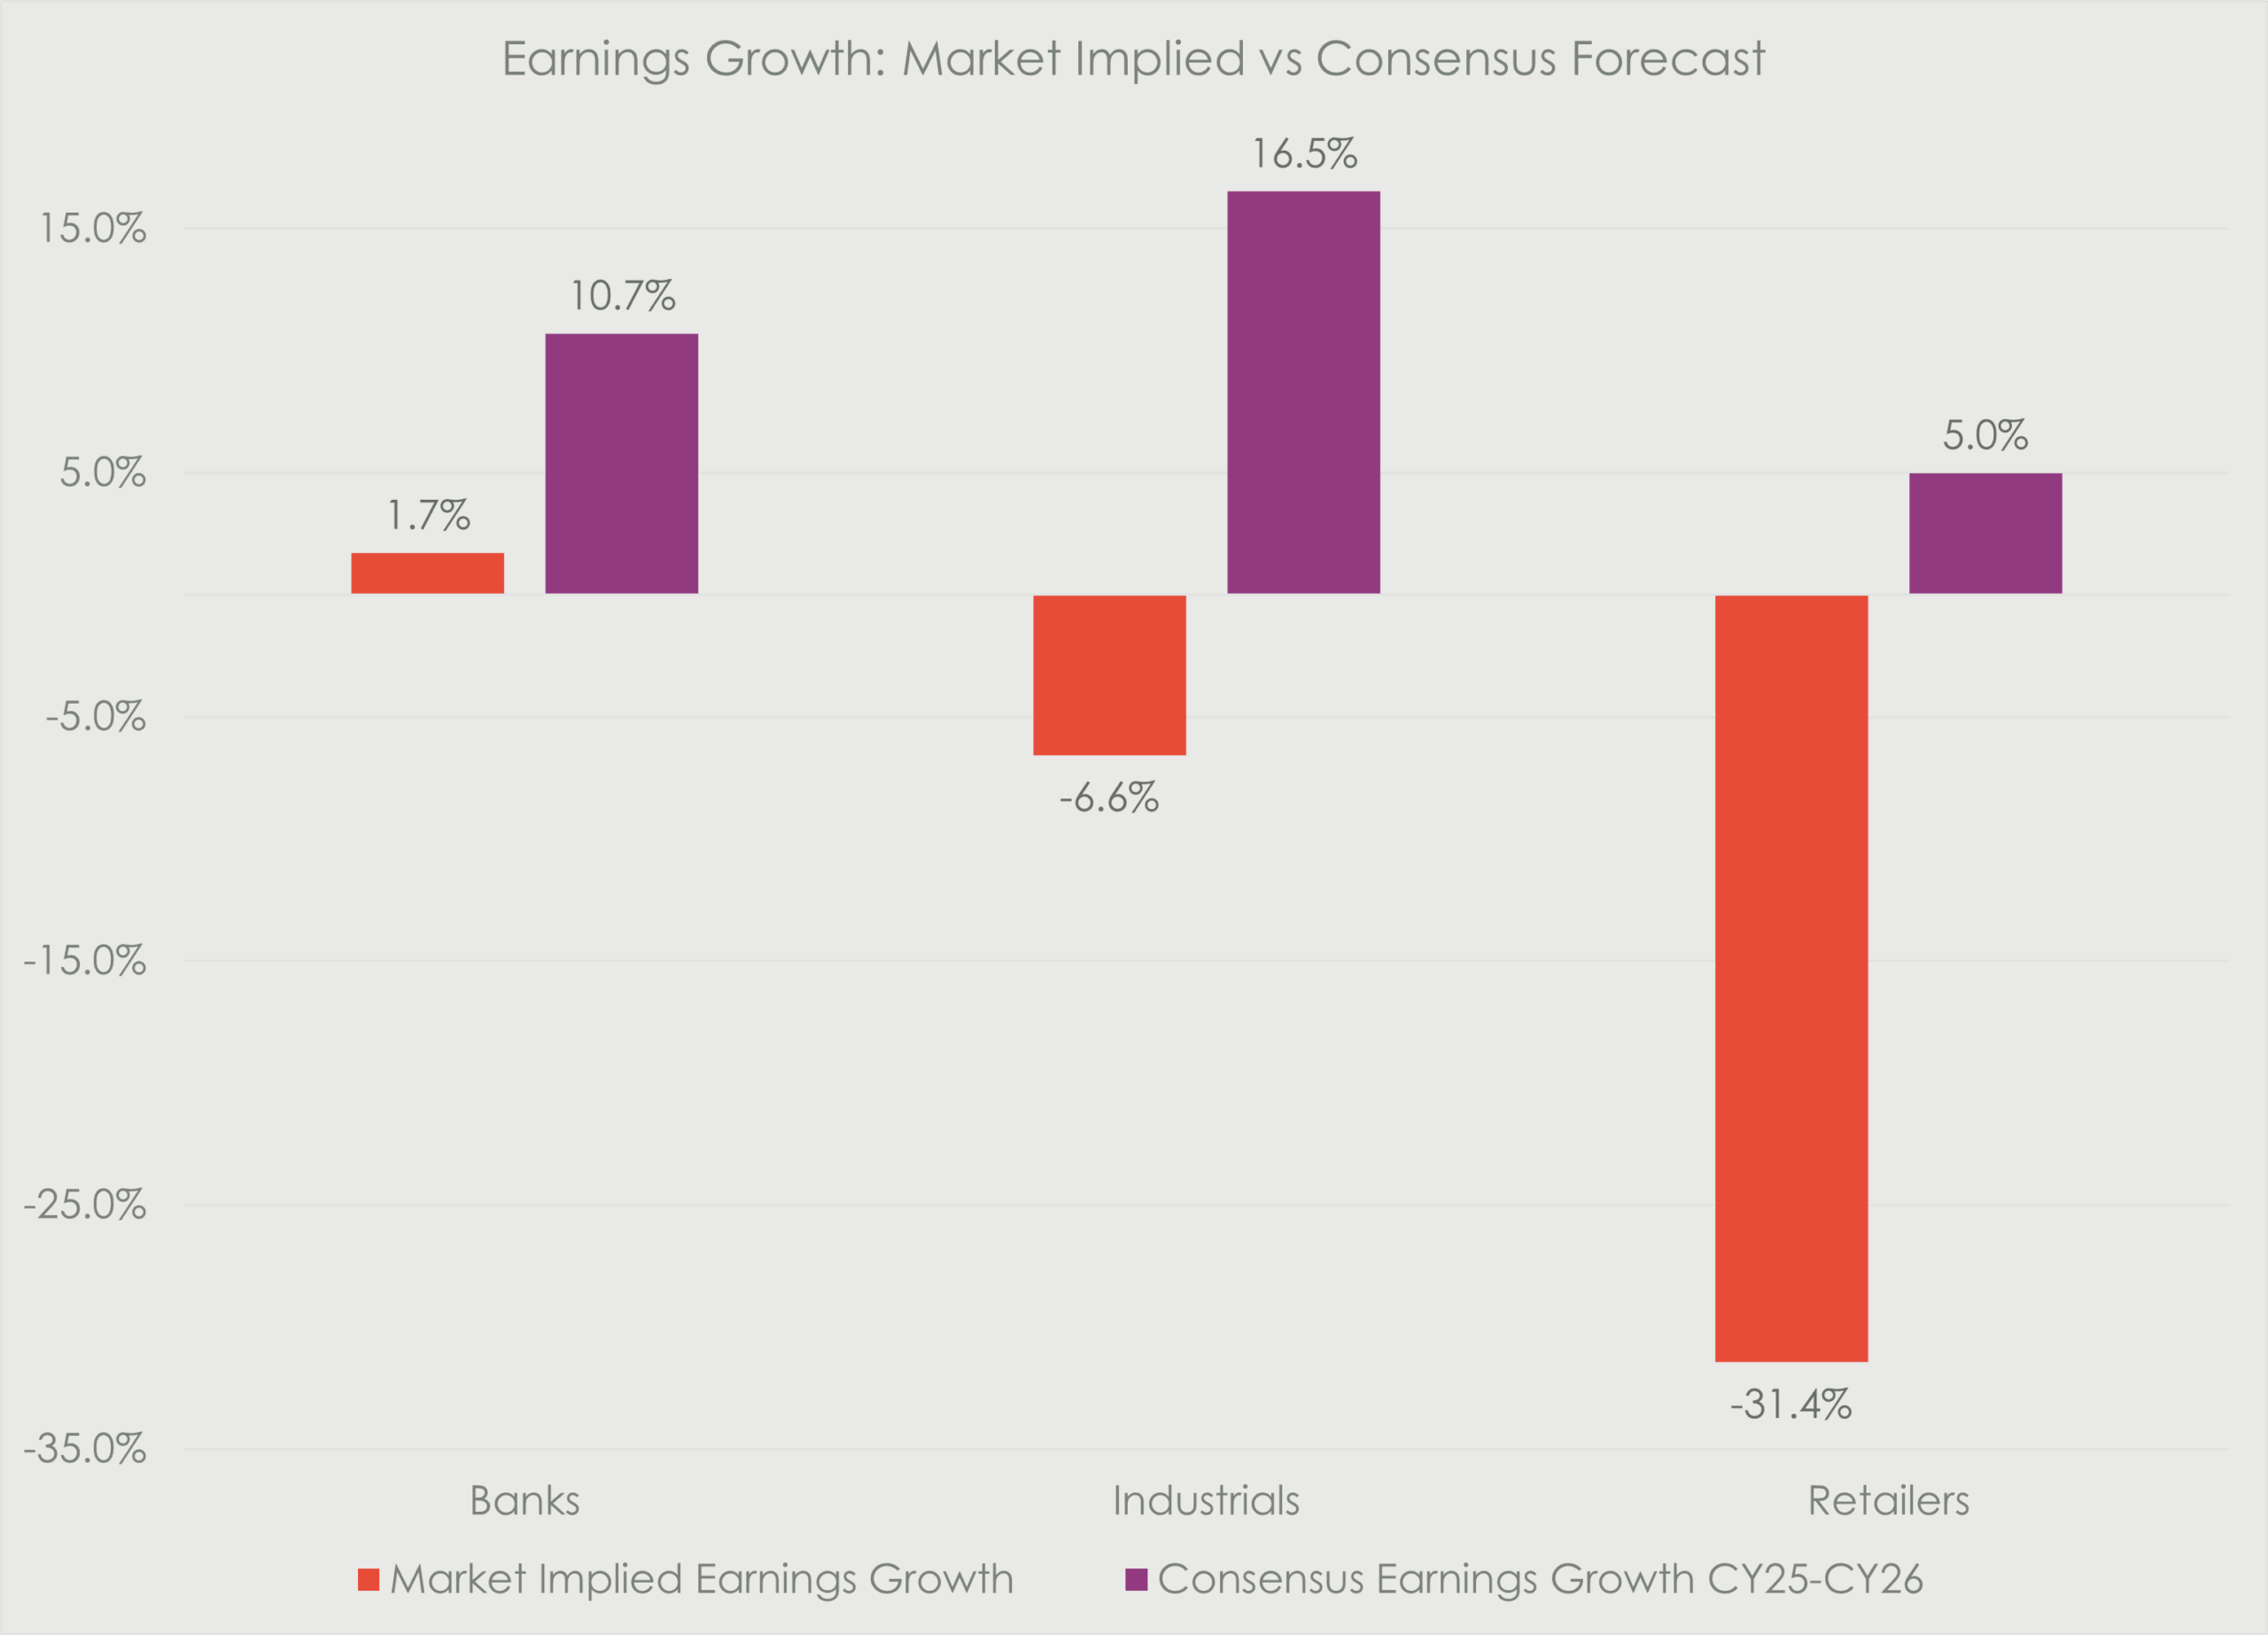
Valuations remain at attractive levels, with market pricing suggesting extreme pessimism relative toearnings expectations. Earnings revisions on South African facing stocks have been muted over this period, with the negative returns driven by a derating of multiples. This is a continuation of what we saw at the beginning of the year and presents us with opportunities to deploy capital into quality stocks with high margin of safety on long-term returns.
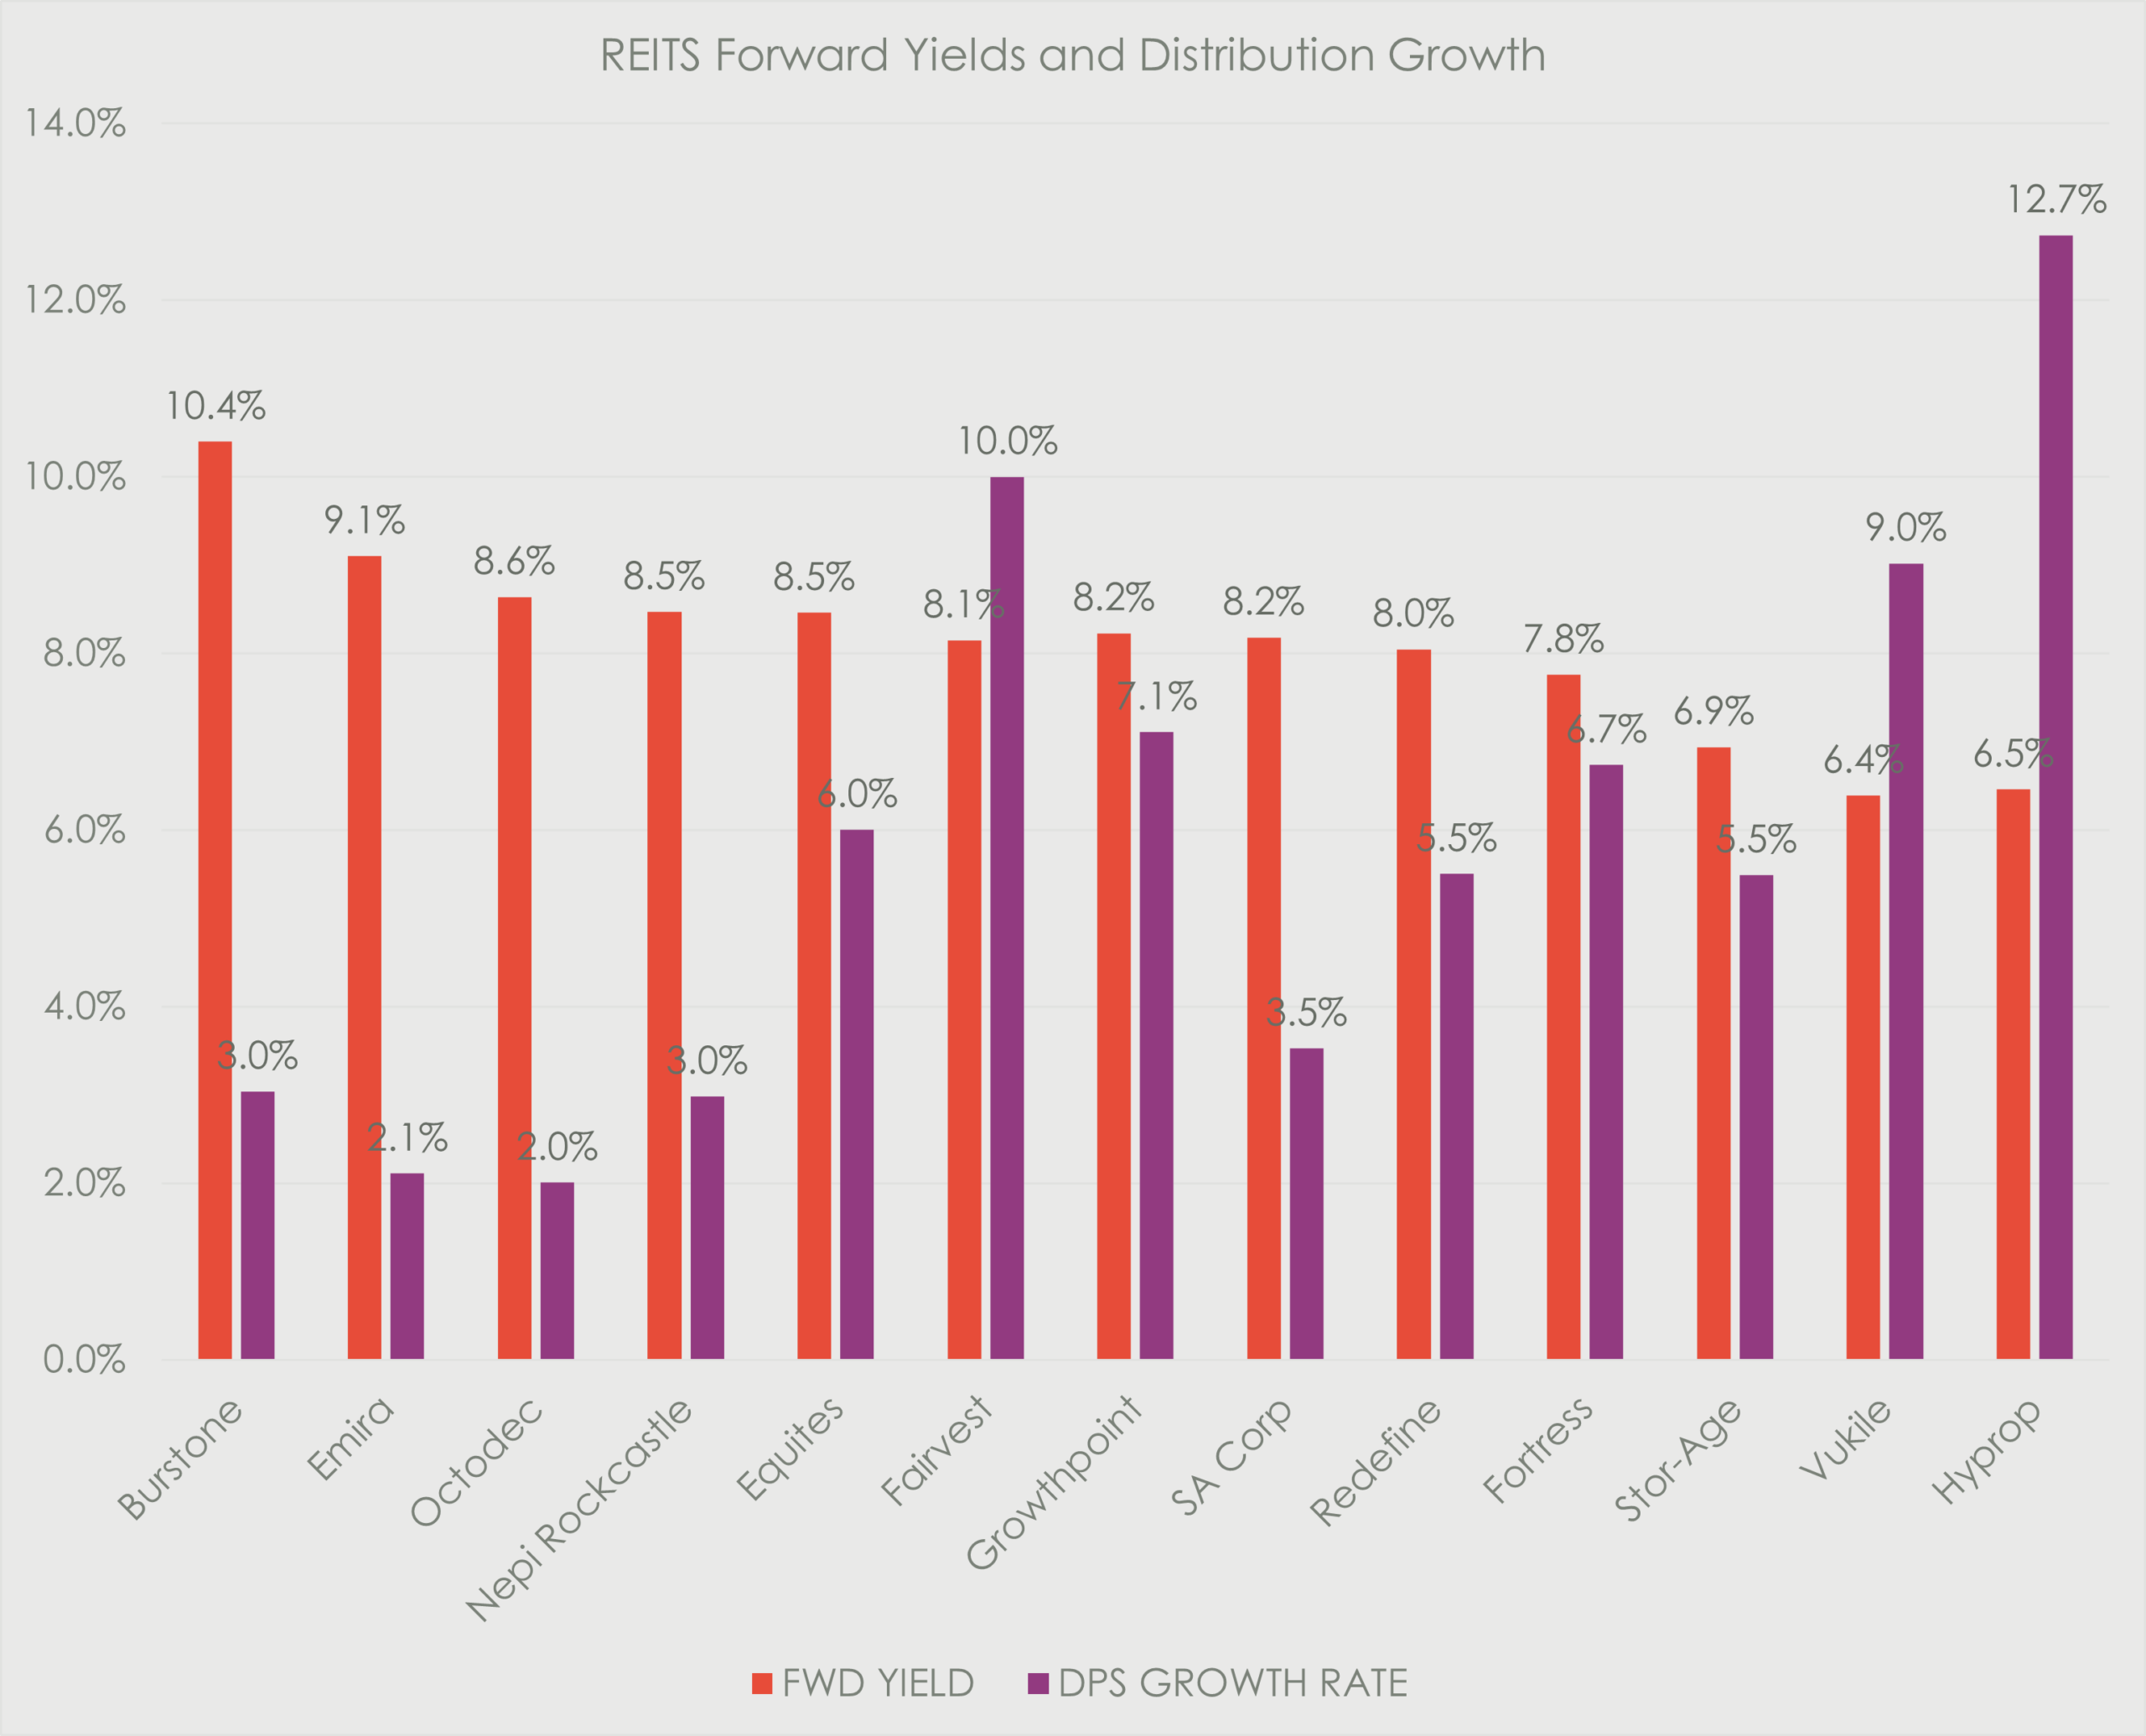
The REIT sector has derated along with the increase in government bond yields. Fundamentals in the sector remain sturdy, on account of the contractual nature of cash flows and finance cost upside on a twelvemonth view. Against a ten-year bond yield of 9%, valuations in the sector offer a compelling entry point, with upside to investment theses likely for investors with long-term horizons.
In light of the above, we have taken the opportunity to further increase our exposure to SA Inc quality, while tactically harvesting profits to increase our cash position. Our exposure to SA bonds and nonexposure to precious metals miners has meant that we have been protected from the worst of the downside.
We believe the market will remain volatile in the short term and we will look to patiently deploy cash when opportunities become available at the right price. SA Inc equities entered this war with valuation support which has seen them relatively shielded from global volatility. We expect our focus on quality names to offer further defensive rigidity to our portfolios and a sound platform for outperformance when the market regains momentum.
Recent Portfolio Changes
Local Movements:
Flight to Quality Retail
Following the Capital Markets Day hosted by Mr. Price on 17 March – where management addressed the market on the NKD Group acquisition announced in December – we made the decision to exit our position. While management remains confident in the strategic rationale and the valuation appeared compelling (below 10x forward P/E at the time of exit), we believe the market is likely to adopt a “wait-and-see” approach in the near term, limiting the potential for a re-rating.
We redeployed the proceeds into Clicks Group as part of a broader shift toward higher-quality retail exposure. In addition to its defensive earnings profile, the valuation was attractive at the time of entry, with the share trading at circa 18x forward P/E versus a five-year average of circa 25x.
Sasol – Taking Profits
With Sasol having rallied 93% over the last 12 months – driven by the sharp increase in oil prices – we made a tactical decision to take some profits and increase cash exposure amid heightened market volatility. We view the rise in oil prices as temporary, and on a valuation basis, Sasol was trading at nearly a 4x EV/EBITDA multiple, above its five-year average of 3.4x. Given this significant re-rating, the situation presented an opportunity for disciplined profit-taking. We remain bullish on Sasol over the long term and will opportunistically add to the position during periods of weakness.
Offshore Movements:
Shell – Taking Profits
Similar to Sasol, we took advantage of the recent rally in the oil price – which we believe to betemporary – to take some profits in our Shell position. We still maintain a 5% holding in Shell.
Infineon – Rebalancing
We rebalanced our Infineon position back to model weighting of 6.5%, after a period of strong performance – while maintaining a positive long-term outlook on the company. This has increased our cash position to above 10%. This leaves us well positioned to take advantage of opportunities arising from the current market pullback, once conditions have stabilised and there is greater clarity on the evolving situation.
Standard Bank Group hosted its Capital Markets Day on 26 March 2026, outlining its strategy and financial targets through to 2028. This follows a strong FY25 performance, where the group delivered against its prior medium-term targets.
Management provided a clear and credible pathway to achieving its 2028 targets, which we view as attainable given its consistent execution track record and the fact that the group is already operating within parts of these target ranges.
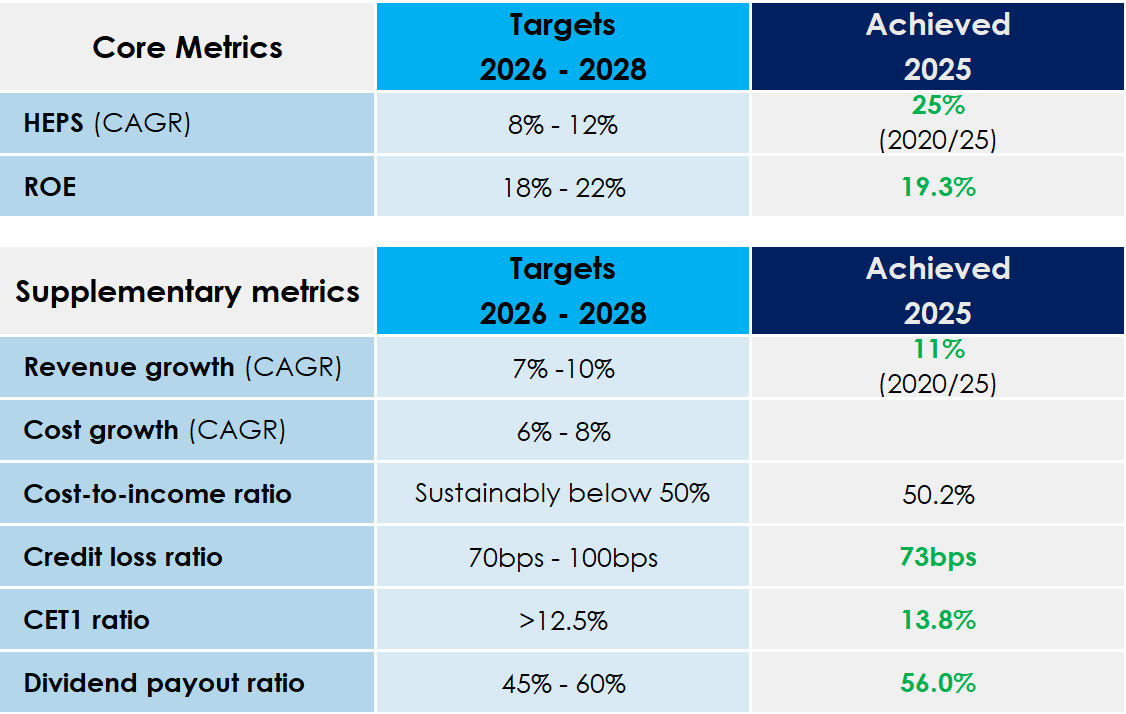
Growth is expected to be driven by continued expansion across the rest of Africa (with growth expected to outpace South Africa), sustained momentum in Corporate and Investment Banking through further scaling, and a meaningful recovery in Personal and Private Banking. Insurance and asset management are also expected to benefit from increased penetration and cross-selling across the franchise.
Overall, we remain constructive on the investment case and believe management is well-positioned todeliver on its medium-term objectives. Based on our estimates, we value the group at a target P/B of 1.9x (20% ROE and 14.5% cost of equity), implying a price target of R354 per share.
Pepkor’s 2026 Capital Markets Day (30–31 March) outlined a strategy centered on scaling financial services, unlocking fintech value, and driving more efficient growth across its core retail base. The update reinforced confidence in the group’s medium-term outlook, with strong execution and multiple growth levers supporting a constructive long-term view, despite near-term investment in the banking platform.
A key pillar is the launch of a low-cost bank, aimed at better serving Pepkor’s core customer rather than competing with traditional banks. Leveraging its 6,000+ store footprint and existing customer ecosystem, the group is well positioned to deliver financial services at scale. The migration of credit books into the bank should enable cheaper funding through deposits and support margin expansion, while enhancing crosssell opportunities.
Within financial services, the focus is on improving penetration and optimising the product suite. Credit is increasingly positioned as a sales enabler, with modest growth expected, while insurance, particularly funeral cover, presents a meaningful opportunity. The Capfin personal loan book will be wound down over time, with lending migrating into the bank.
The separation of the FLASH business highlights potential for future value unlock, although scaling,particularly in B2B and informal channels, remains key, with strategic decisions expected over the next 6– 12 months.
In core retail, expansion is expected to moderate, with a greater focus on improving trading density, optimising brands, and driving efficiencies. At a group level, margin expansion should be supported by financial services and fintech, although banking-related investment may weigh on near-term operating leverage. Management also signalled a more cautious approach to offshore M&A, emphasising disciplined capital allocation.
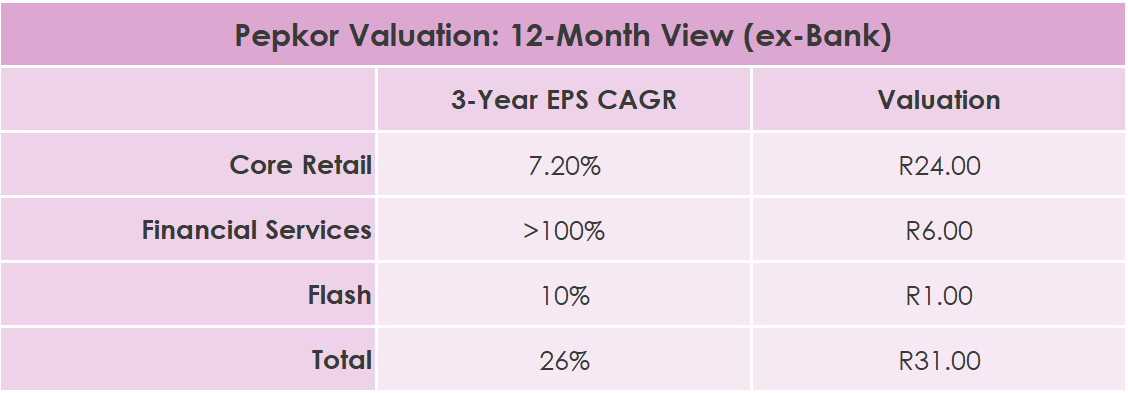
The share has valuation support at R24, which is what we think the core retail business is worth, on a 12- month view. We think the financial services and informal market businesses are currently not assigned any value by the market, despite being the growth engines of this emerging consumer platform story.