

In our outlook for 2026 at the onset of the year, we painted an investment landscape that was supportive of a third consecutive year of solid double-digit returns for global equity markets. We saw a macroeconomic backdrop that supported an early-stage economic cycle; benign credit spreads, easy monetary policy, fiscal stimulus, and strong household dynamics.
We entered 2026 with S&P 500 valuations at 22x – while above average valuation – was justified given increasing profit margins and strong earnings growth. Alongside the supportive macroeconomic environment, we viewed the risks of valuation contraction as low. Ultimately, we forecasted an environment where earnings growth (15.4%) was enough to deliver mid-teen percentage returns for equity markets in 2026.
However, the global economic outlook pivoted in February as the U.S. attacked Iran, who subsequently blocked the Strait of Hormuz, impacting 20mbpd of oil supply and sending crude prices above $100/bbl. While a 60-day truce was called on the 18th of June, resulting in the opening of the Straits and the pullback in the price of oil, concerns continue to linger around more permanent economic damage being caused by 101 days of energy supply disruption.
We have seen the economic landscape shift on various fronts due to the conflict:
-
-
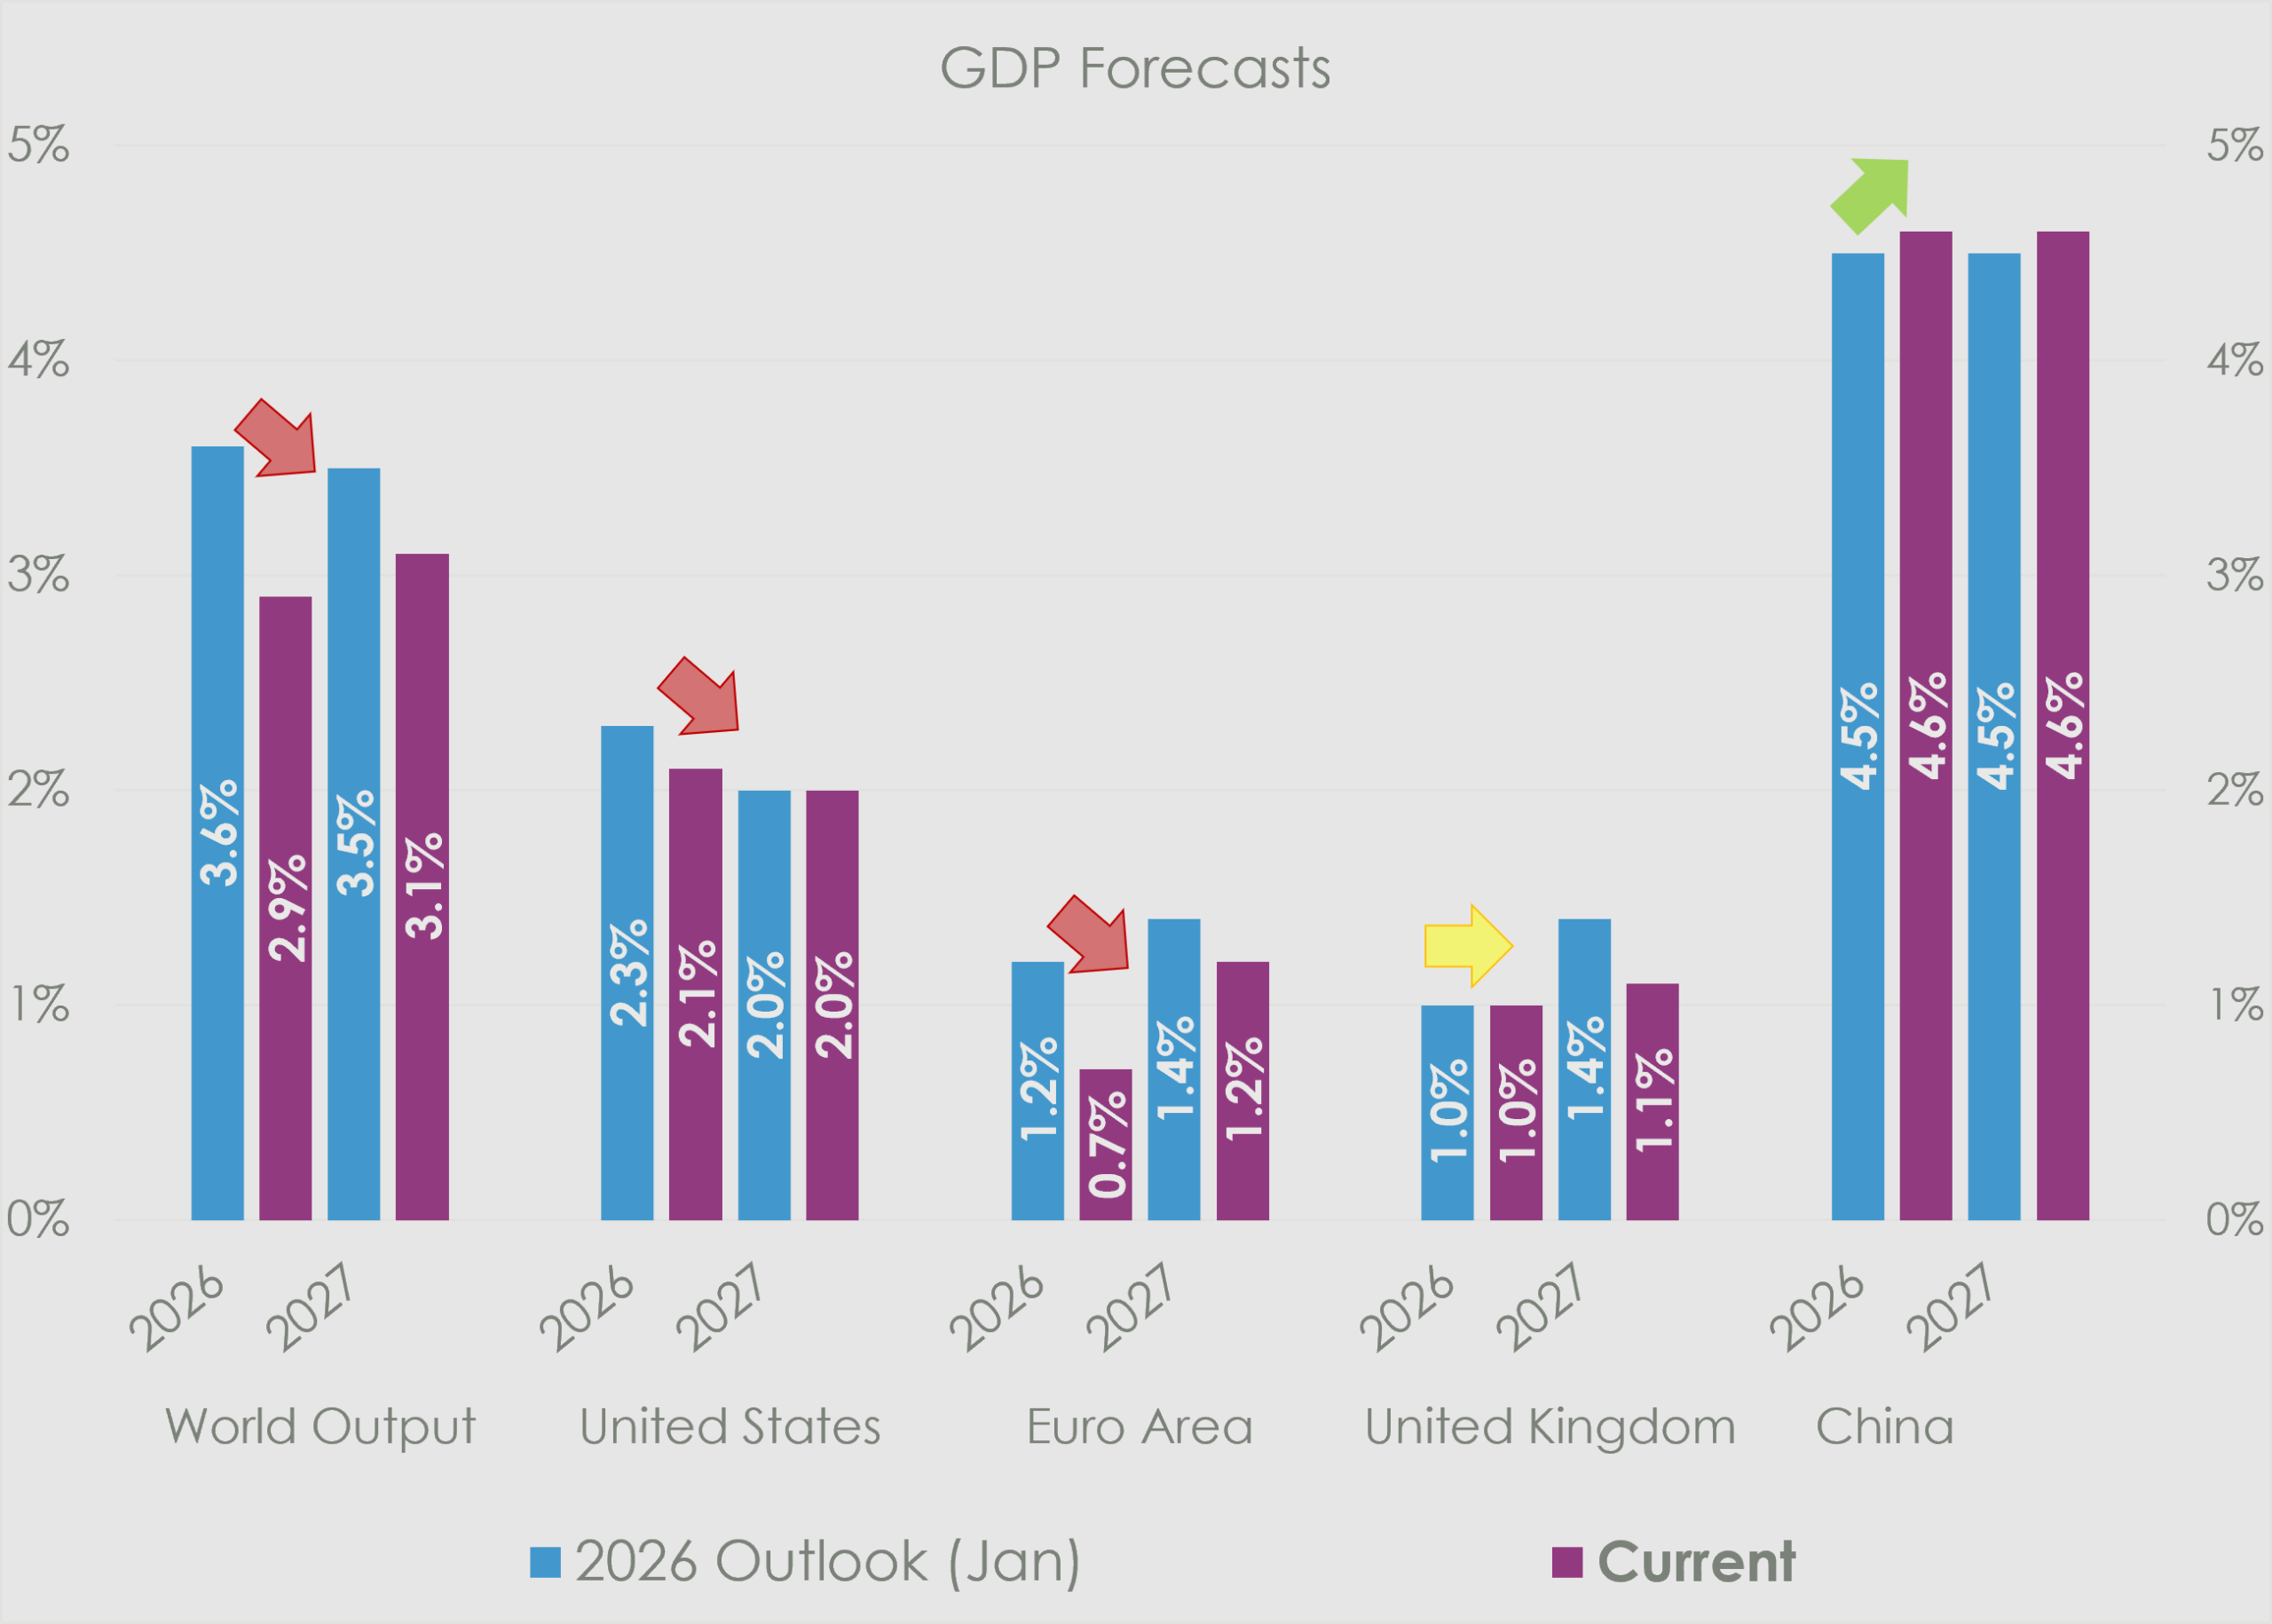
- GDP growth forecasts have been reduced
-
-
-
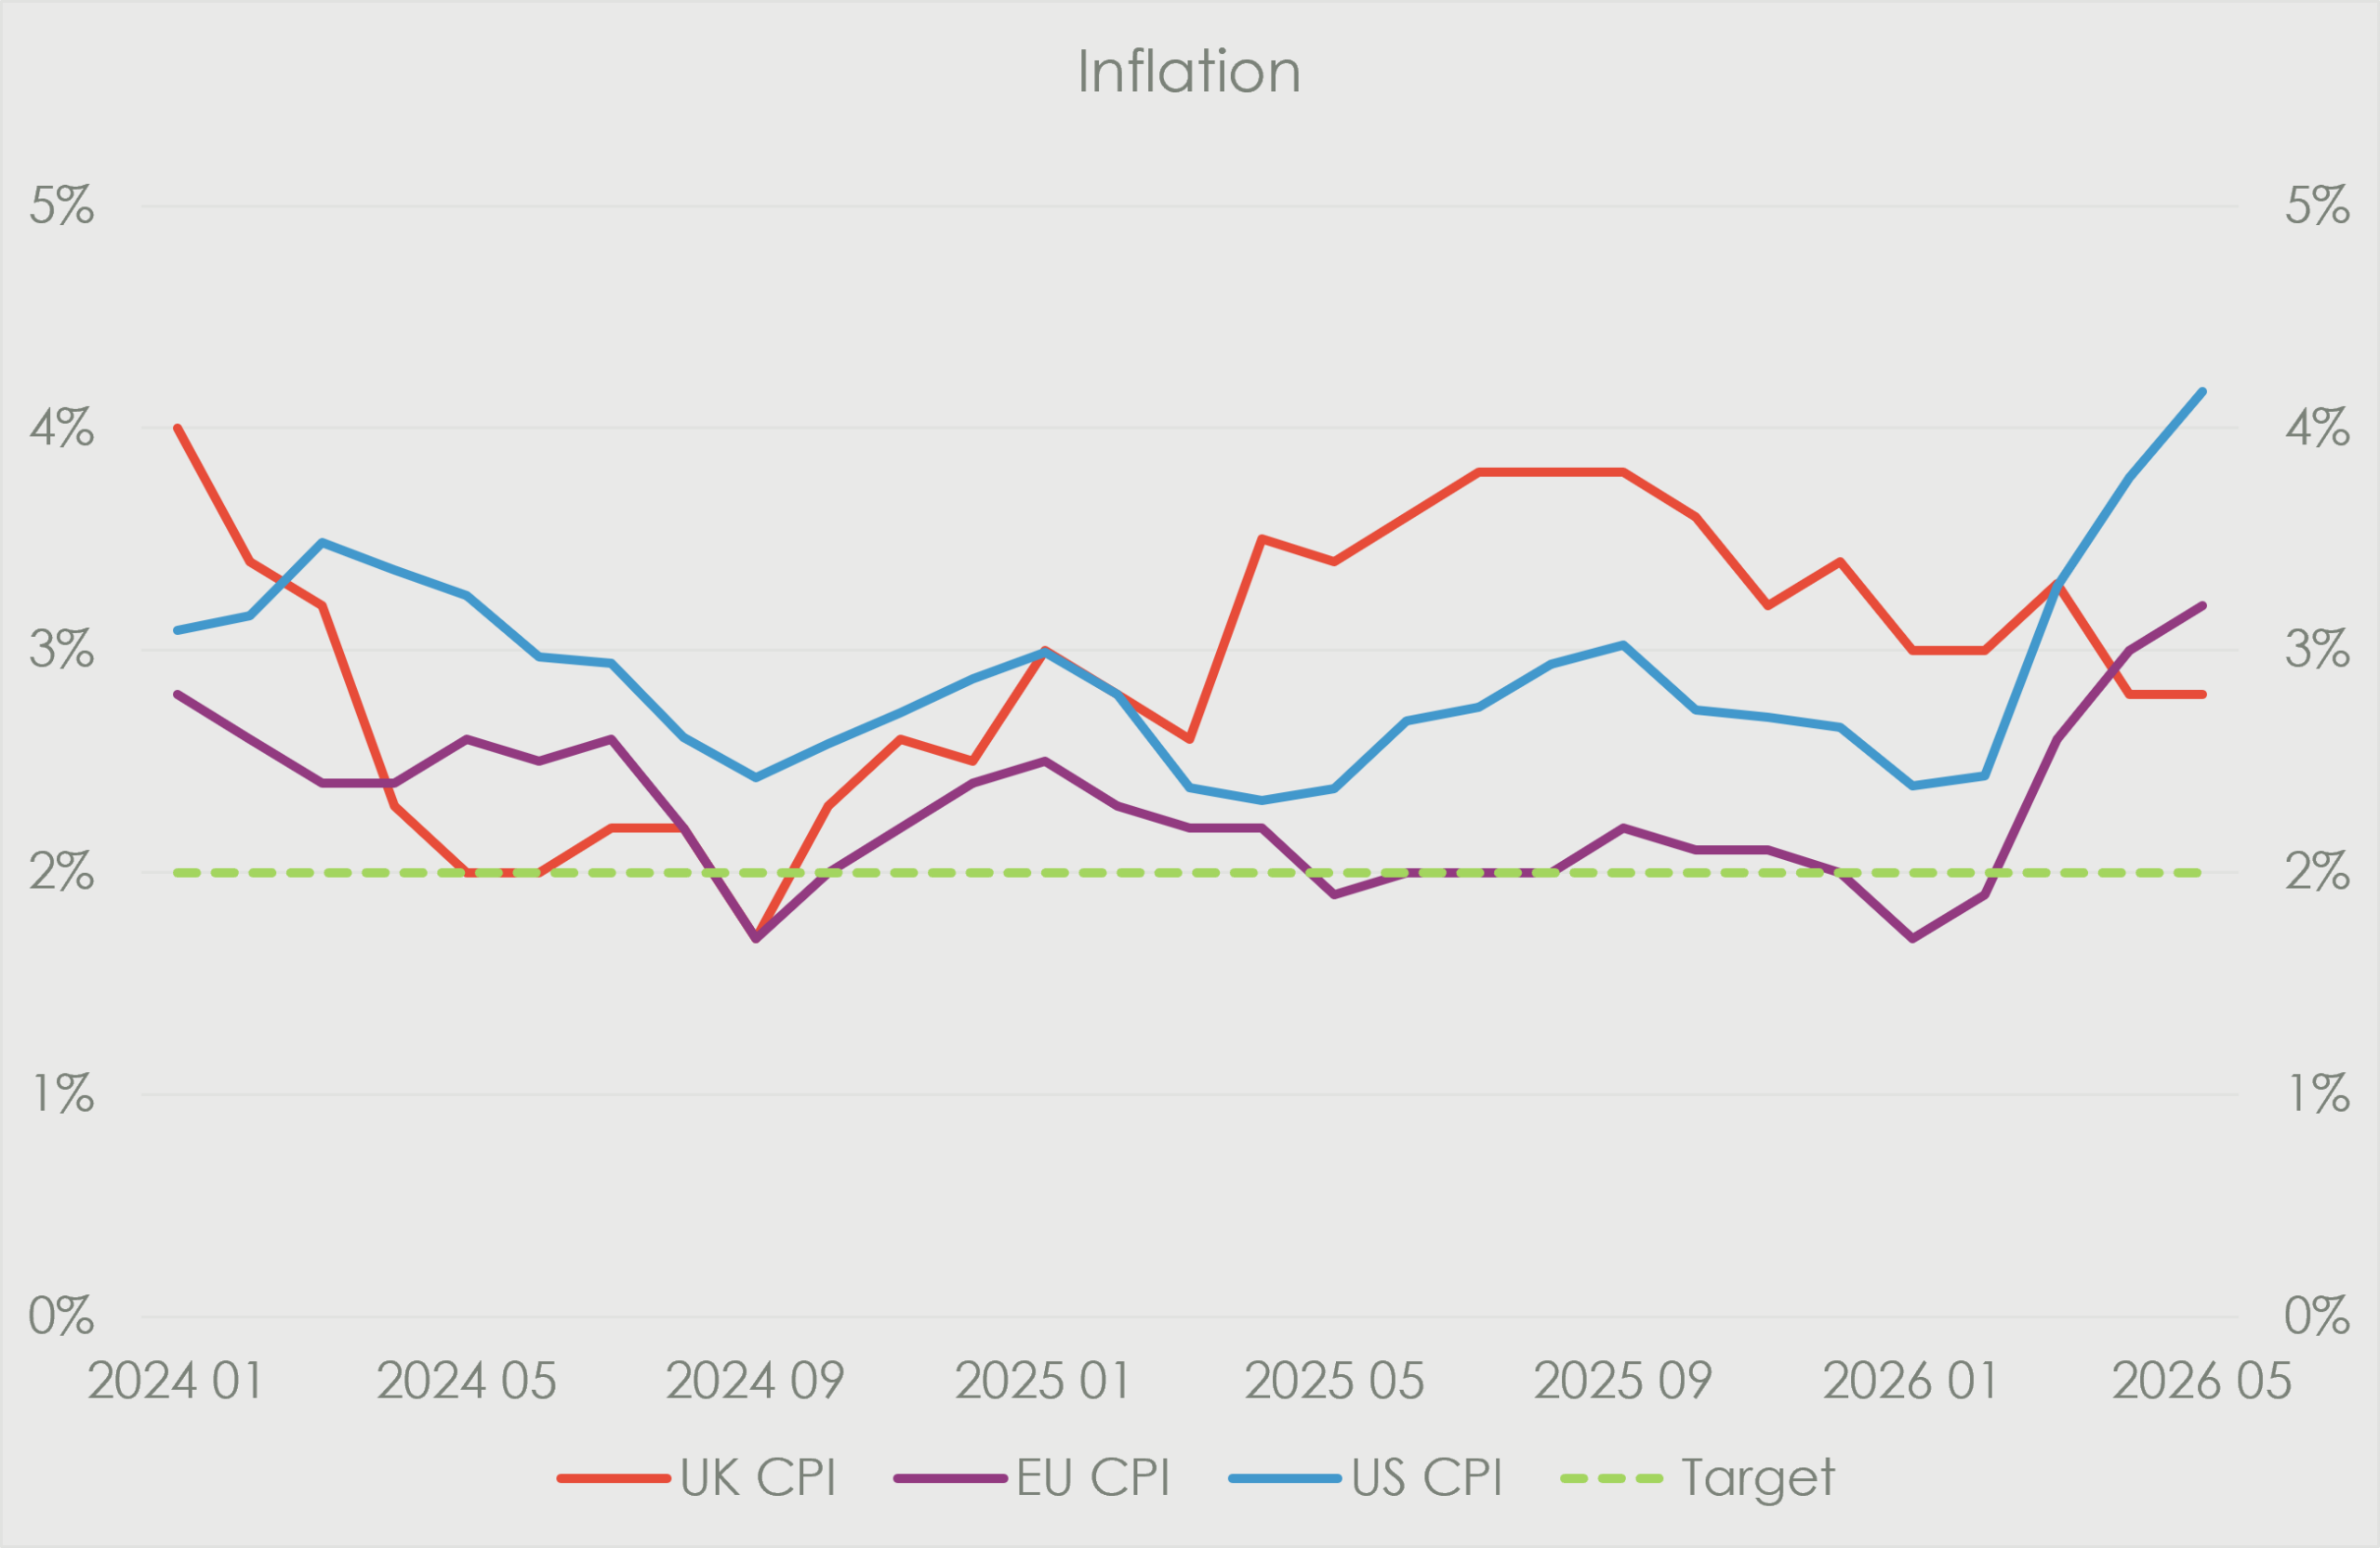
- Higher fuel prices have begun to impact inflation
-
-
-
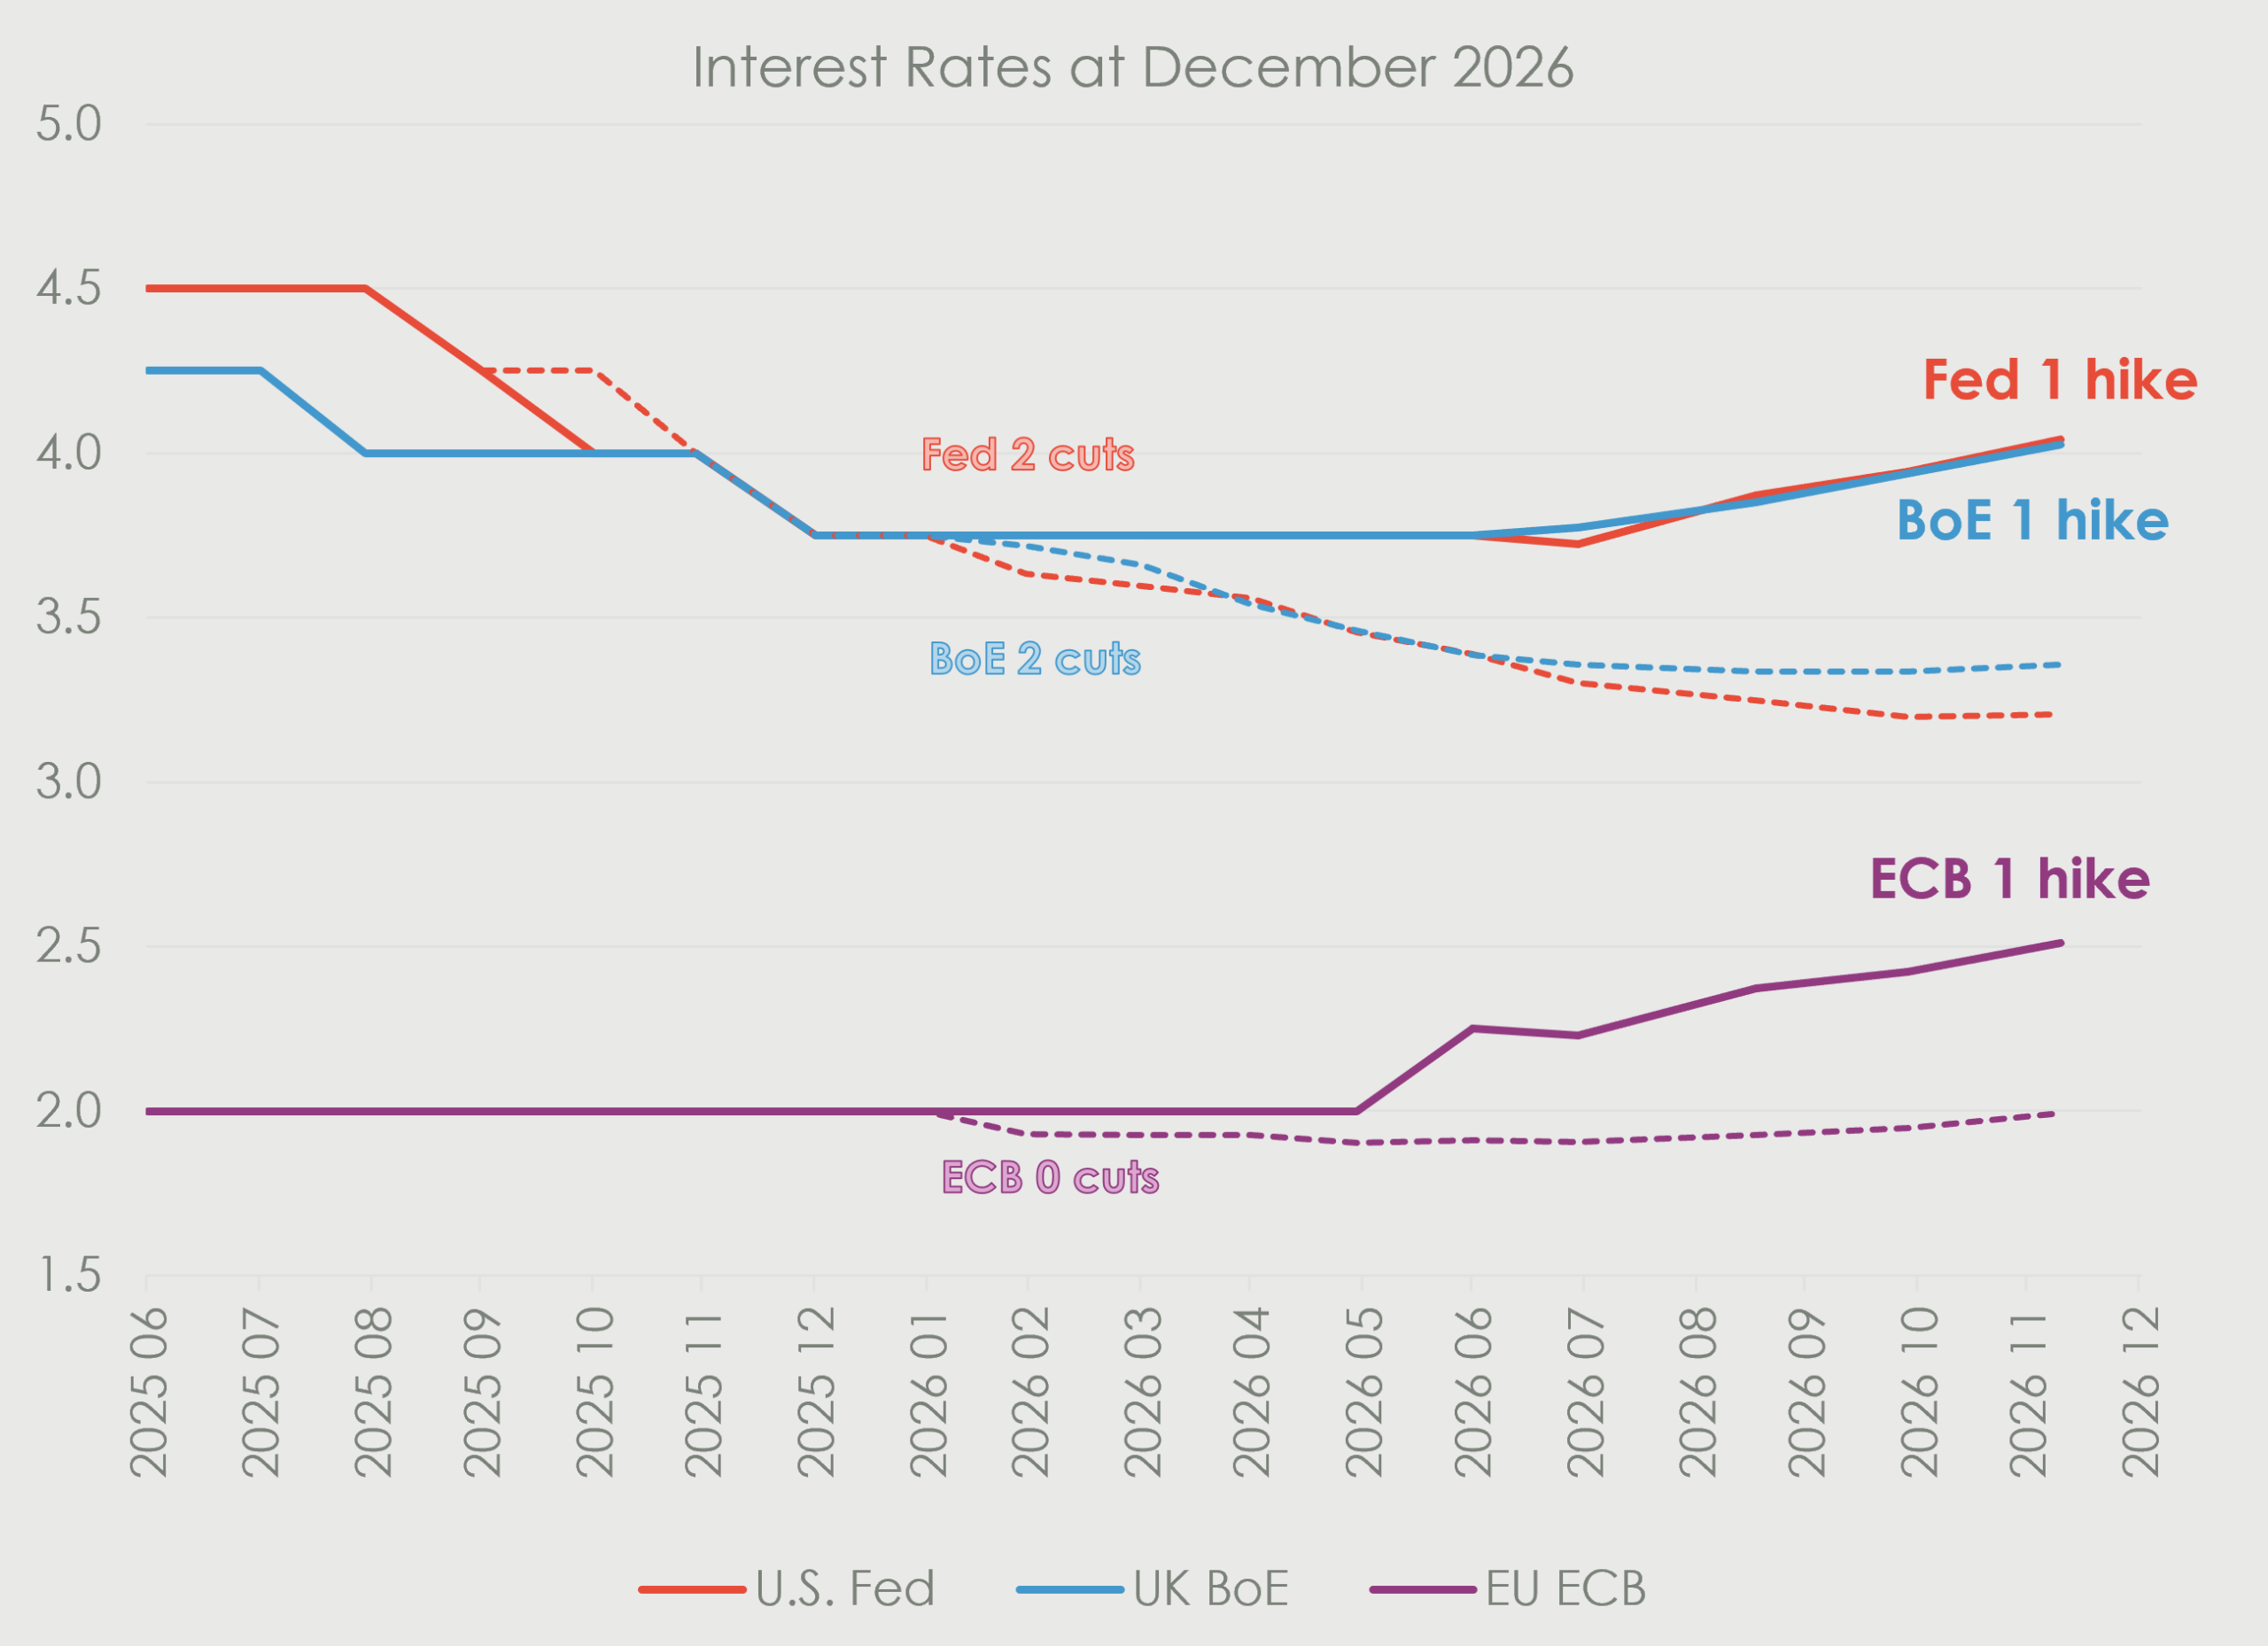
- We have seen expectations for monetary policy become more hawkish. In February we had expectations for further rate cuts which have subsequently pivoted to hikes across multiple developed-market central banks. At this moment the markets are pricing in hikes from the U.S. Fed, BoE and the ECB this year.
-
With a potential stagflationary environment developing and monetary policy set to tighten, you would be forgiven to think global risk markets would be more cautious. Despite some volatility, equity markets have all but shrugged it off.
The main driver for this is AI-stimulated capex growth, showing no signs of abating. The top Hyperscalers continued to spend enormous amounts of money developing infrastructure to keep up with the insatiable demand from the LLM models and AI software developers. The Capex number keeps getting revised higher and higher, with 2026 Capex spend currently forecasted to be $795bln (77% Y/Y) and $1,116trln (40% Y/Y) in 2027.
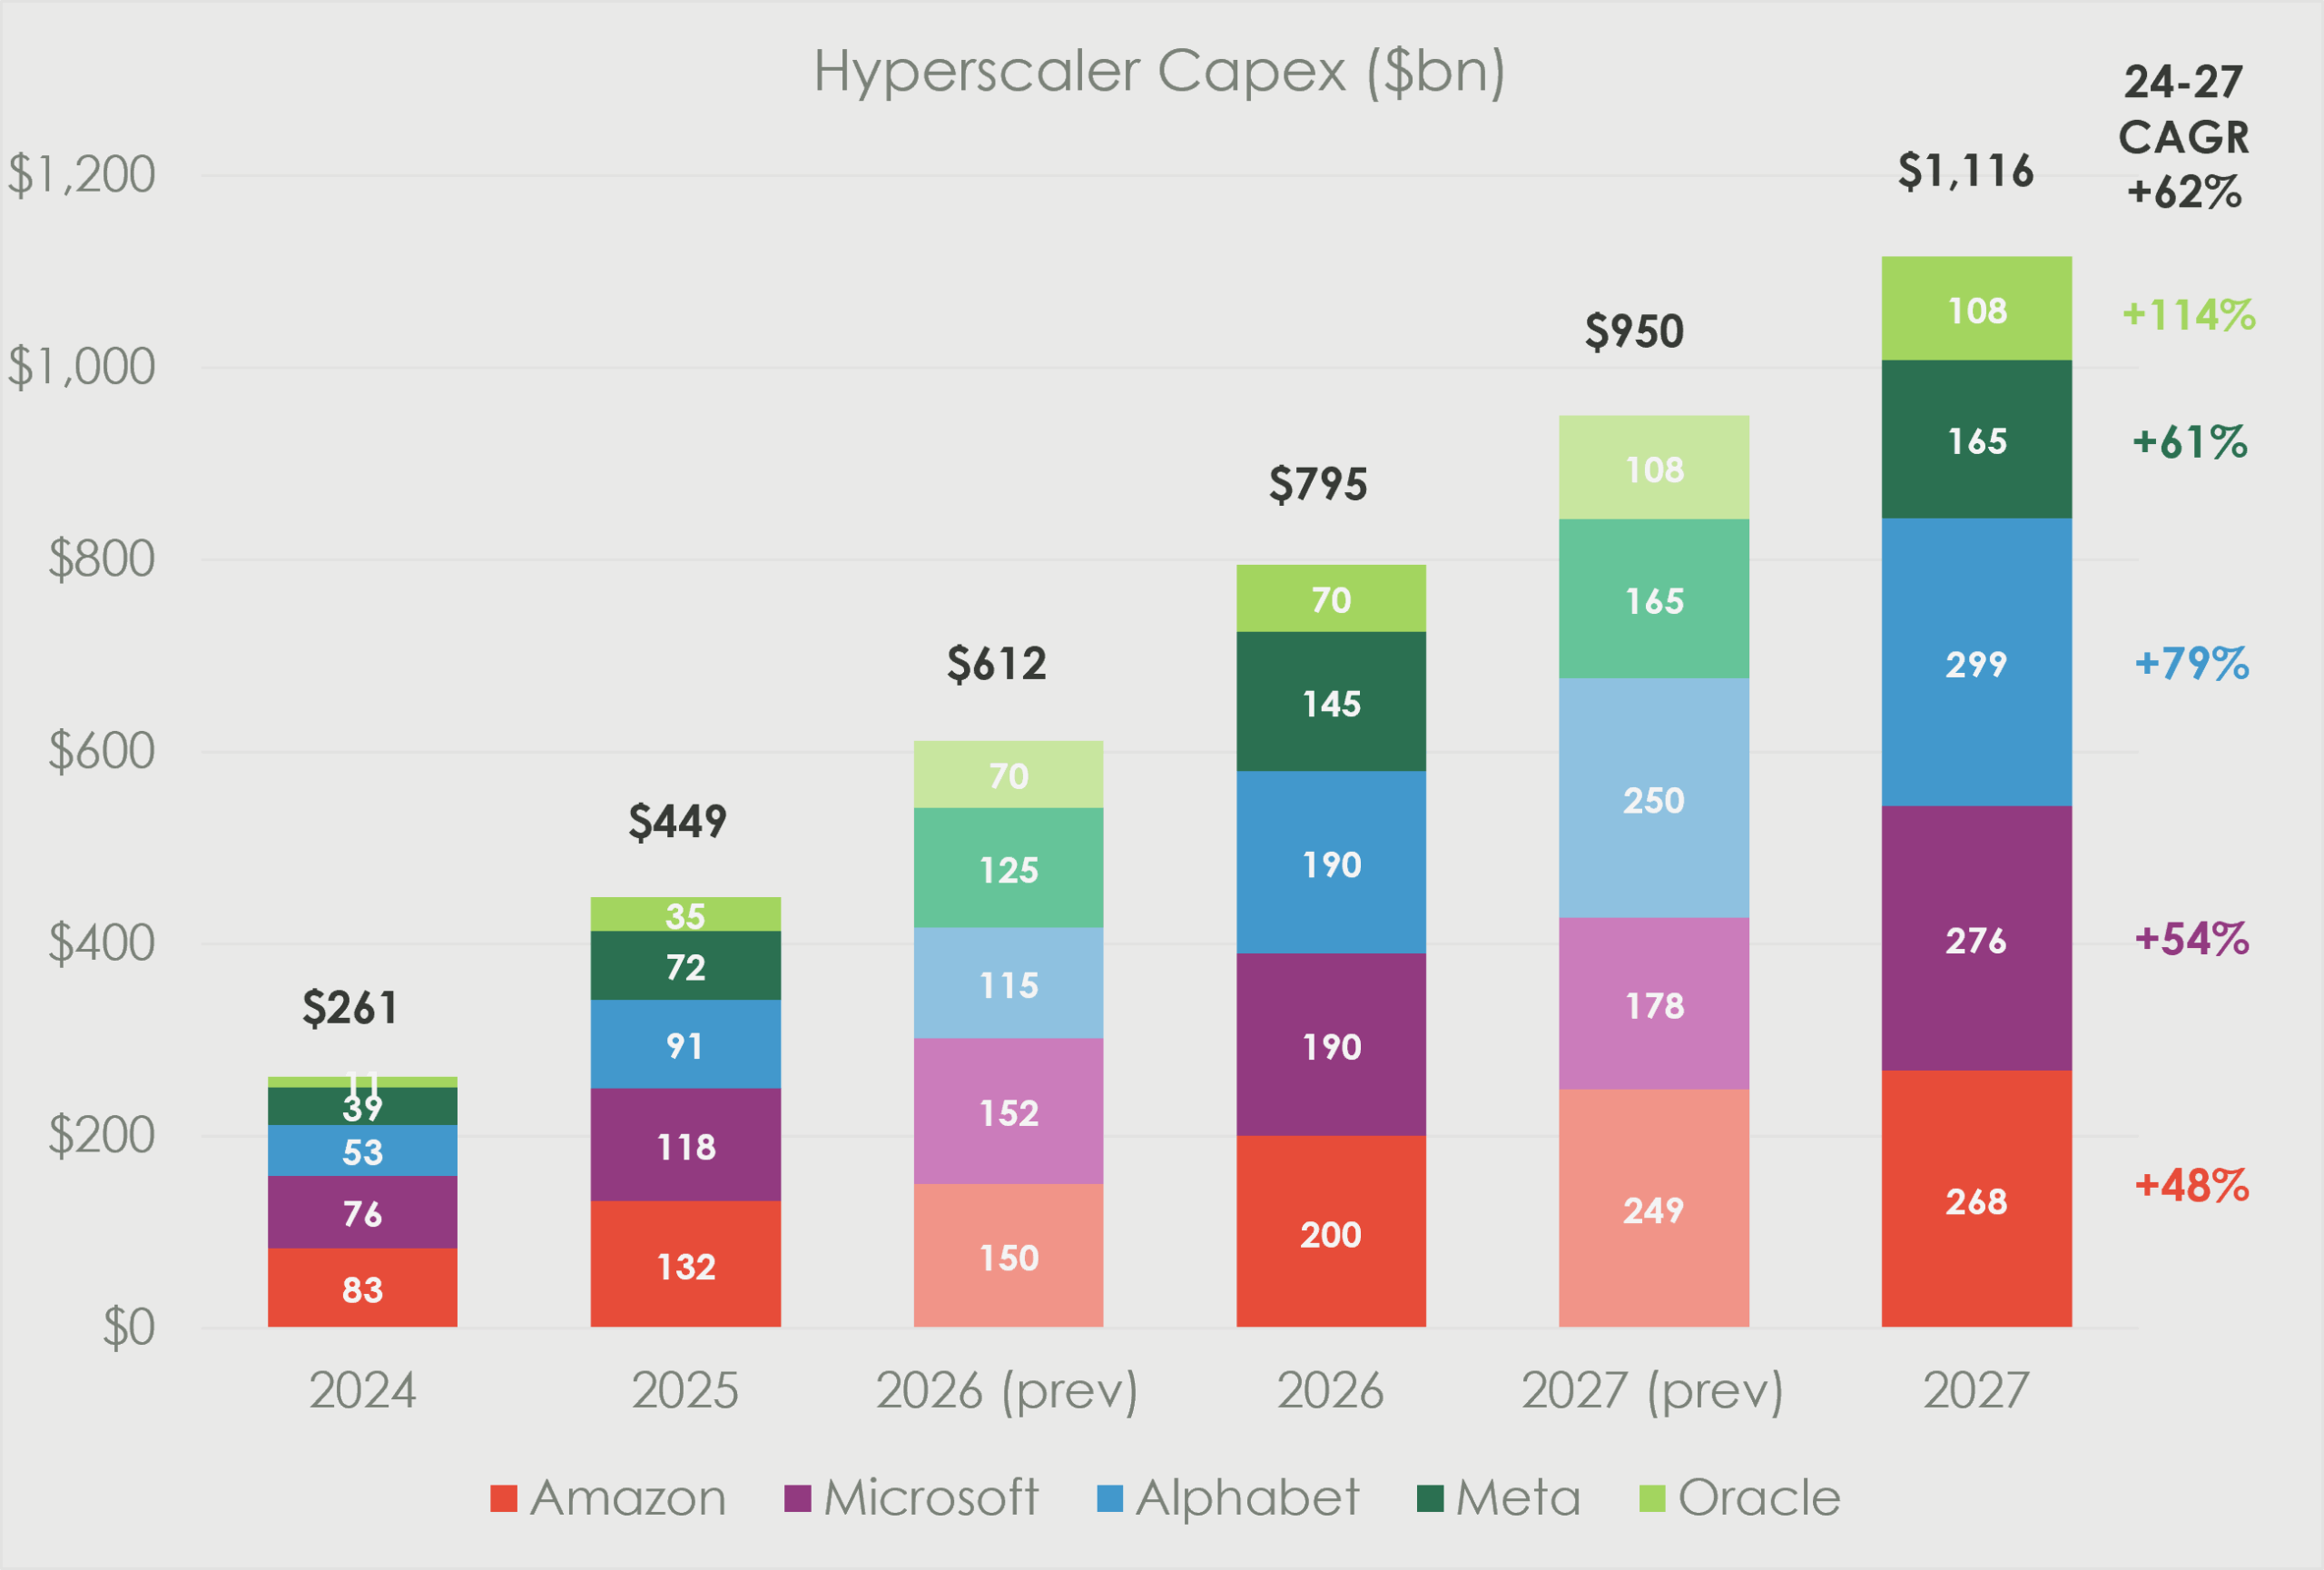
To give these large numbers some perspective, Information Processing Equipment and Software contribution to GDP growth is now close to 40%, up from less than 10% just 6 quarters ago. It is this wave of capital investment that is supporting GDP growth in the U.S. and other countries directly exposed to the AI buildout (Korea, Taiwan and China).
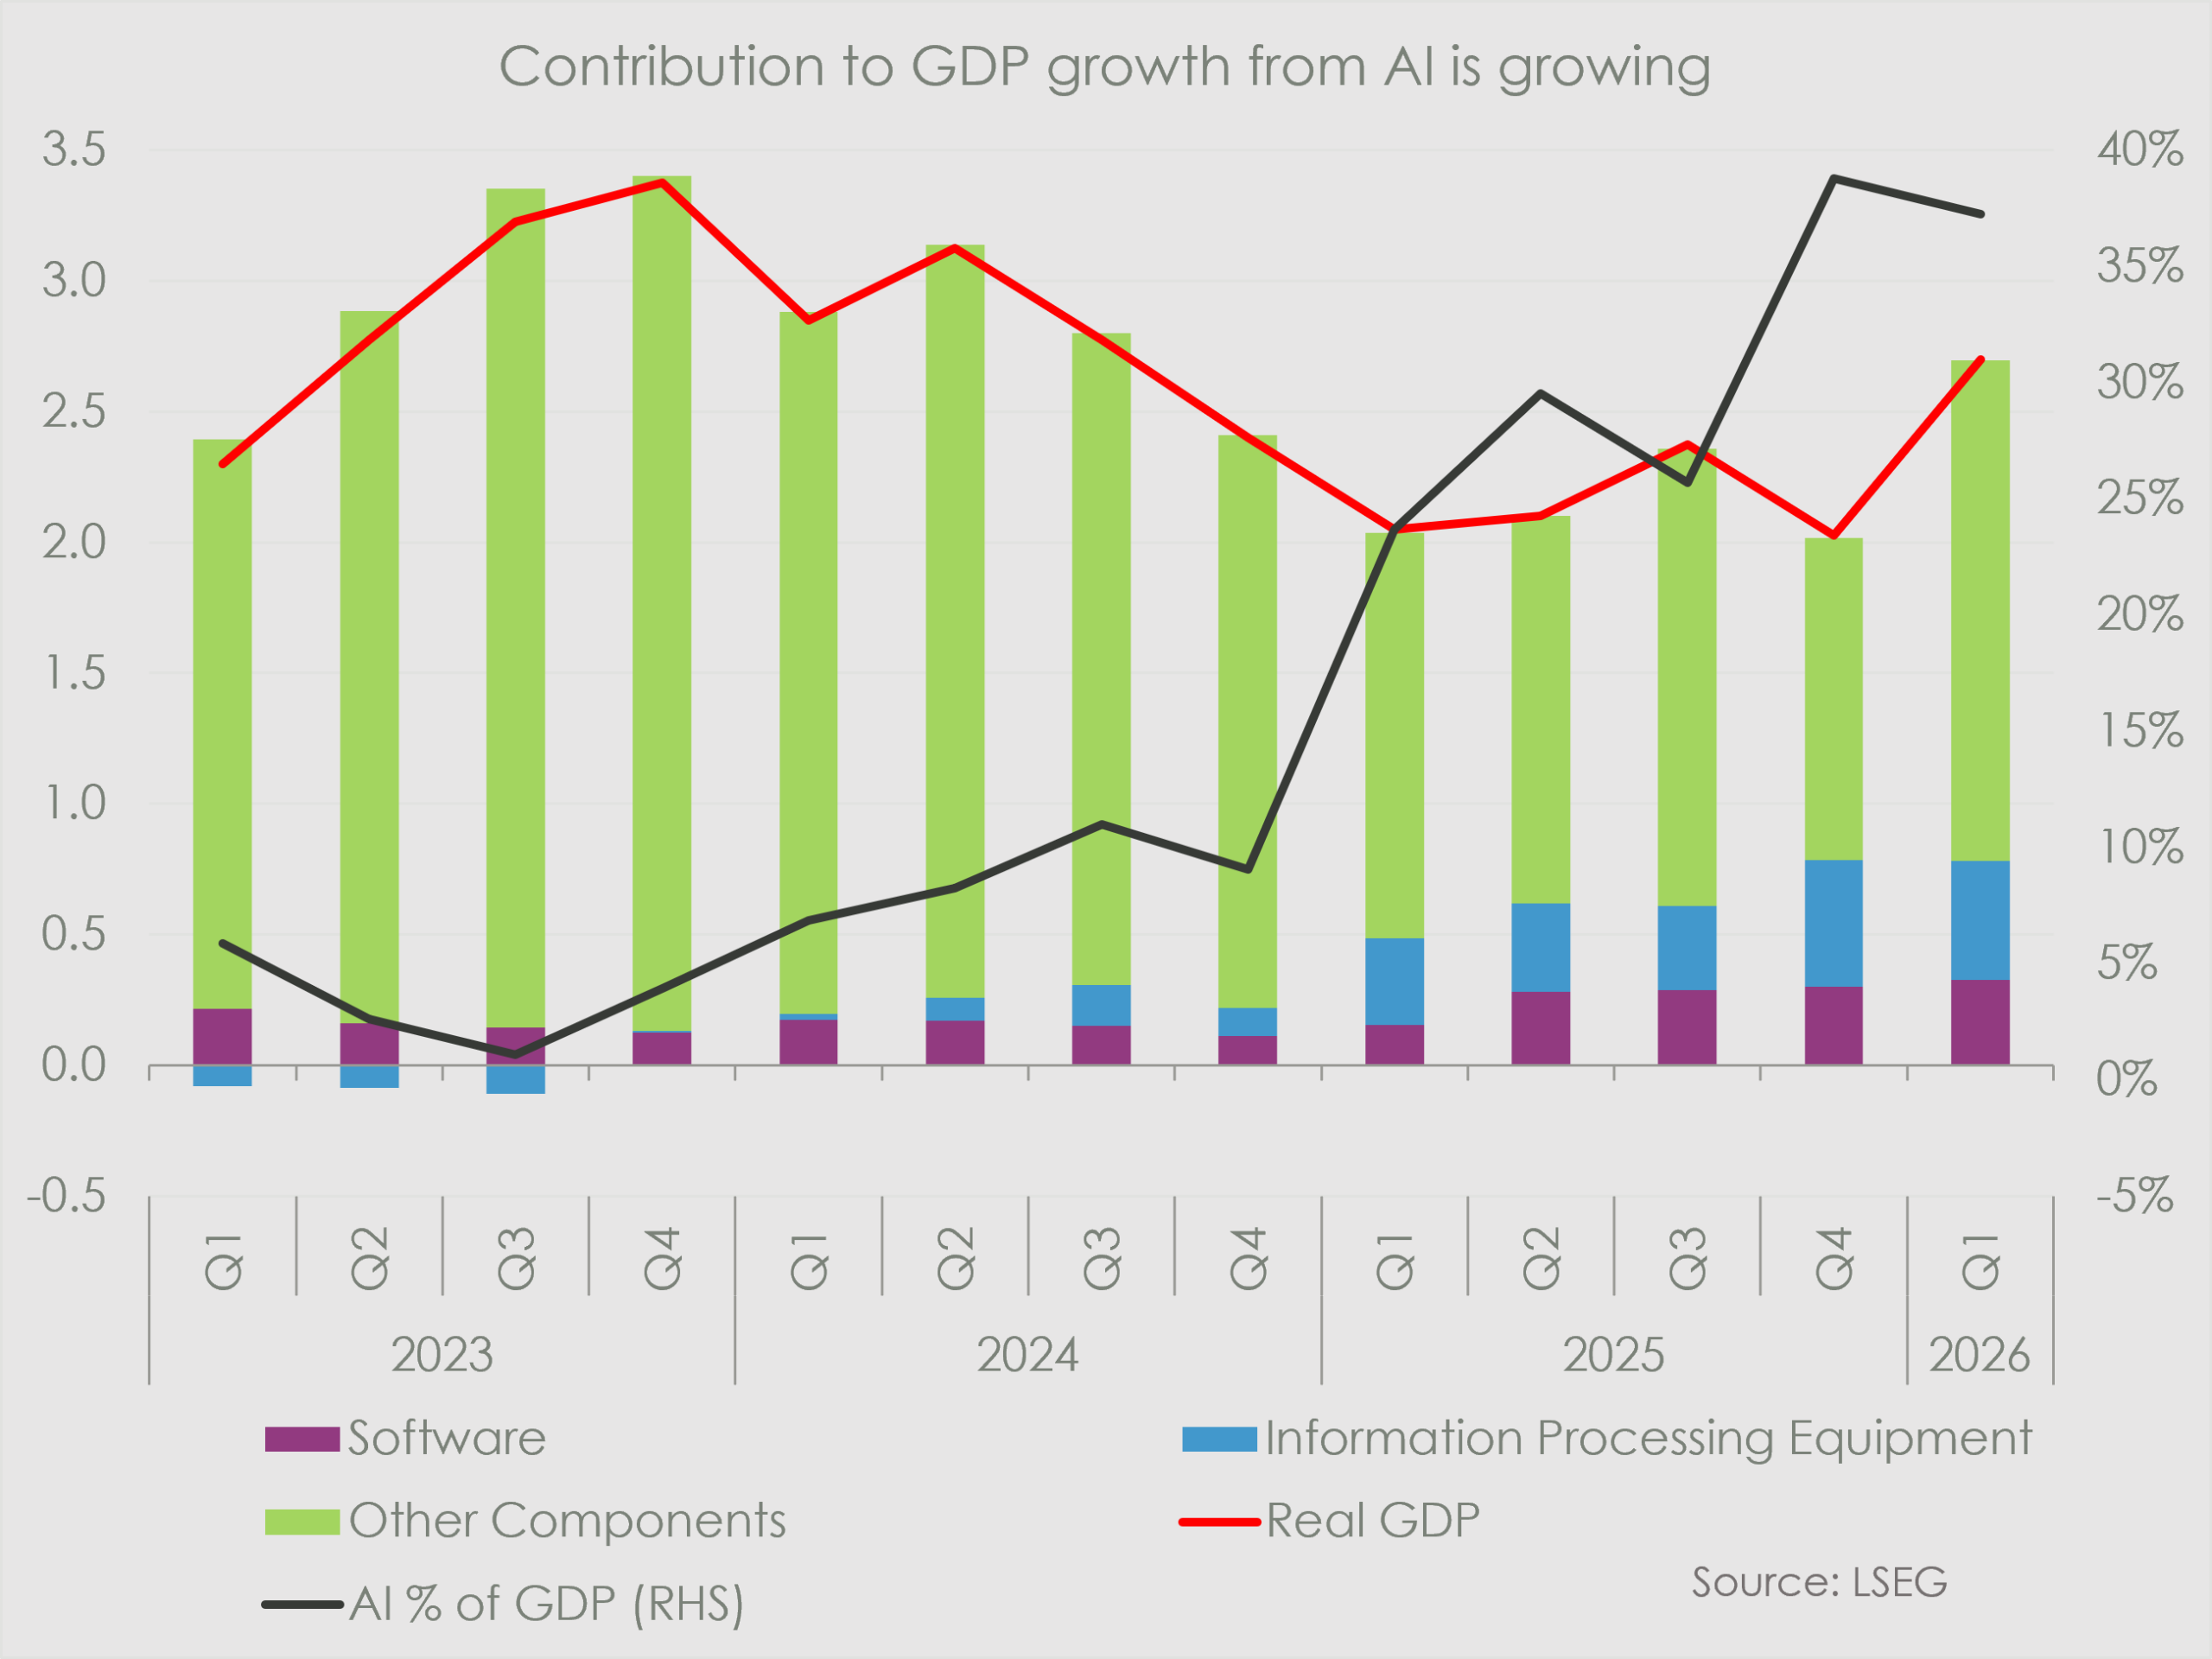
This tech investment has positive ripple effects through the entire economy, right through to the final consumer. So, despite inflation temporarily eating into real incomes, job growth remains buoyant and consumer confidence levels remain resilient.
FEMO – Fabulous Earnings Momentum
This positive investment cycle is driving corporate earnings growth upgrades which is supporting the U.S. equity markets.
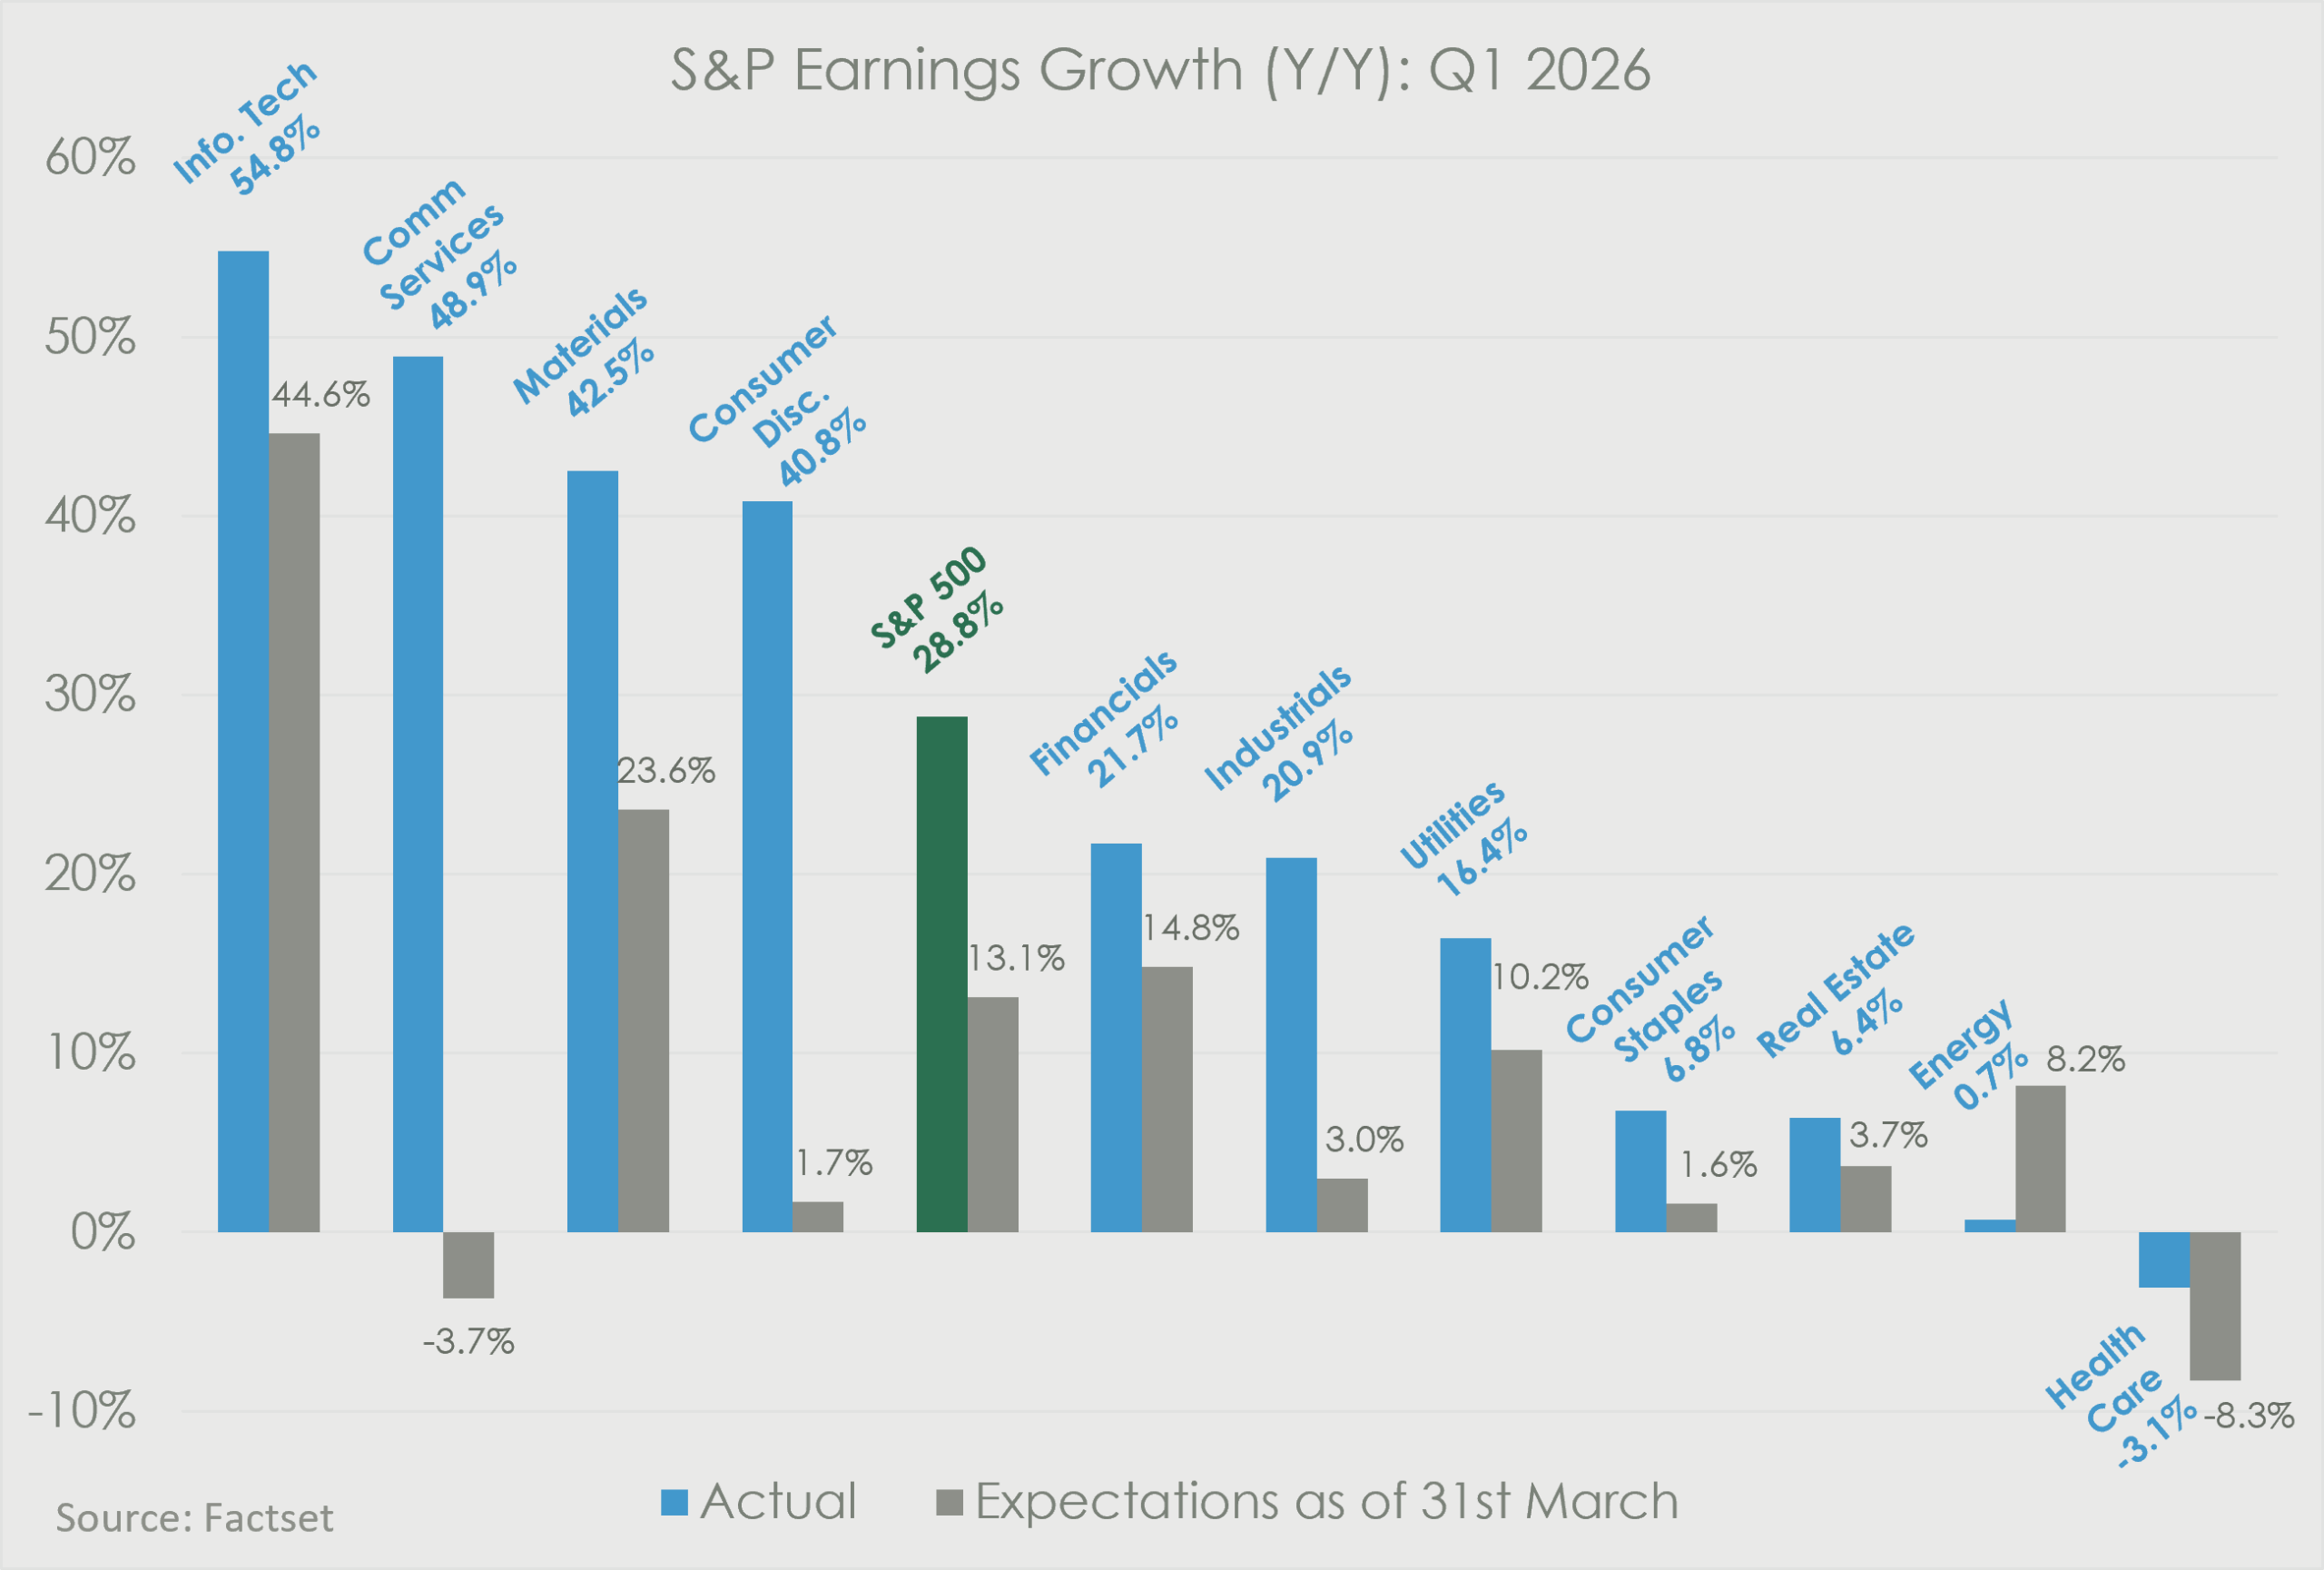
In our 2026 outlook, we viewed strong mid-teens earnings growth enough to deliver solid double-digit returns for equity markets. We have just completed the first quarter earnings reporting season, and earnings growth blew expectations out of the water.
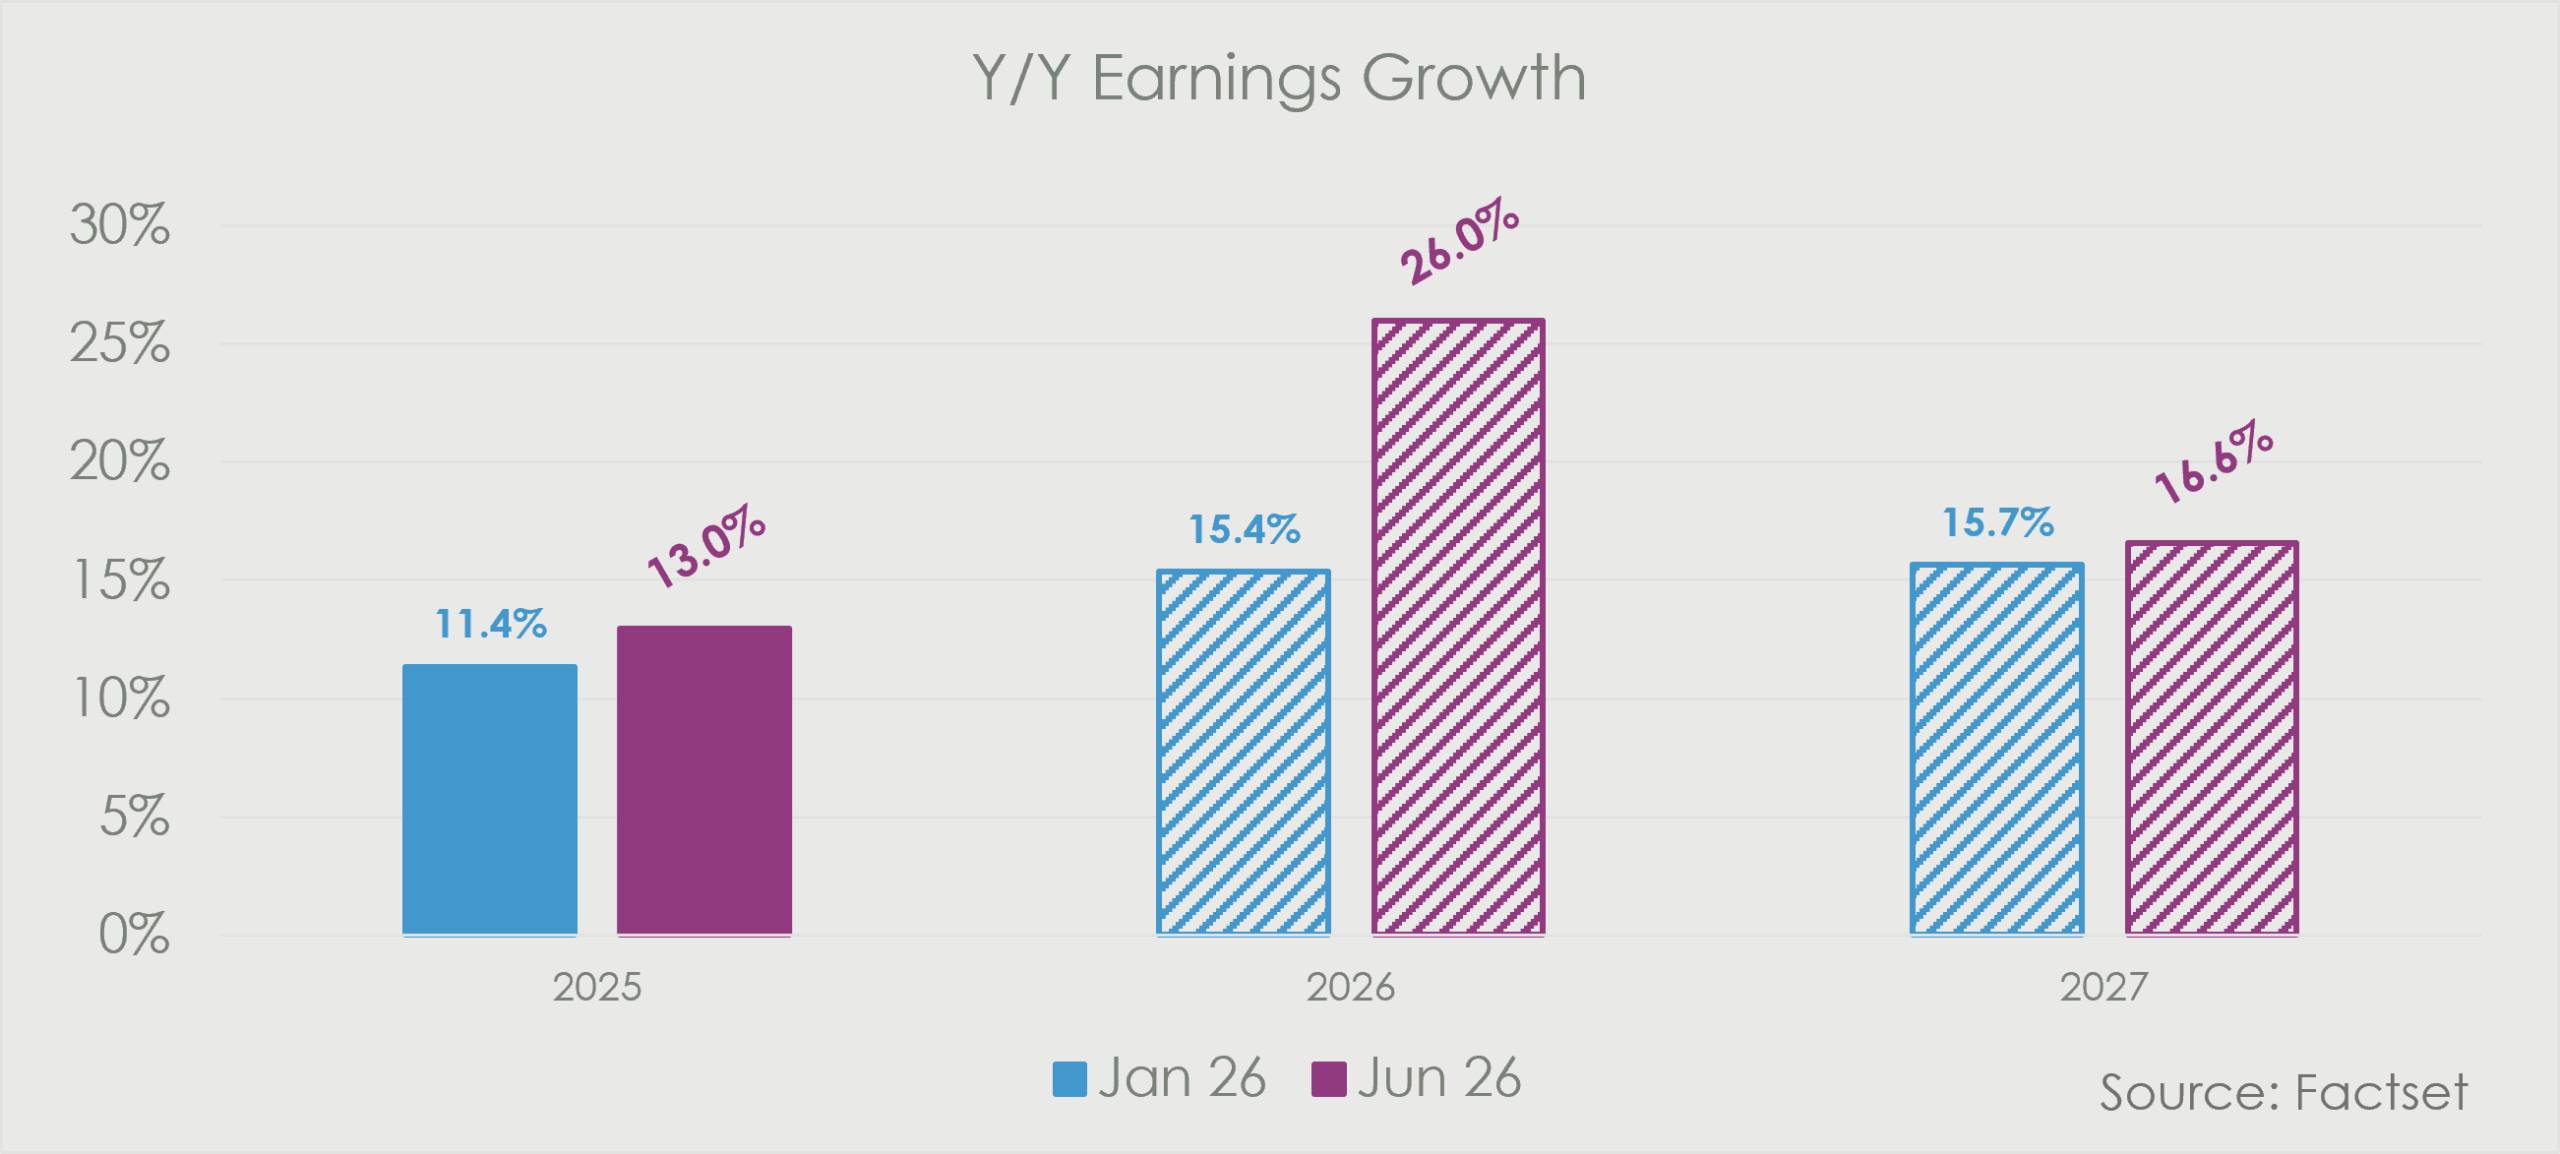
Going into the quarter, expectations were for S&P 500 companies to grow 1Q earnings by 13.1% and for full year growth to be 15.4%. By the end of the reporting season, earnings growth came in at 28.8% Y/Y, while earnings growth expectations for the full year 2026 had moved up to 26%. This level of beat versus expectations is unprecedented and goes a long way to demonstrate the changing operating dynamics being driven by the AI evolution.
To sum up 1Q earnings:
-
-
- 85% of S&P 500 companies reported positive earnings surprise
- The average beat was 16.7%
- 1Q EPS growth rate came in at 28.8% Y/Y – the highest growth rate since 4Q21
- 1Q revenue growth was 11.9% Y/Y
- Profit Margins continue to improve, with 1Q Profit Margins increased to a record 14.8%, up 120bps Q/Q and 200bps Y/Y
-
The important thing to point out is that while the Technology companies are certainly the main beneficiaries, the strong level of upside surprise was broad based across all the sectors; demonstrating the trickle-down effect from the pickup in technology investments.
Earnings growth expectations have been upgraded for 2026 and 2027. For 2026 we are now expecting 26.0% Y/Y growth and 16.6% Y/Y for 2027.
The pace of earnings growth increases is moving way ahead of market performance; resulting in valuations pulling back to 20x, which currently lies on the 5-year average.
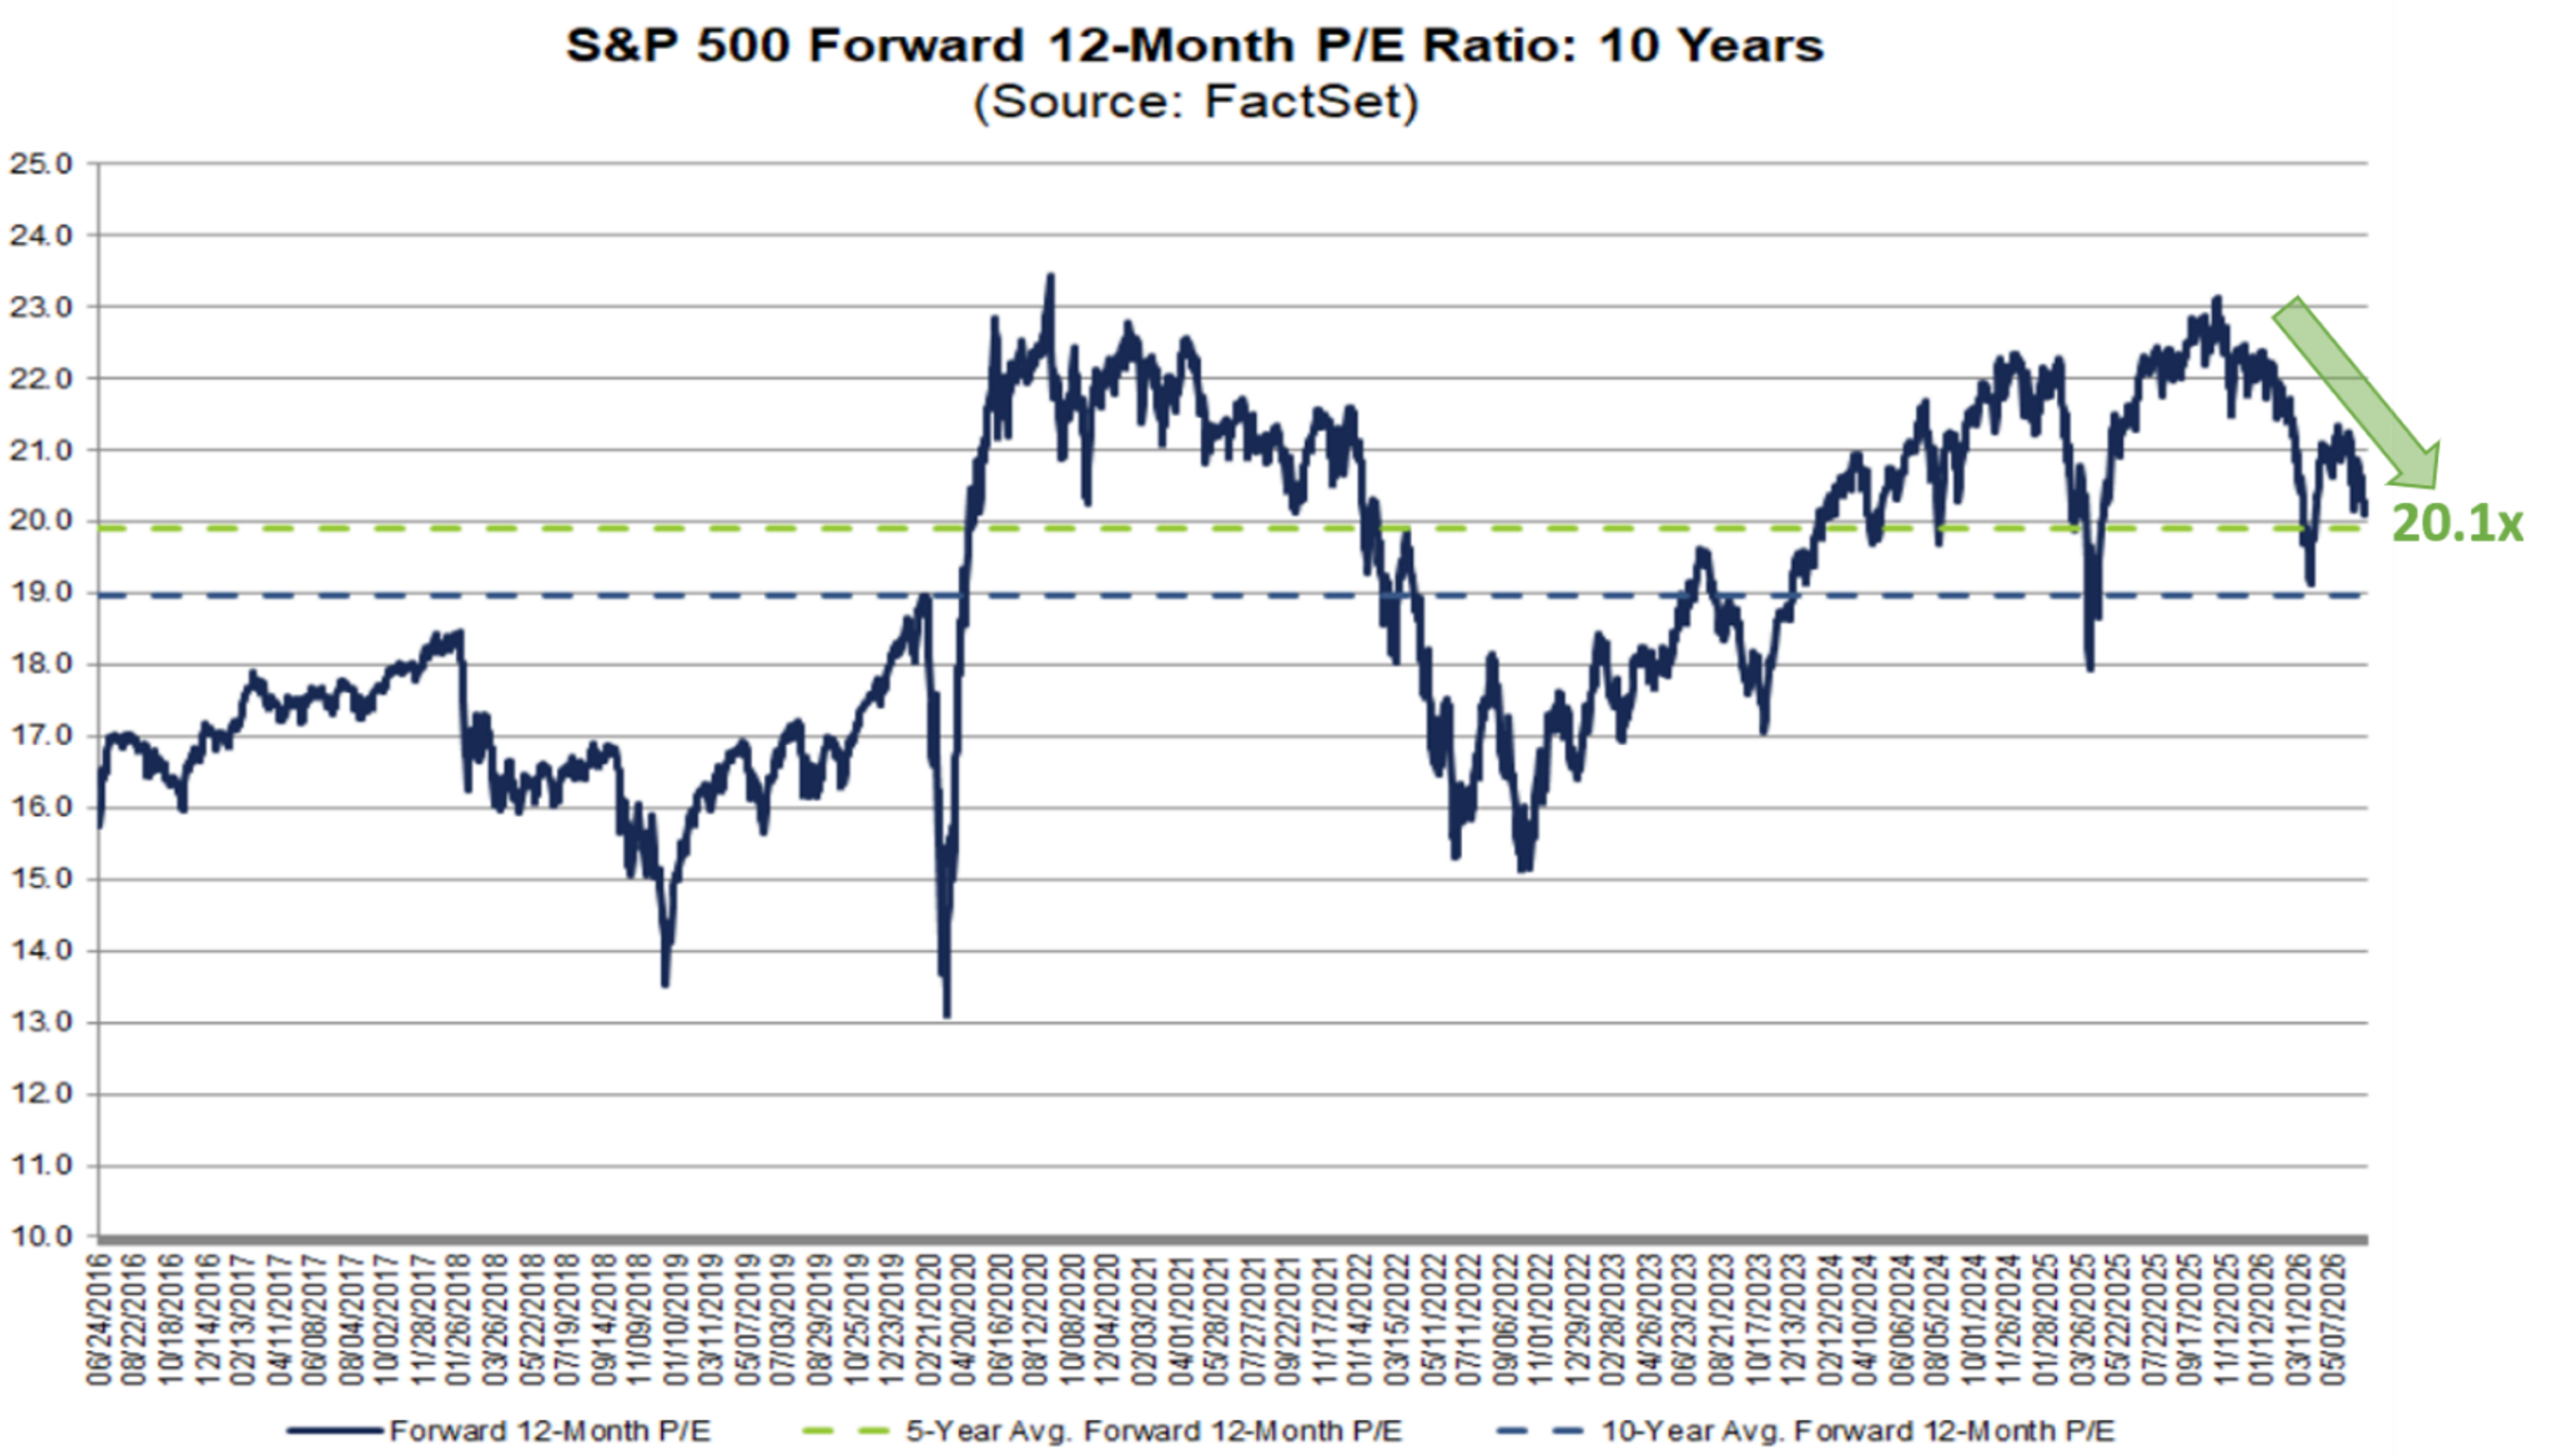
With earnings outperforming and valuations having normalized a bit, this continues to support our thesis that earnings growth alone is enough to drive positive global equities performance in 2026.
Looking Ahead Over the Next 6 Months:
-
- Consumer confidence will be buoyed by the declining fuel prices, which will support consumer spending and equity market sentiment.
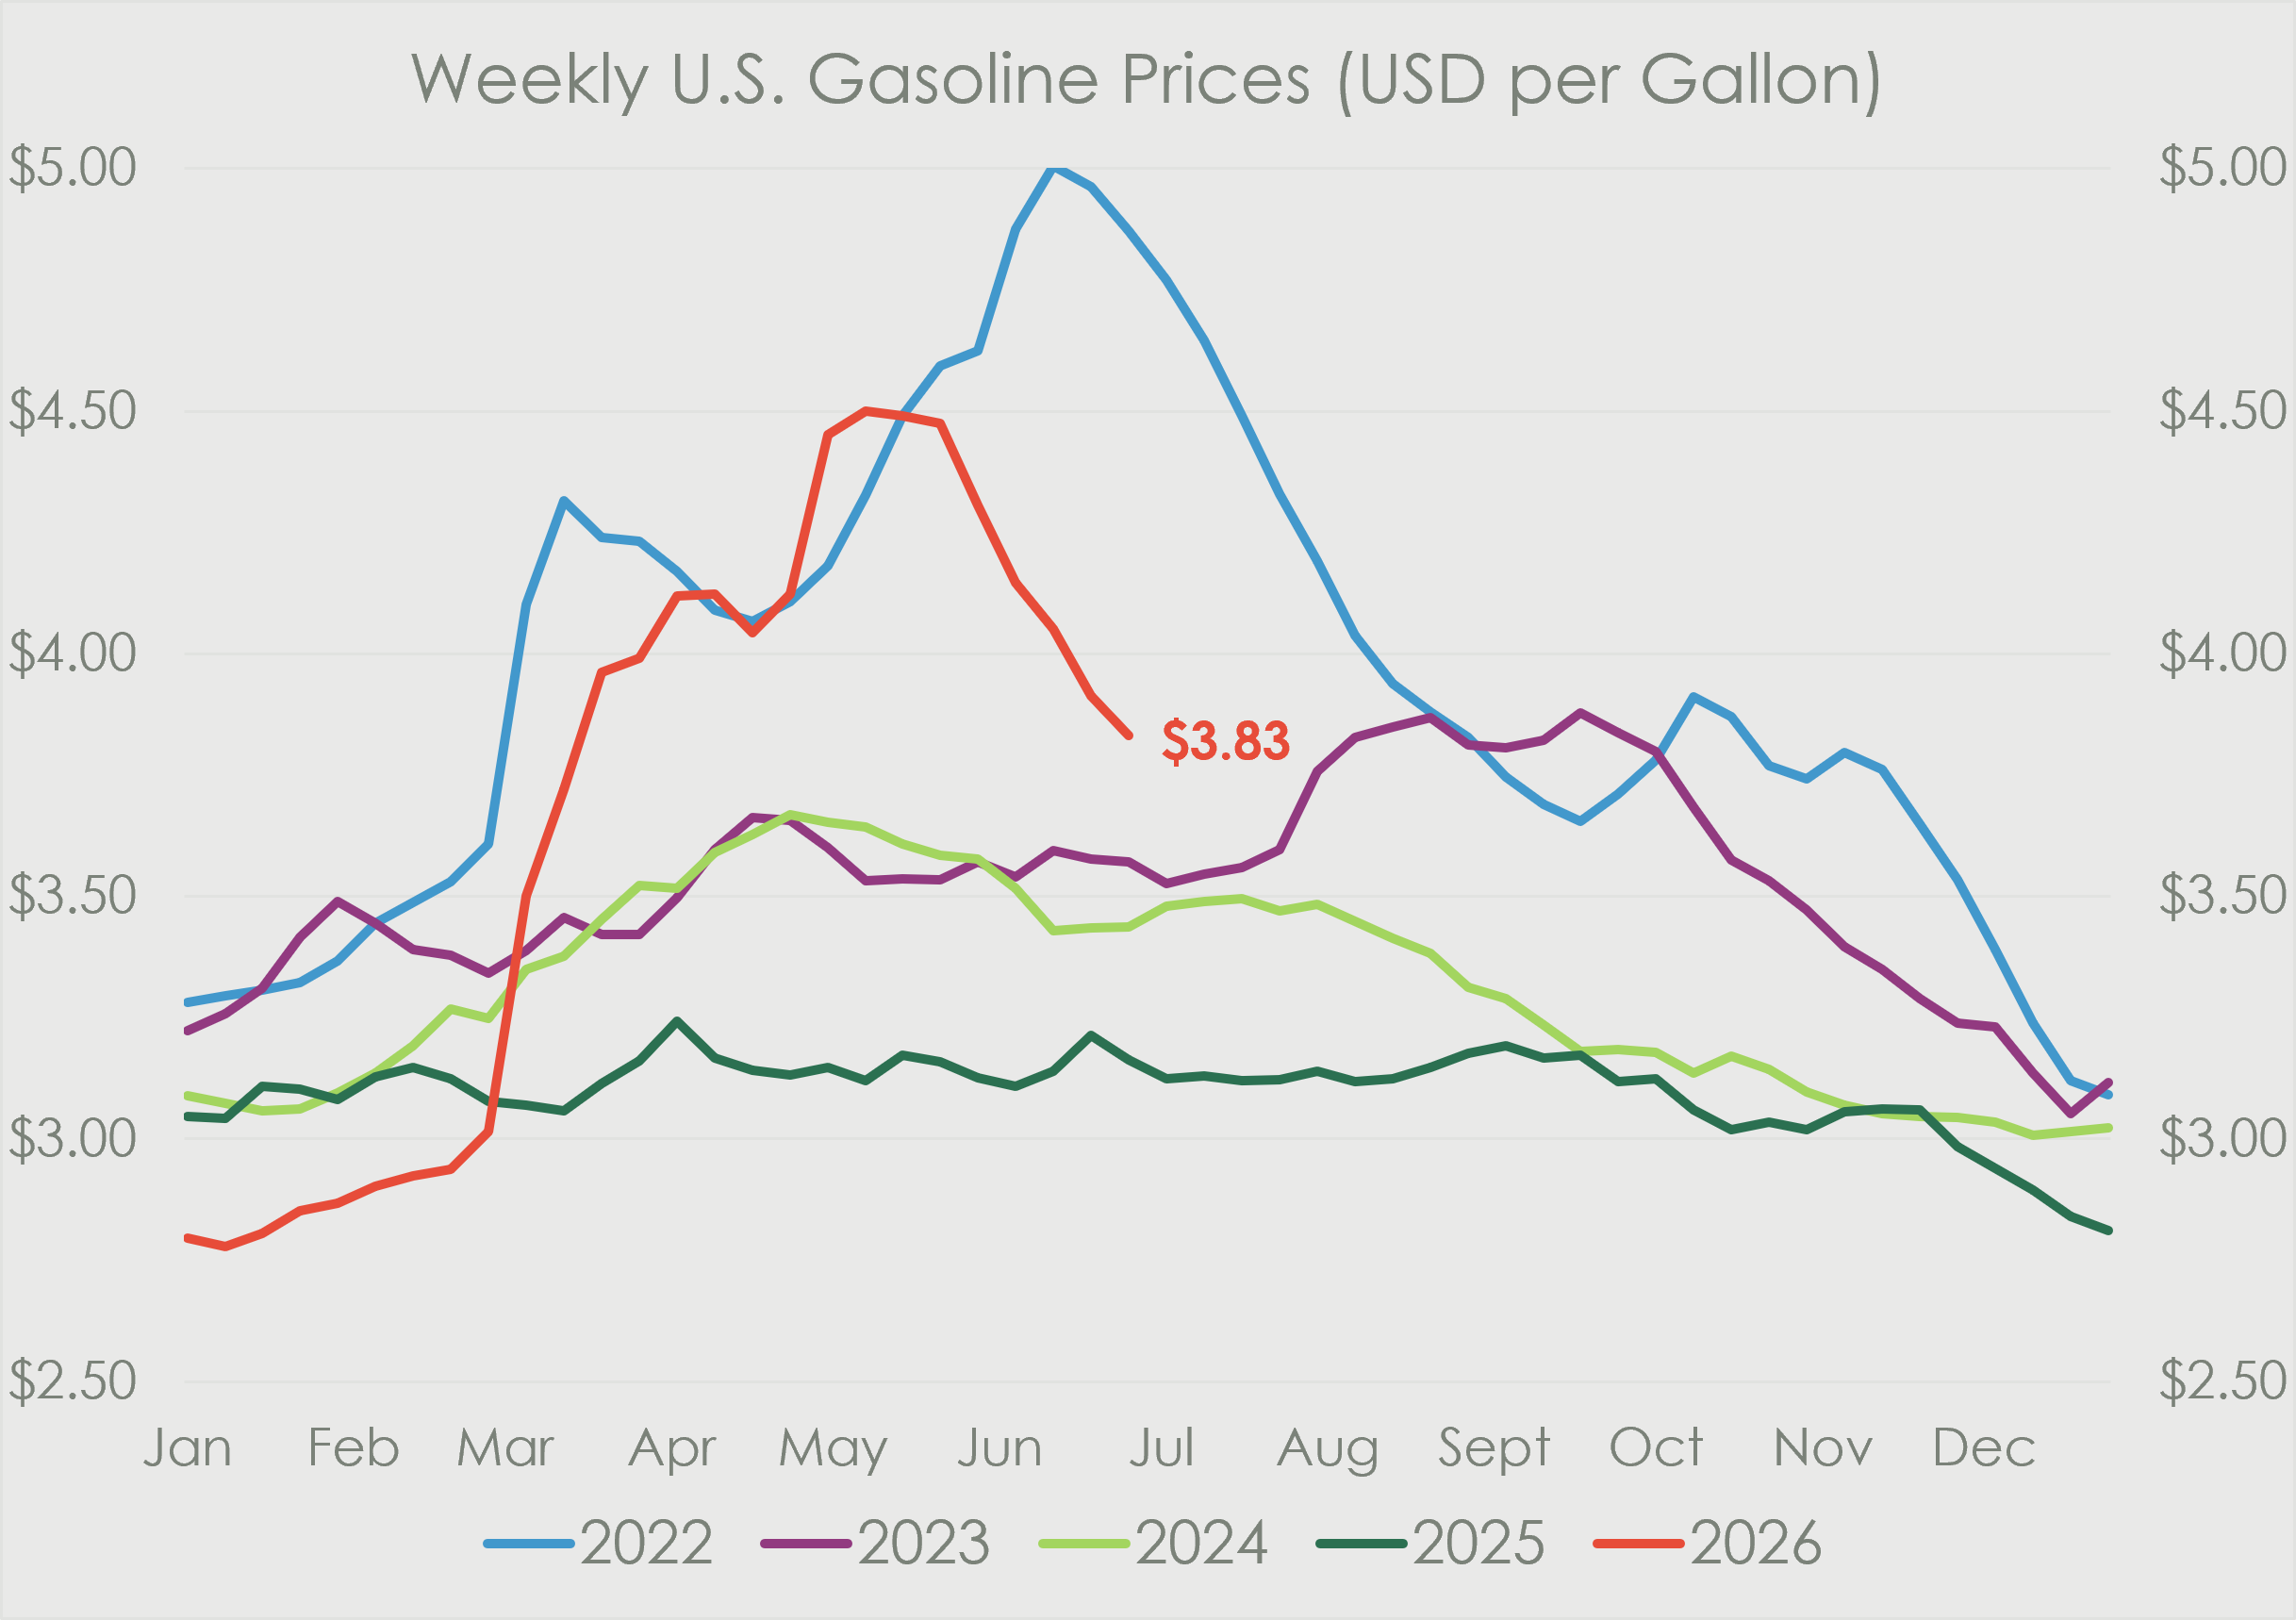
- We expect the pace of AI spending to continue as we move closer to enterprise scale adoption which will signal the next stage of the AI evolution.
- With inflation working its way through the supply chains, the winners over the next 6 months are going to be those companies who have pricing power and are able to protect margins, while at the same time maintaining sales volumes. We will be keeping a sharp eye out in order to separate the winners from those battling to pass on the rising cost of goods sold.
- Global politics will remain in the mainstream.
- In the U.S. we expect President Donald Trump to pull back slightly as he focuses on mid-term elections in November. As it currently stands, the Republicans are looking like they will lose the majority in the House and narrowly retain the Senate. This will render President Trump a lame duck; essentially preventing him from making any sweeping unilateral decisions. This should go a long way to reducing political volatility, which will be welcomed by global equity markets.
- In the UK, there will be a new Prime Minister who will take over, facing the same issues as Keir Starmer; weak economic growth and government balance sheet that leaves little room for stimulus.
- Europe remains in a tight spot, with inflation above target and weak GDP growth outlook. Increasing investments in defence and increasing demand for electricity should provide support for the Industrial sector while financial institutions are inline to benefit from increased funding requirements.
- The U.S. and China relationship can be classed as stable rivalry, with tensions unlikely to escalate. China is likely to remain highly pragmatic and use necessary levers to achieve its growth targets (circa 5%) and strengthening its competitive position within AI. The U.S. is expected to remain vigilant on fair trade; threatening tariffs where deemed necessary without derailing its current relationship with China.
Conclusion
Overall, we remain constructive on the global equity markets for remainder of 2026. The original case rested on a supportive macro backdrop and strong earnings growth; the mid-year case now rests more heavily on the exceptional scale of AI-driven investment, broad-based earnings upgrades, resilient consumers, and normalized valuations.