

Wind in Our Sails
As we begin 2026, the South African economy has gathered meaningful momentum. Investor interest has measurably improved, with various benchmark instruments displaying multiyear strength and confidence returning. Consequently, global financial institutions have validated the improvement in the South African investment thesis, recognizing the structural nature of the progress. In our view, South African risk assets are materially undervalued relative to the opportunity set, with the stage set for a meaningful rerating.
Bullish Setup to Start 2026:
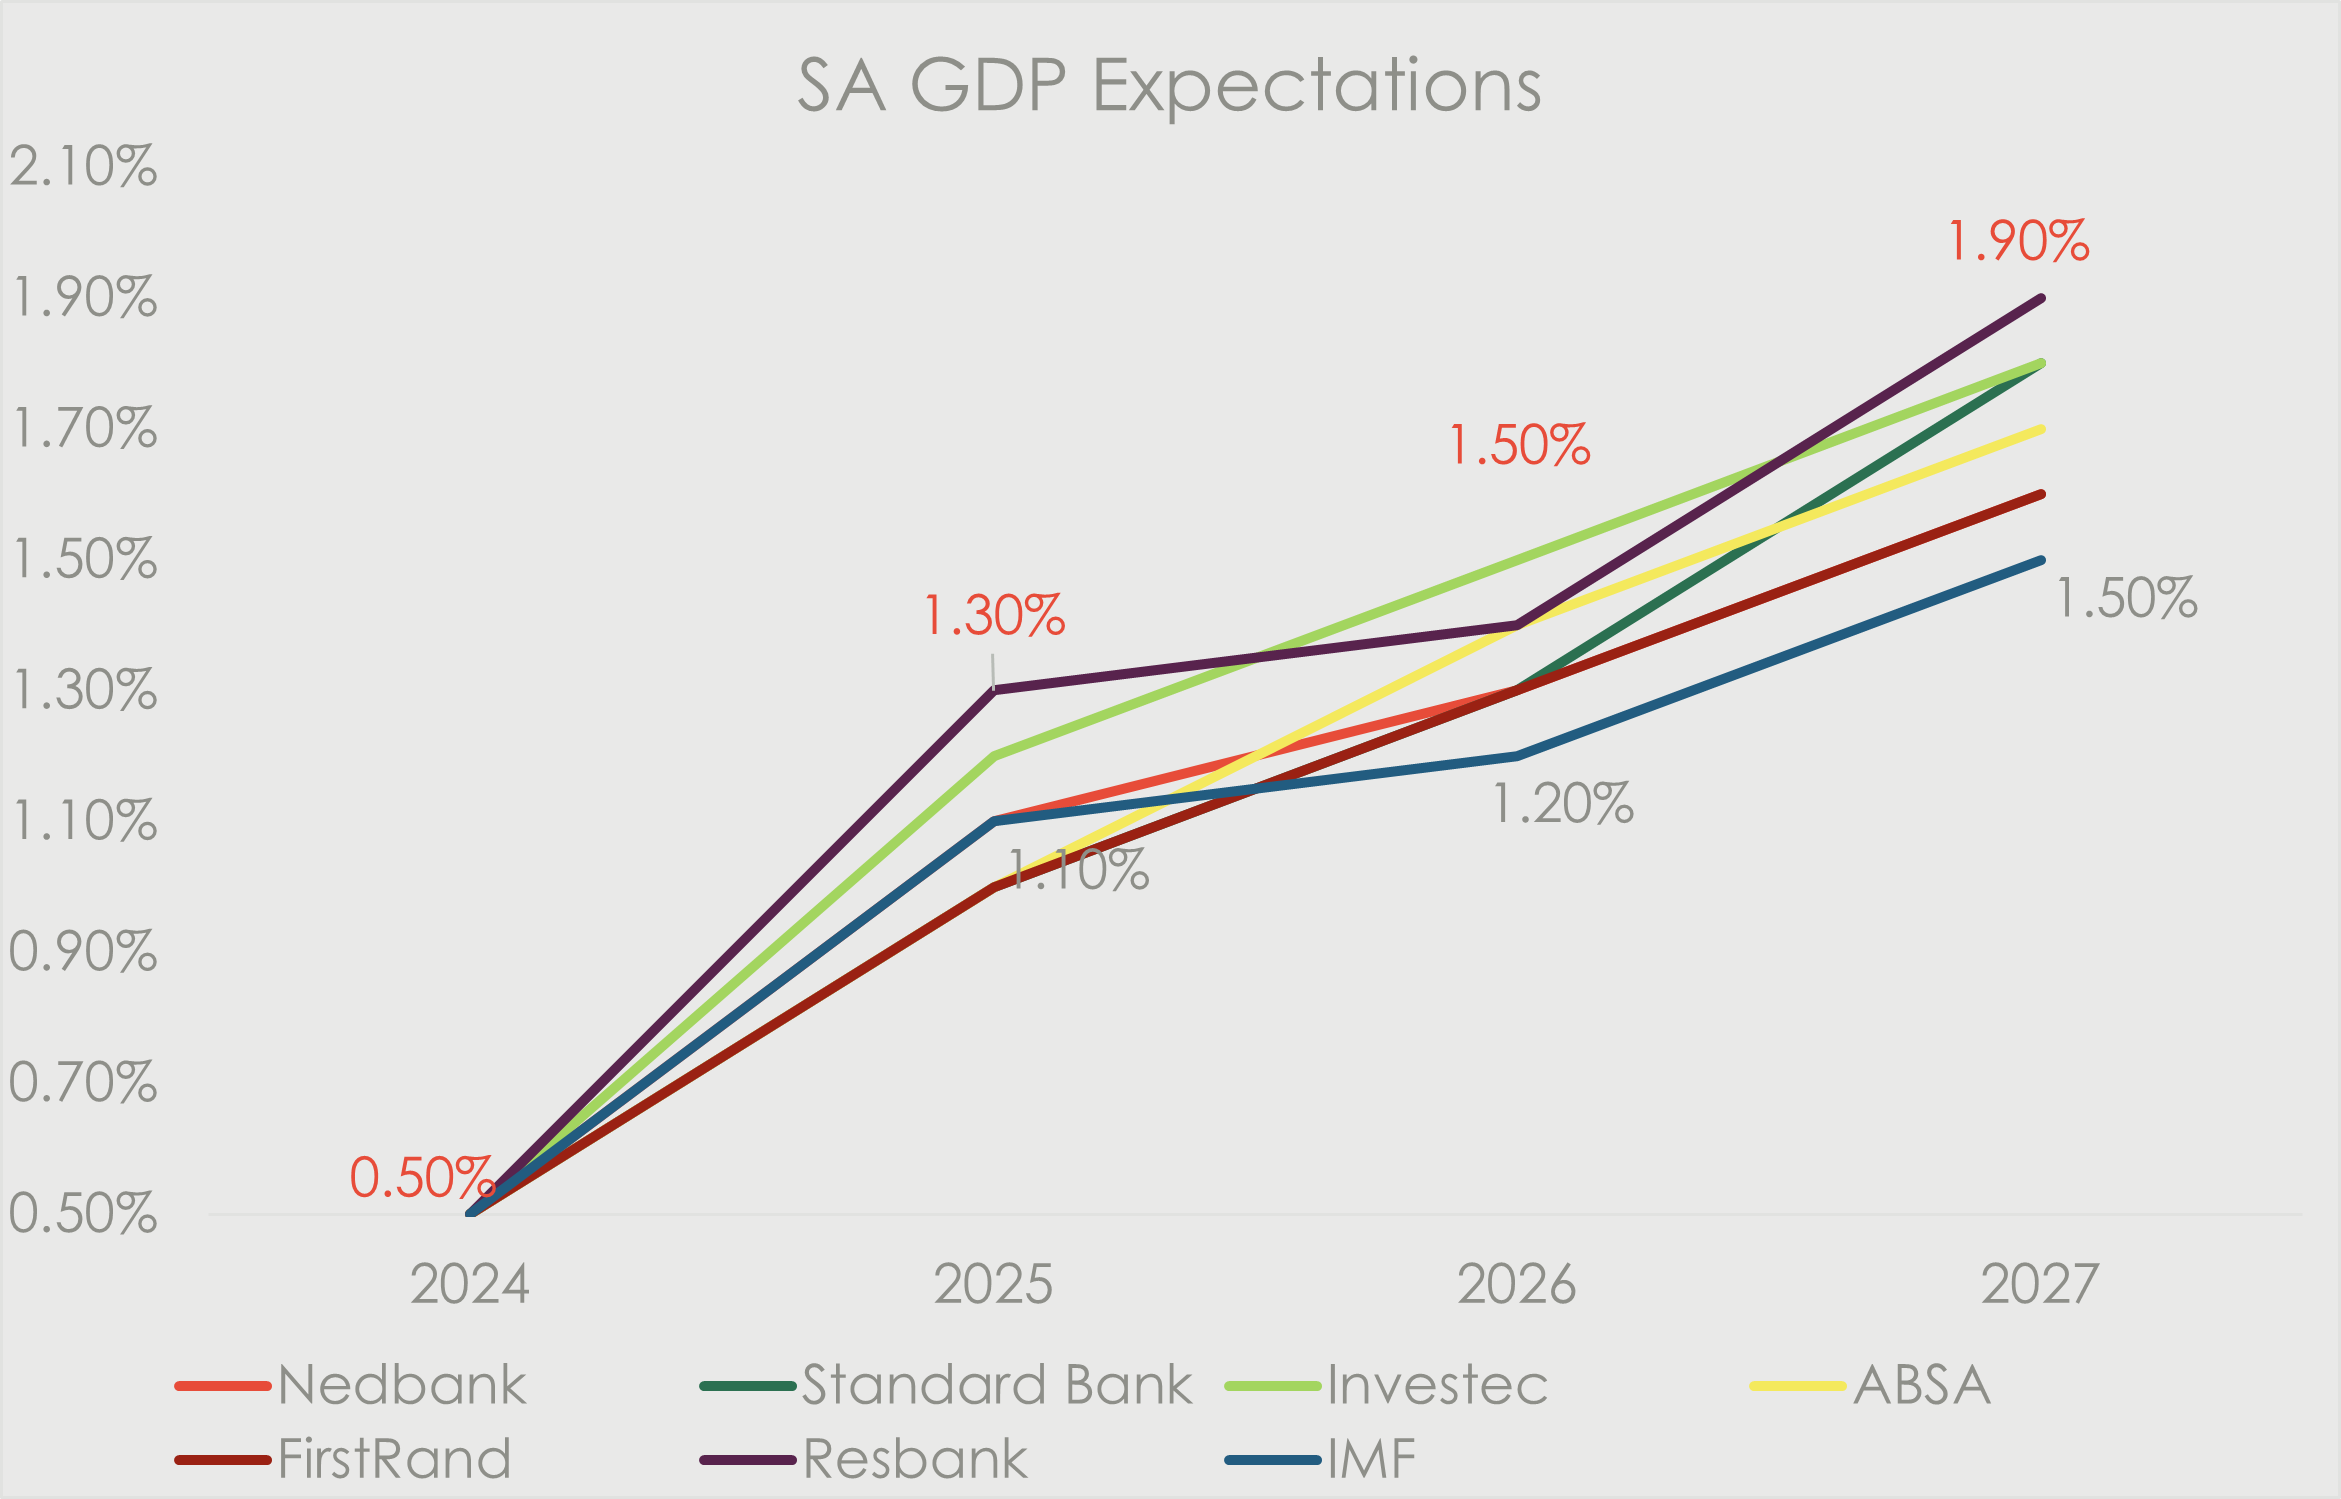
GDP for 2025 is expected to come in at around 1.2%, more than double the 2024 level. Looking ahead at 2026, our base assumption is for a further 1.4% growth, with forecasts for the subsequent years predicting additional acceleration. At these growth rates, analysts expect both a pick-up in earnings growth and a rerating of the multiple at which South African assets trade.
Capital Formation Is Key:
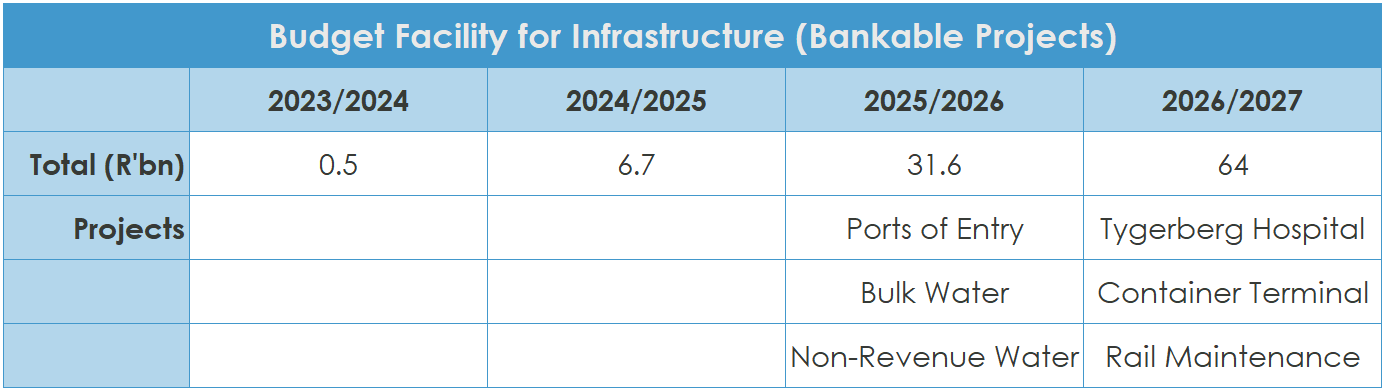
The key to unlocking this growth potential is capital investment. An incremental R15bn in capital investment spend will drive a multiplier effect throughout the economy. By way of reference, an annualised R670bn of capital investment was spent in 2025. Treasury infrastructure spending plans for the 2025/2026-year totals R31.6bn, which, when adjusting for possible delays leaves them with material headroom to hit that target. This spending is accompanied by a revamped public-private partnership framework, which could lead to outsized economic gain.
Network Infrastructure Improvements Continue:
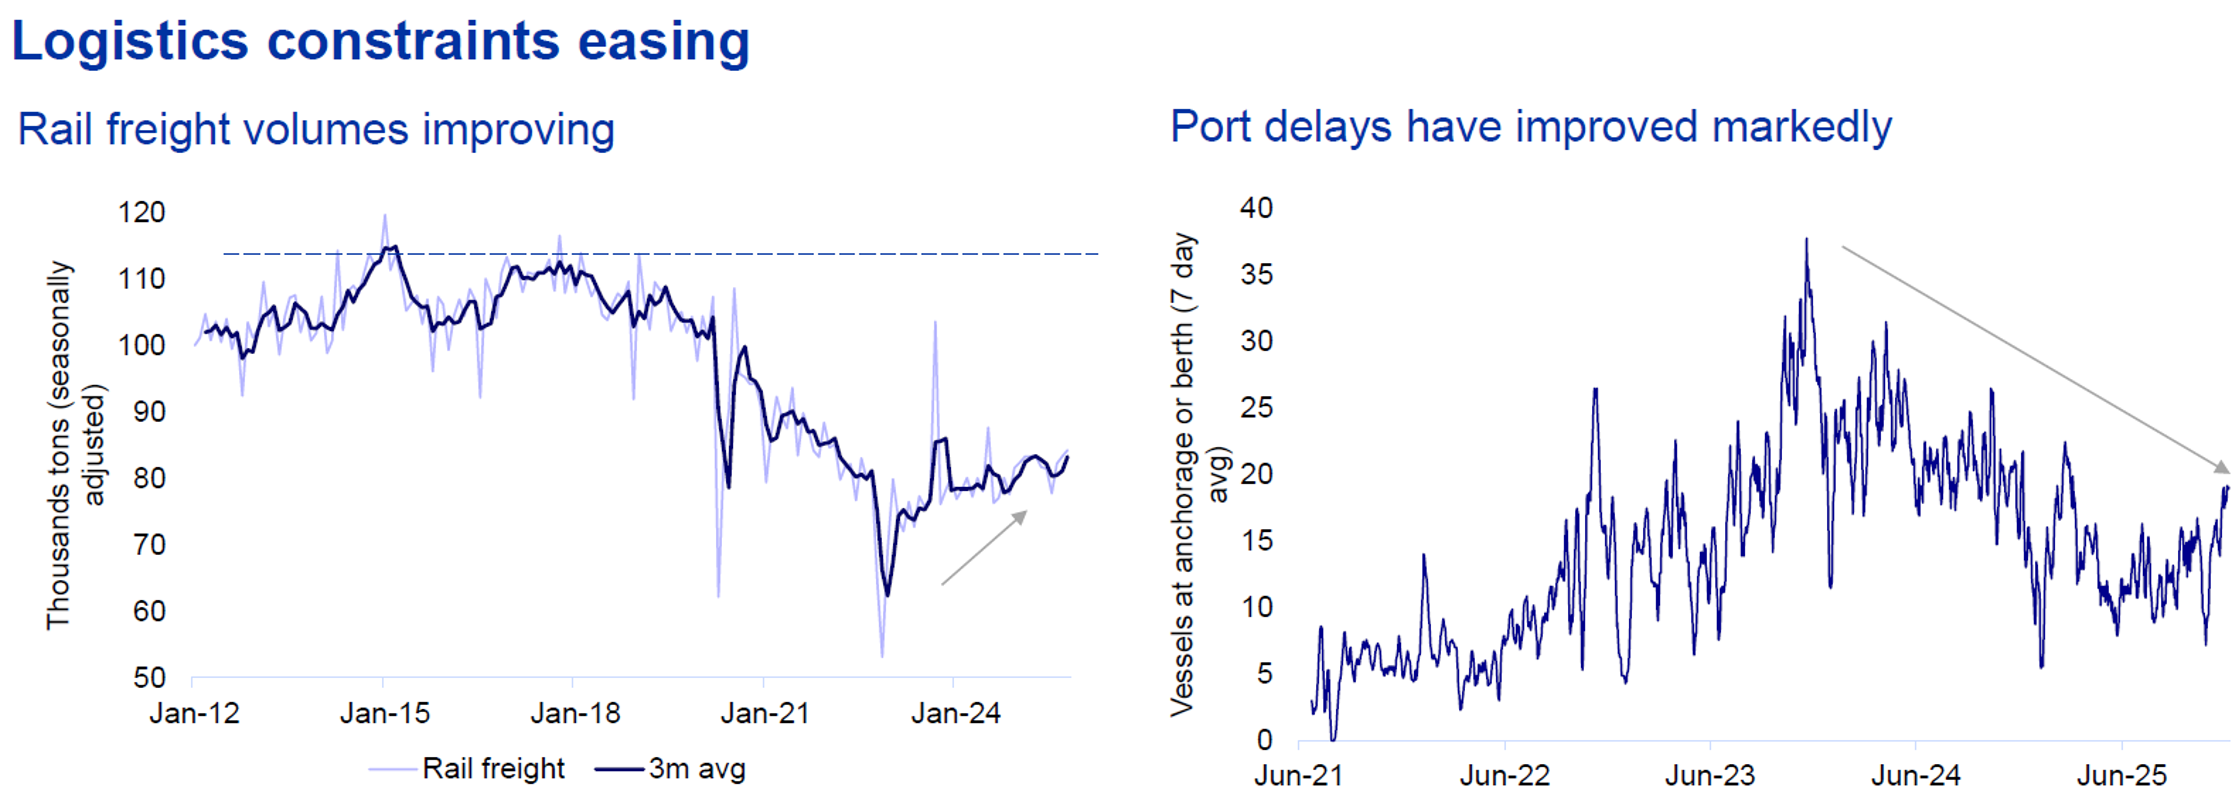
Eskom’s recovery has been a cornerstone of this shift, reporting its first annual profit since 2017 in the 2025 financial year. This was followed by a 36% improvement in interim net profits, with guidance suggesting a flat profit result for 2026. Operationally, the Energy Availability Factor (EAF) reached 69% in December 2025, up from 56% a year prior, providing the energy security required for corporate capital expenditure growth.
Transnet continued its own turnaround trajectory, announcing a further increase in interim rail volumes after recording their first year of growth since 2017. Encouragingly, September 2025’s 14.8 million tons (mt) in volume hauled was the largest monthly number since 2022.
This next year could be a watershed year:
- ICTSI, the world’s largest independent port operator, will take over the running of the Durban Pier 2 asset.
- South African train operator Traxtion has announced a R3.4bn transaction to acquire train sets to operate on the local rail network.
- We await the release of both the private sector participation document and the Network Statement, which are expected to fast track investment.
A Sturdy Fiscal & Monetary Foundation Resetting Expectations
In the last quarter of 2025, we saw the macro-economic dominoes begin to align for South Africa; with more green shoots permeating the investment landscape. We are no longer trading on the hope of reform; we are trading on the empirical evidence of a recovering macro-fiscal framework.
The South African Treasury further enhanced its reputation with the delivery of a fiscally responsible Medium-Term Budget Policy Statement.
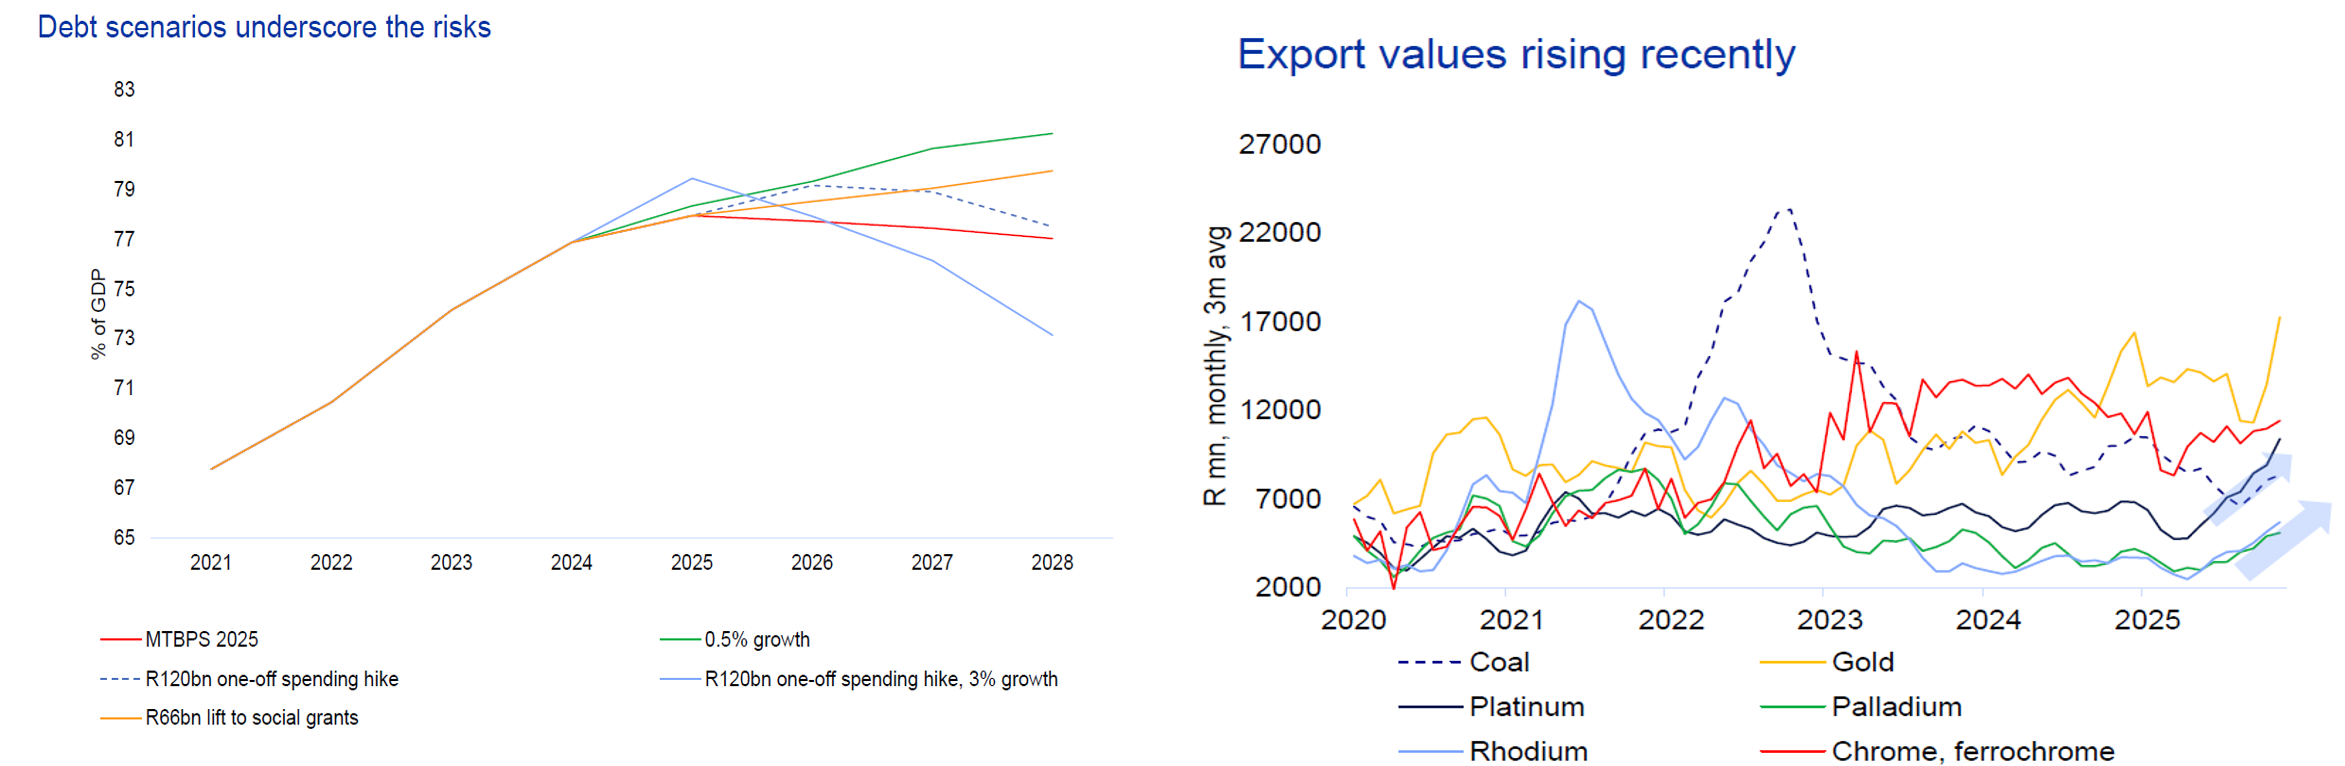
- On the back of the precious metals rally, analysts expect an additional R40bn-R50bn into the sovereign coffers this year, relative to last year.
- Public debt to GDP looks to have peaked after ascending since 2008.
- The inflation target has been lowered, a bullish outcome for the economy going forward.
- Realized inflation is forecast to remain benign into the medium term, leading to expectations of further rate cuts this year.
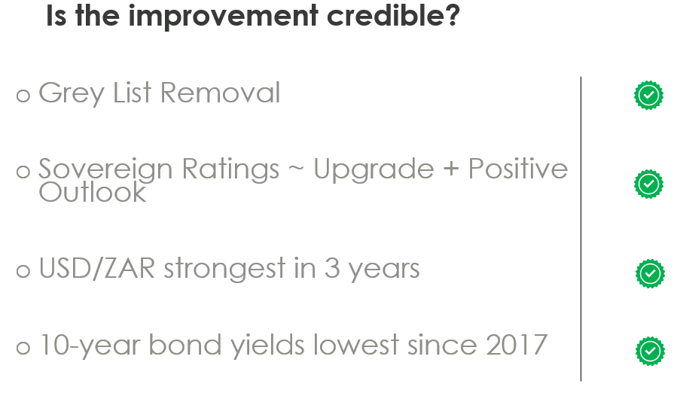
In recognition of the structural improvements to the economy, independent international bodies have begun to validate progress. The markets have also reacted positively, repricing the South African economy to reflect improving sentiment.
Investment Spending: Loading Up For Deployment
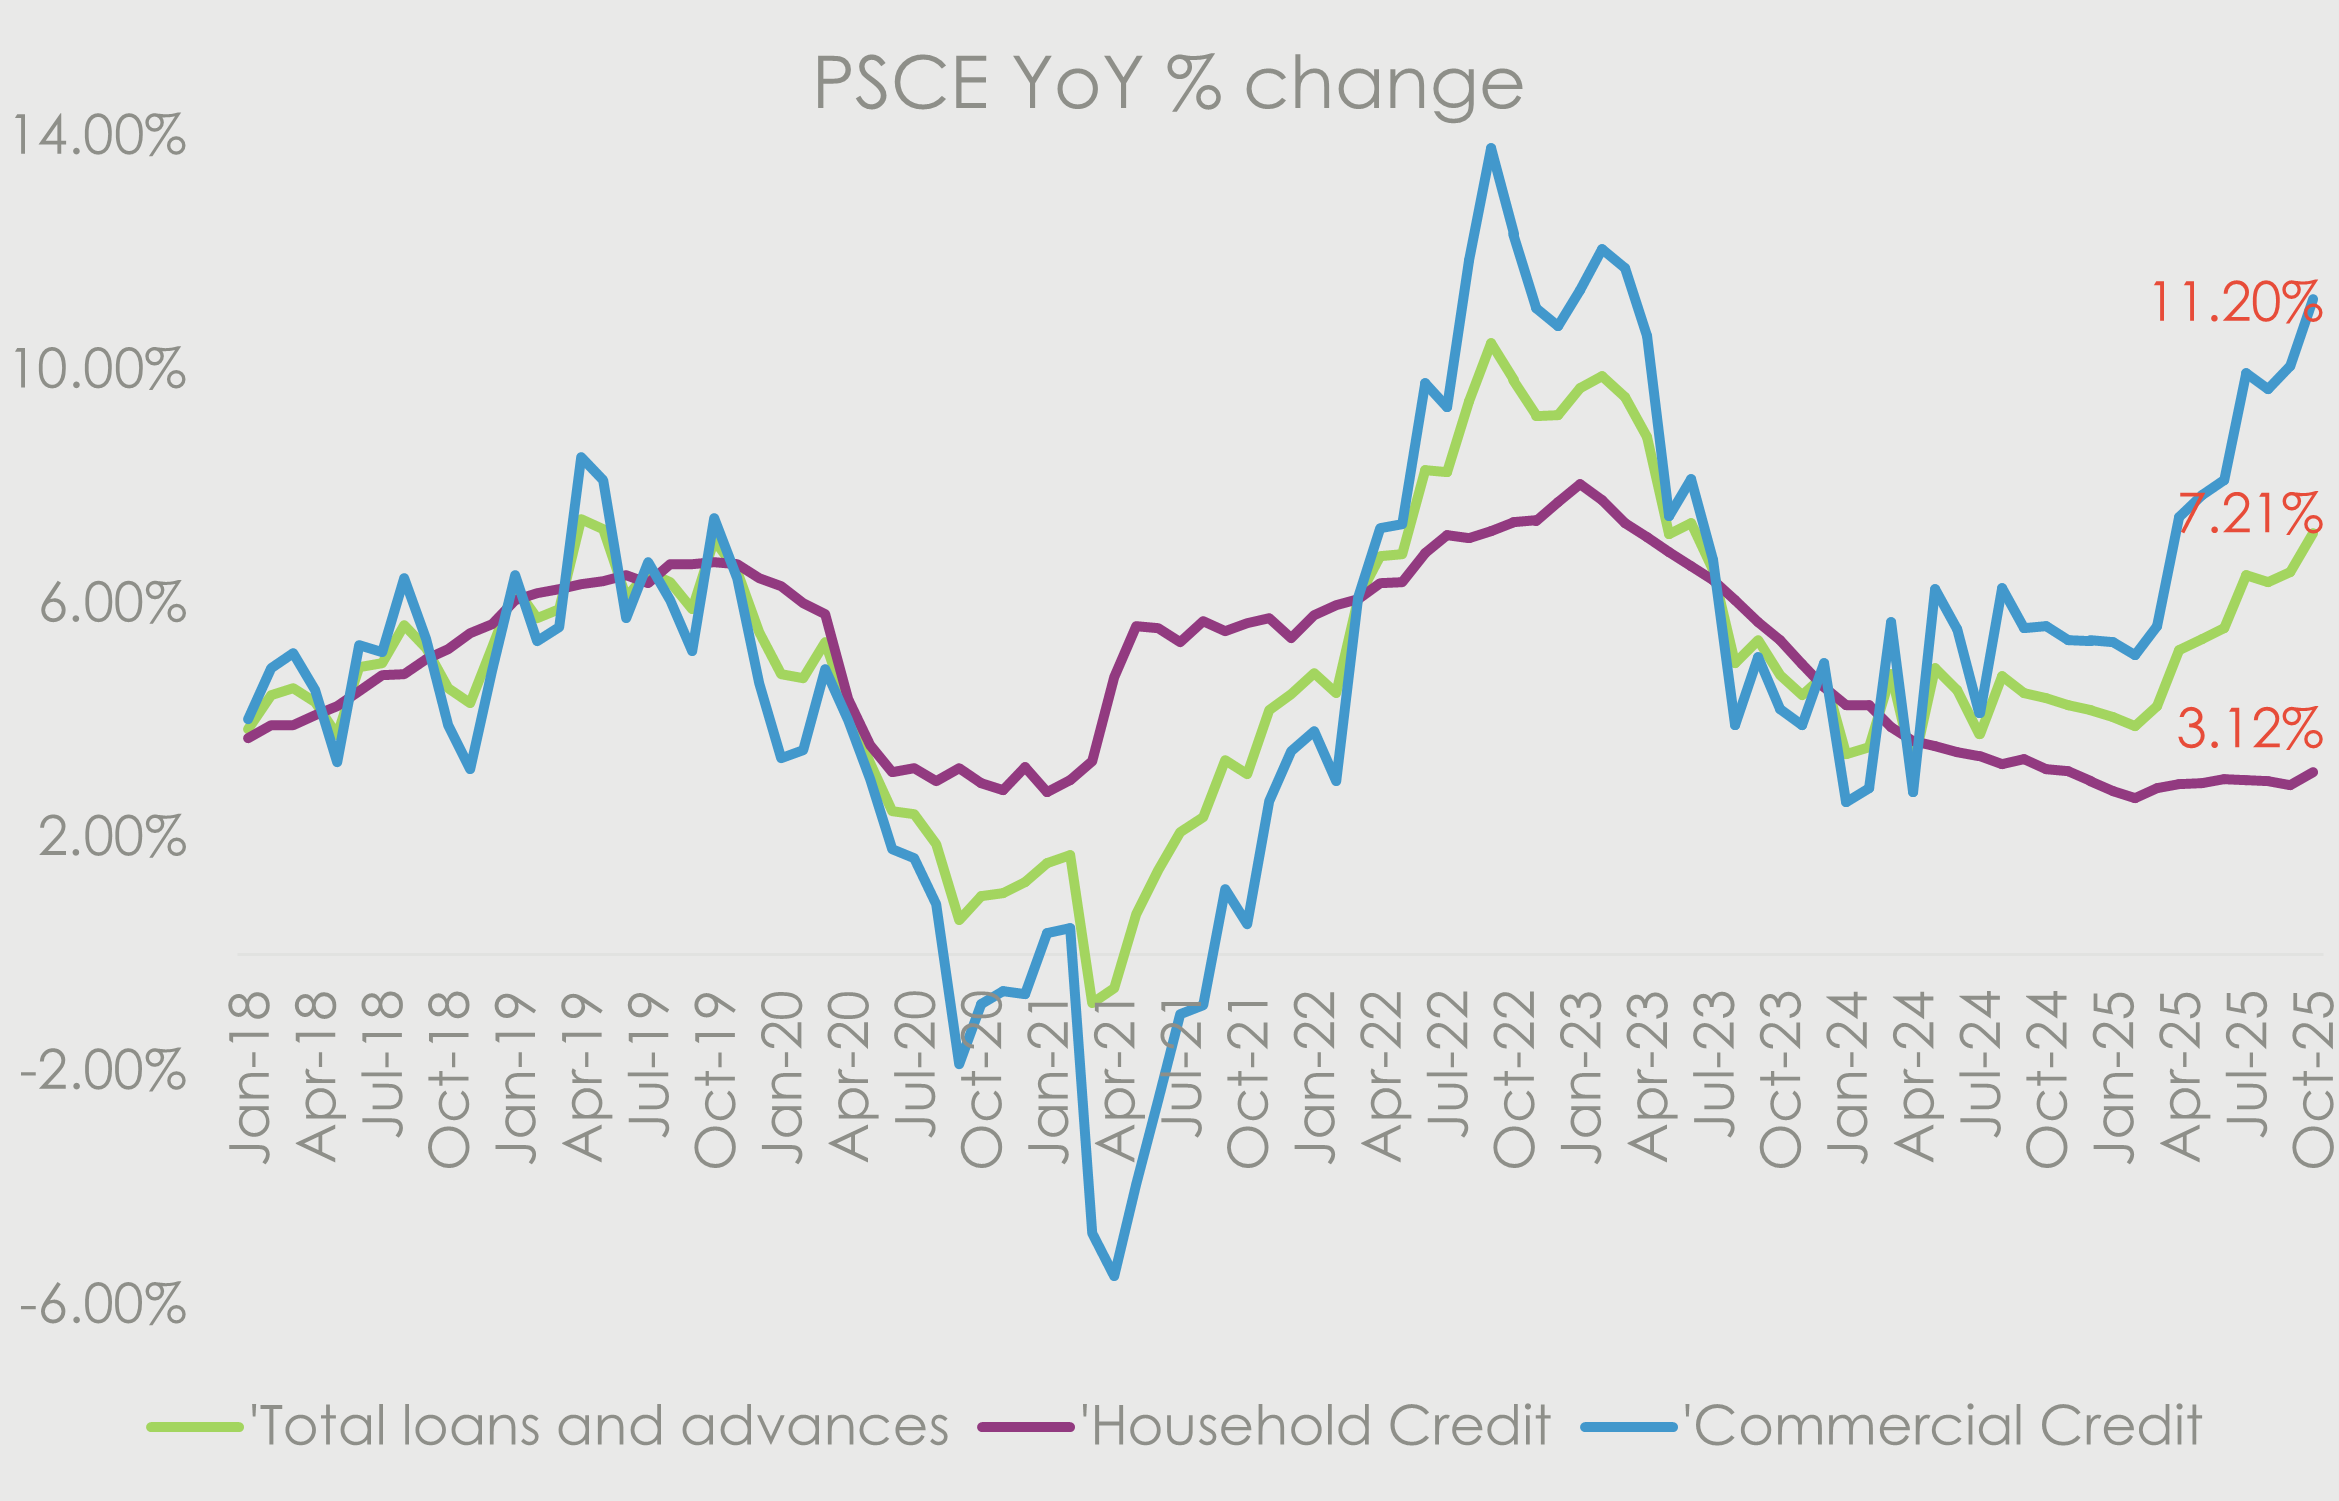
Turning to the prospects for investment, we remain constructive for 2026. Credit extension to corporates has been going from strength to strength all year, with each month stronger than the last. Machinery imports have been relatively robust into year-end, though not yet at levels that are supportive of capital formation growth.
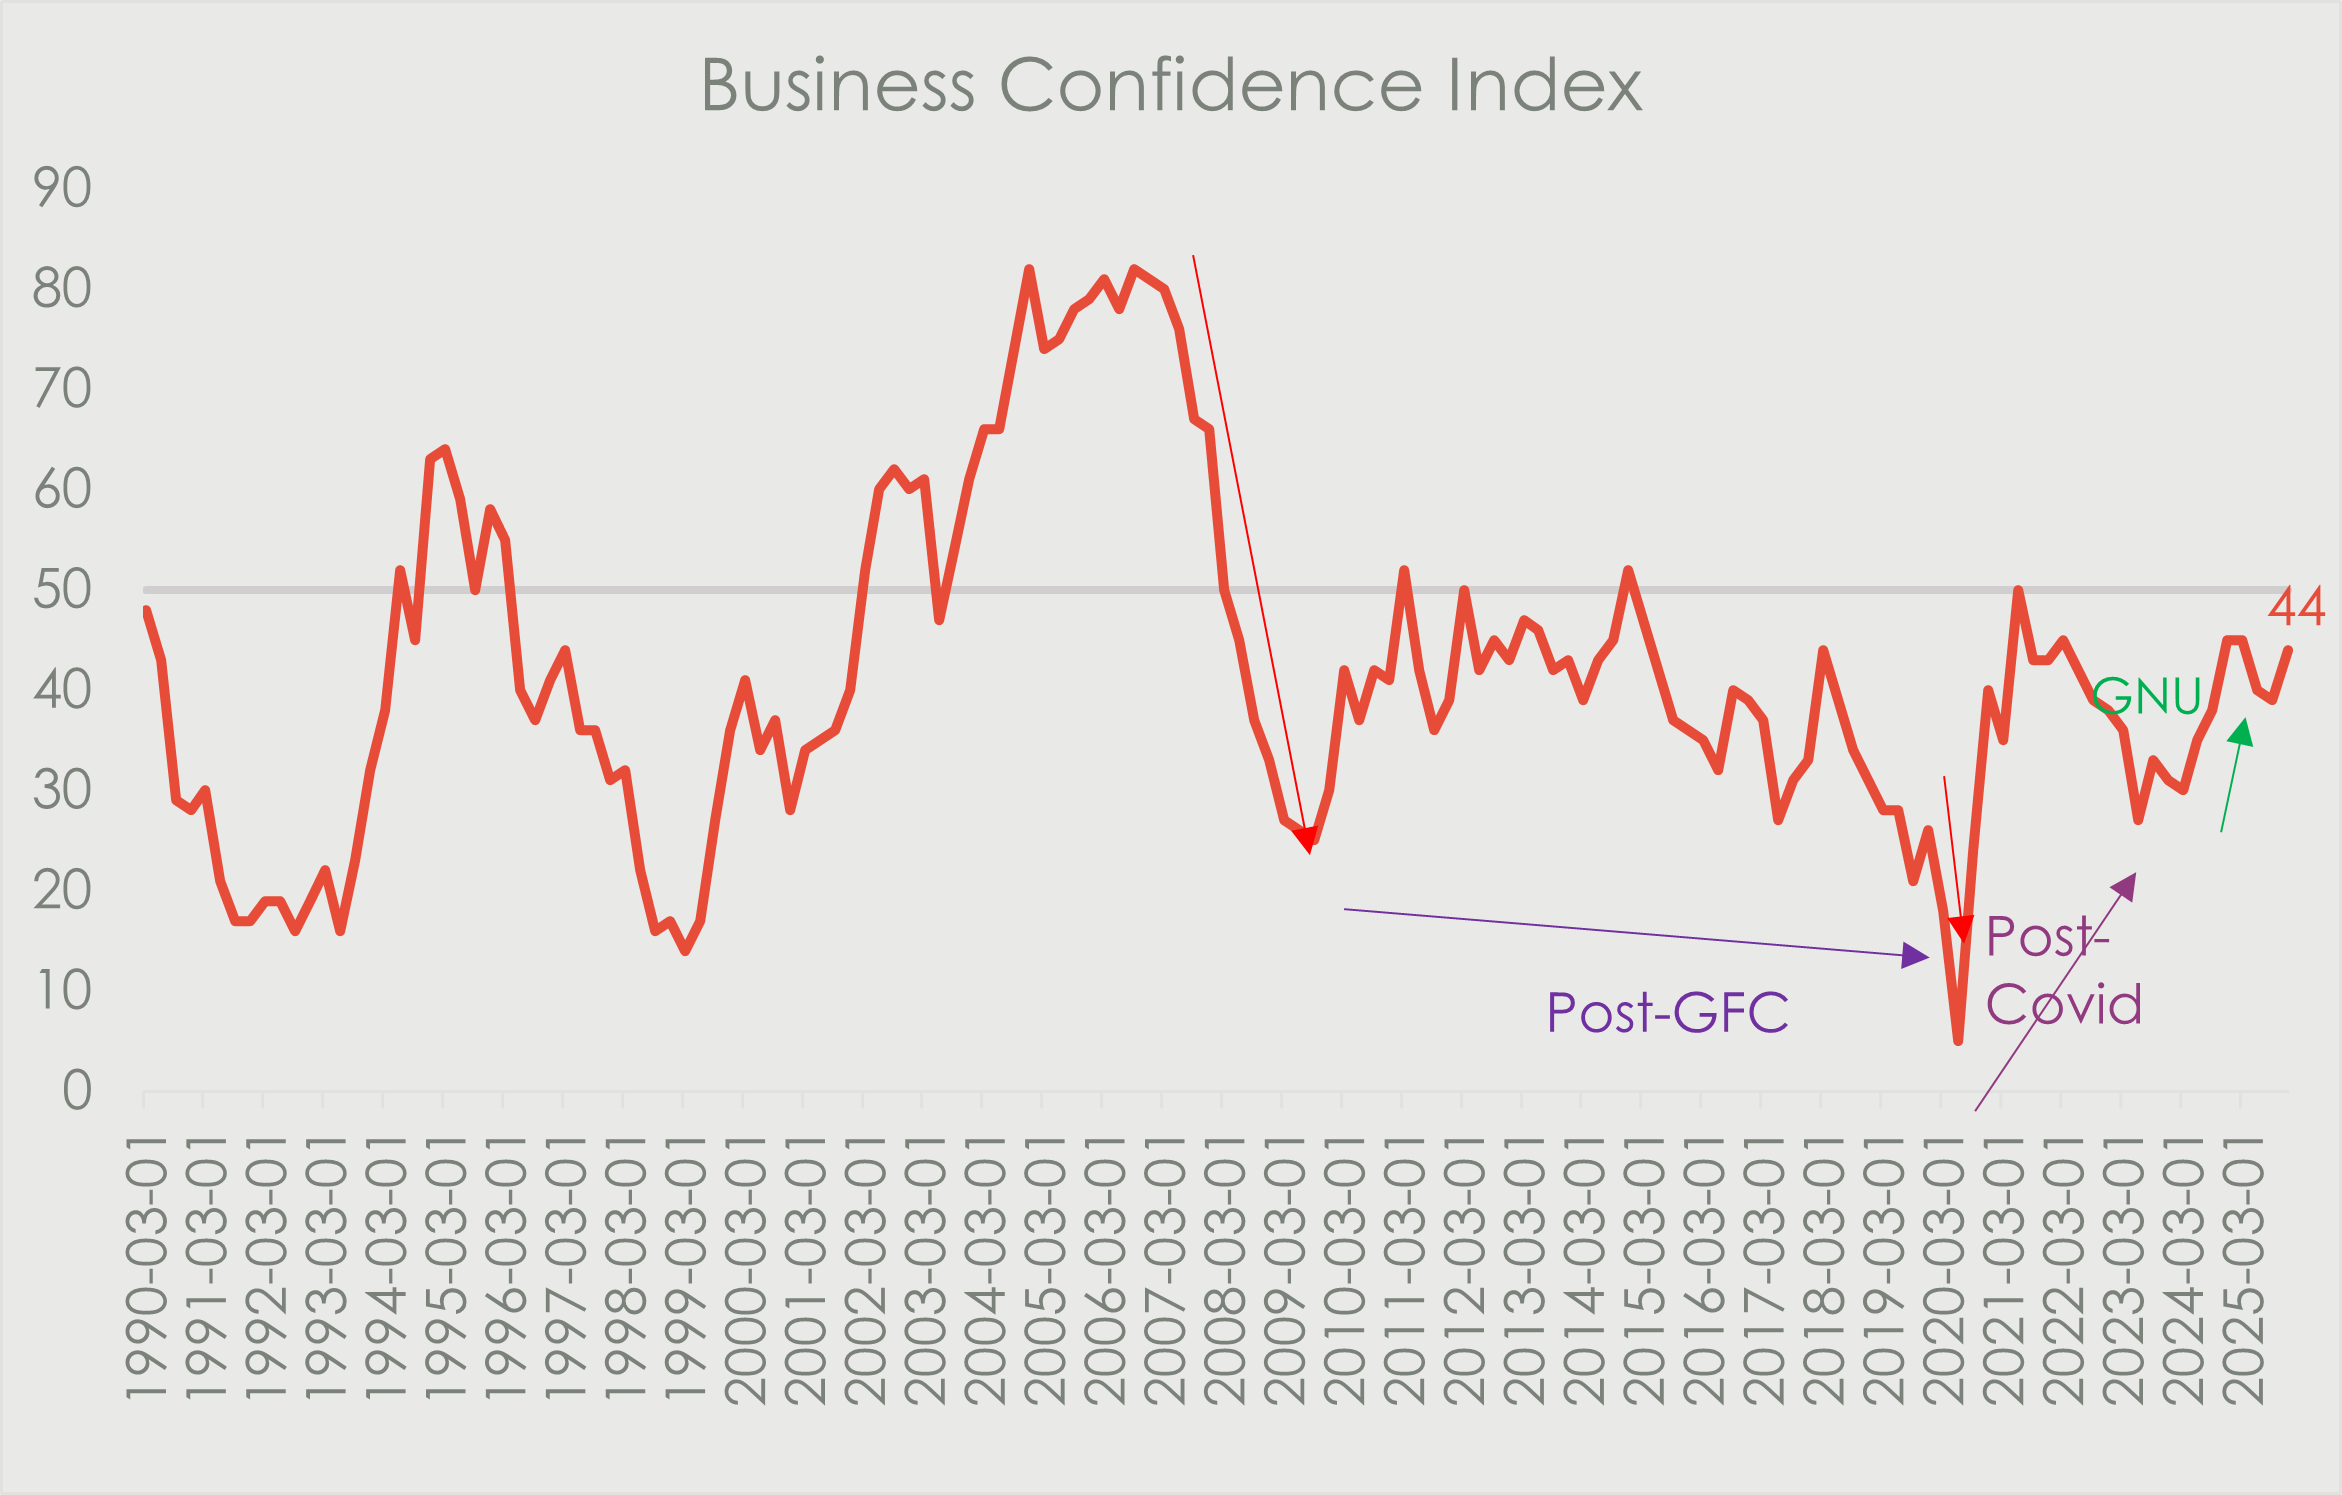
Business Confidence started the year on a downtrend but spiked into year-end. Though we are not yet in expansion territory, the metrics cited point to corporates’ expanding appetite for capital expenditure growth. This will be a key driver of the performance of the economy and South African assets in 2026.
A Consumer On Cruise Control After Two-Pot Sprint
The South African consumer has enough support to remain stable. As we cycle the post two-pot festive season, high base effects mask the reality of a consumer on solid footing.
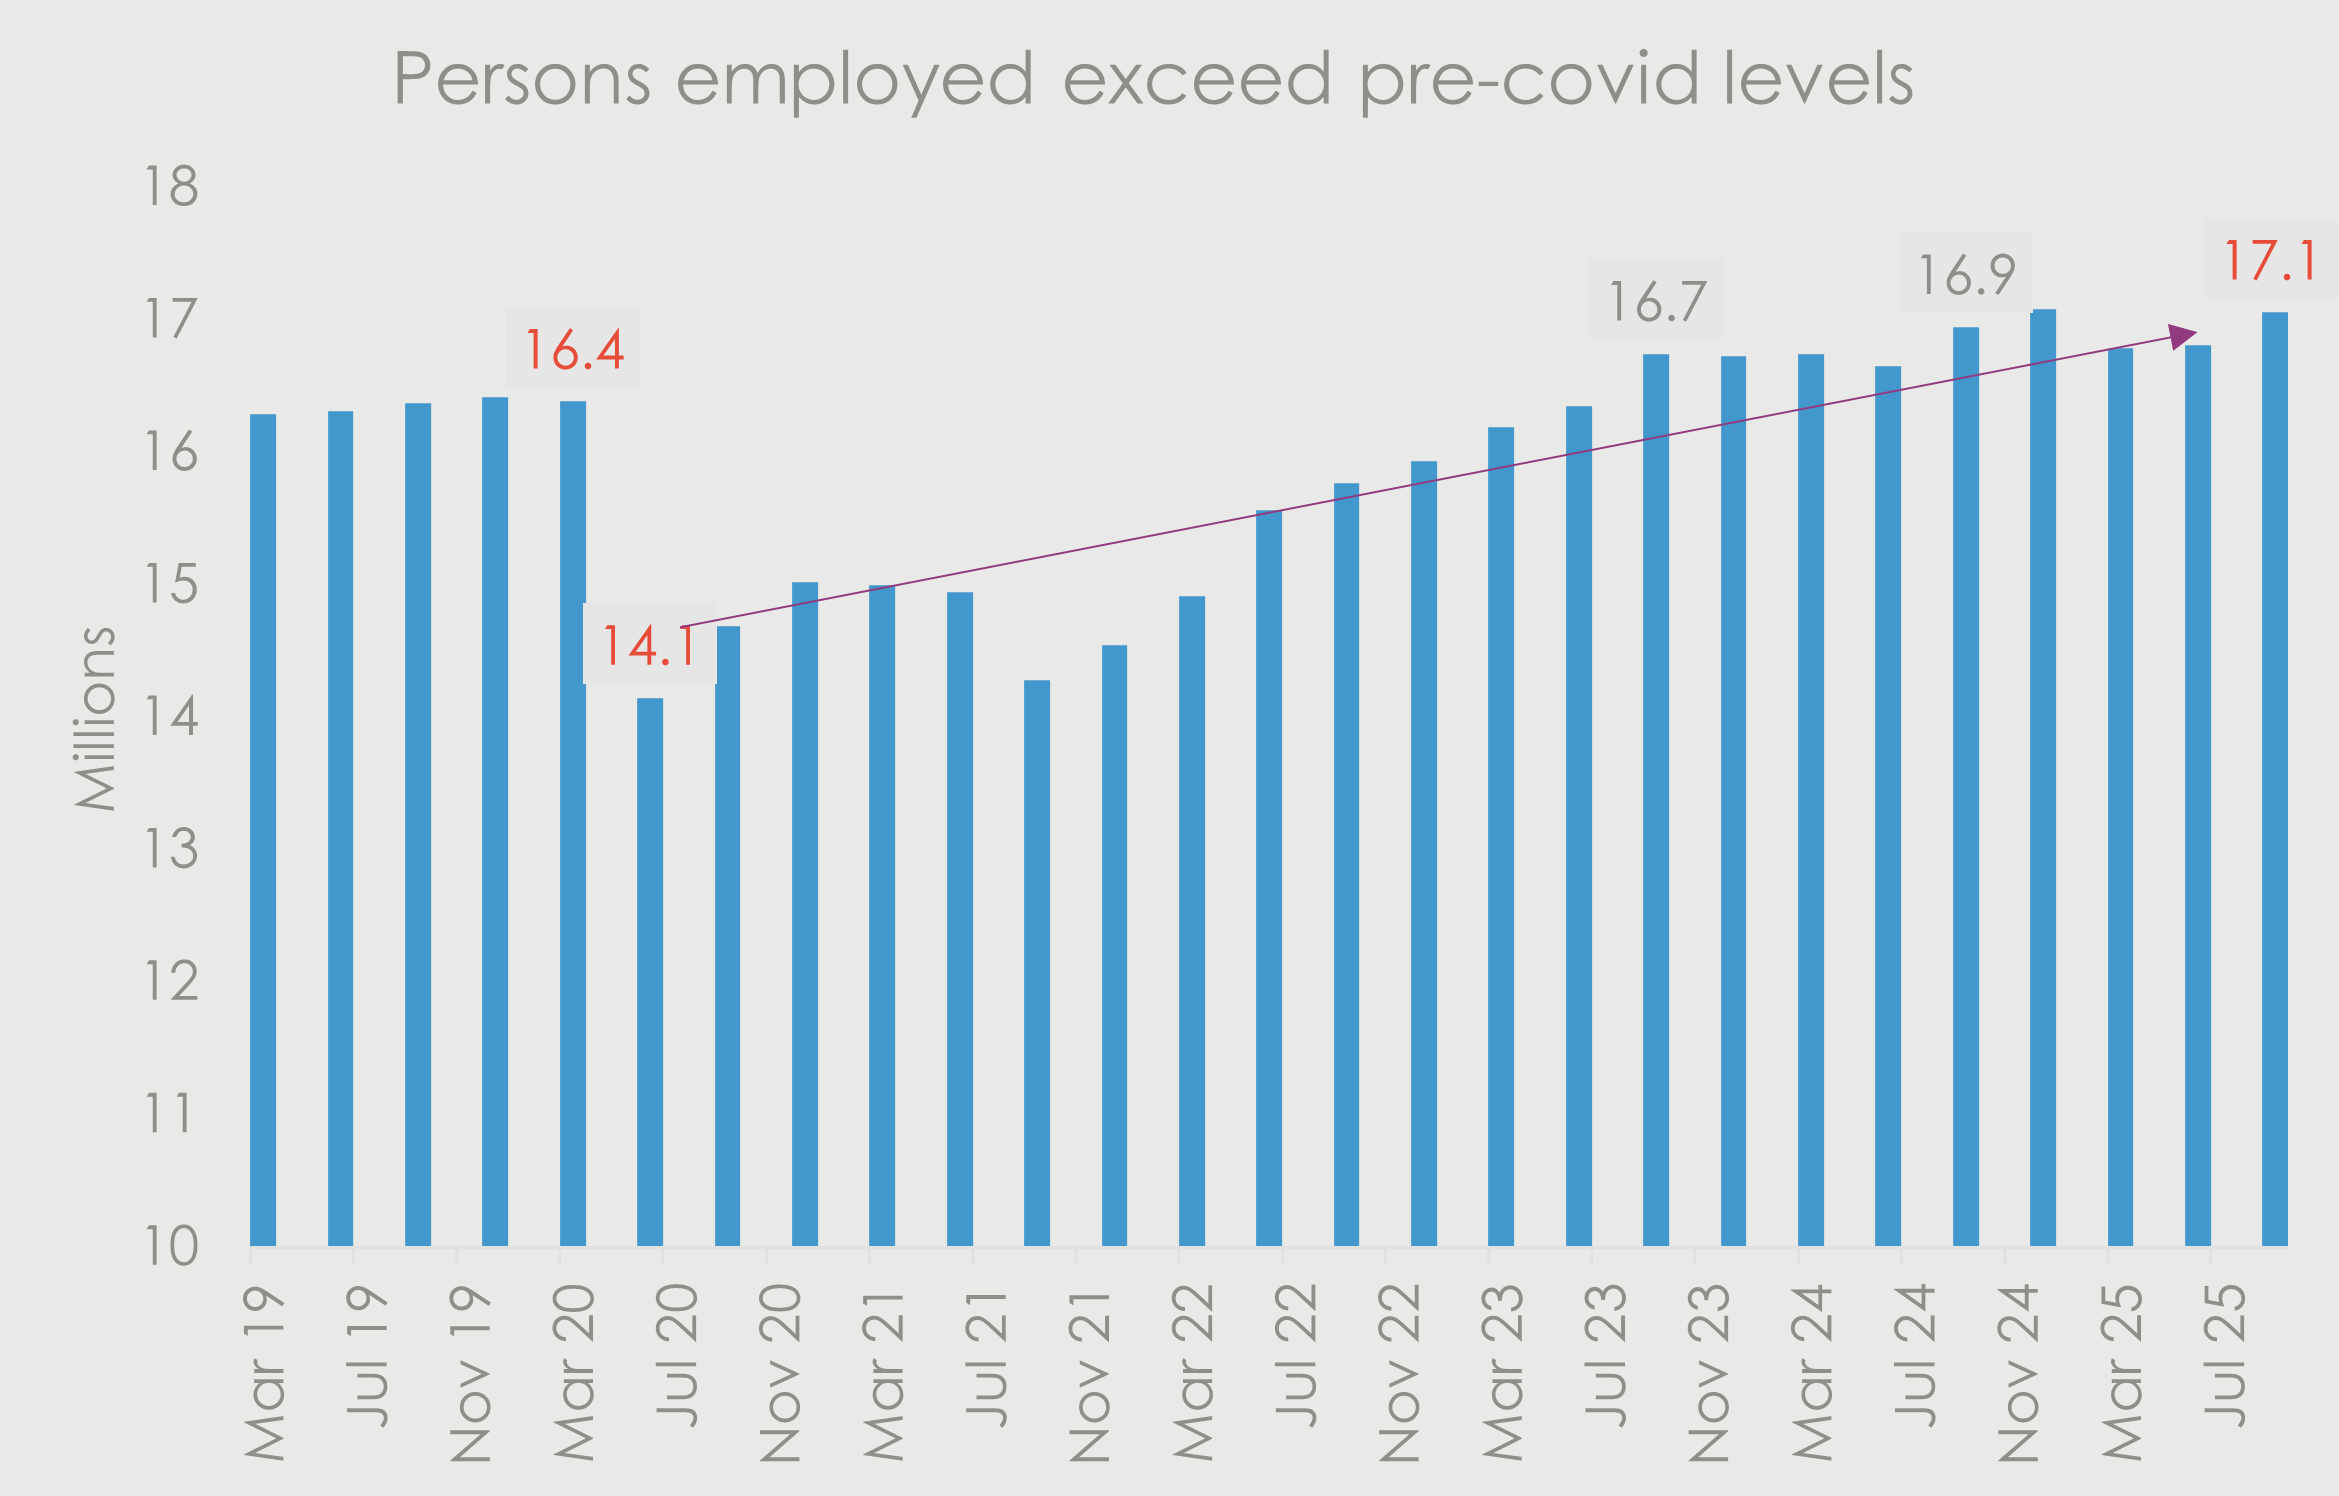
- The employment and real wage picture is solid.
- Credit health is improving, aided by deleveraging and rate cuts.
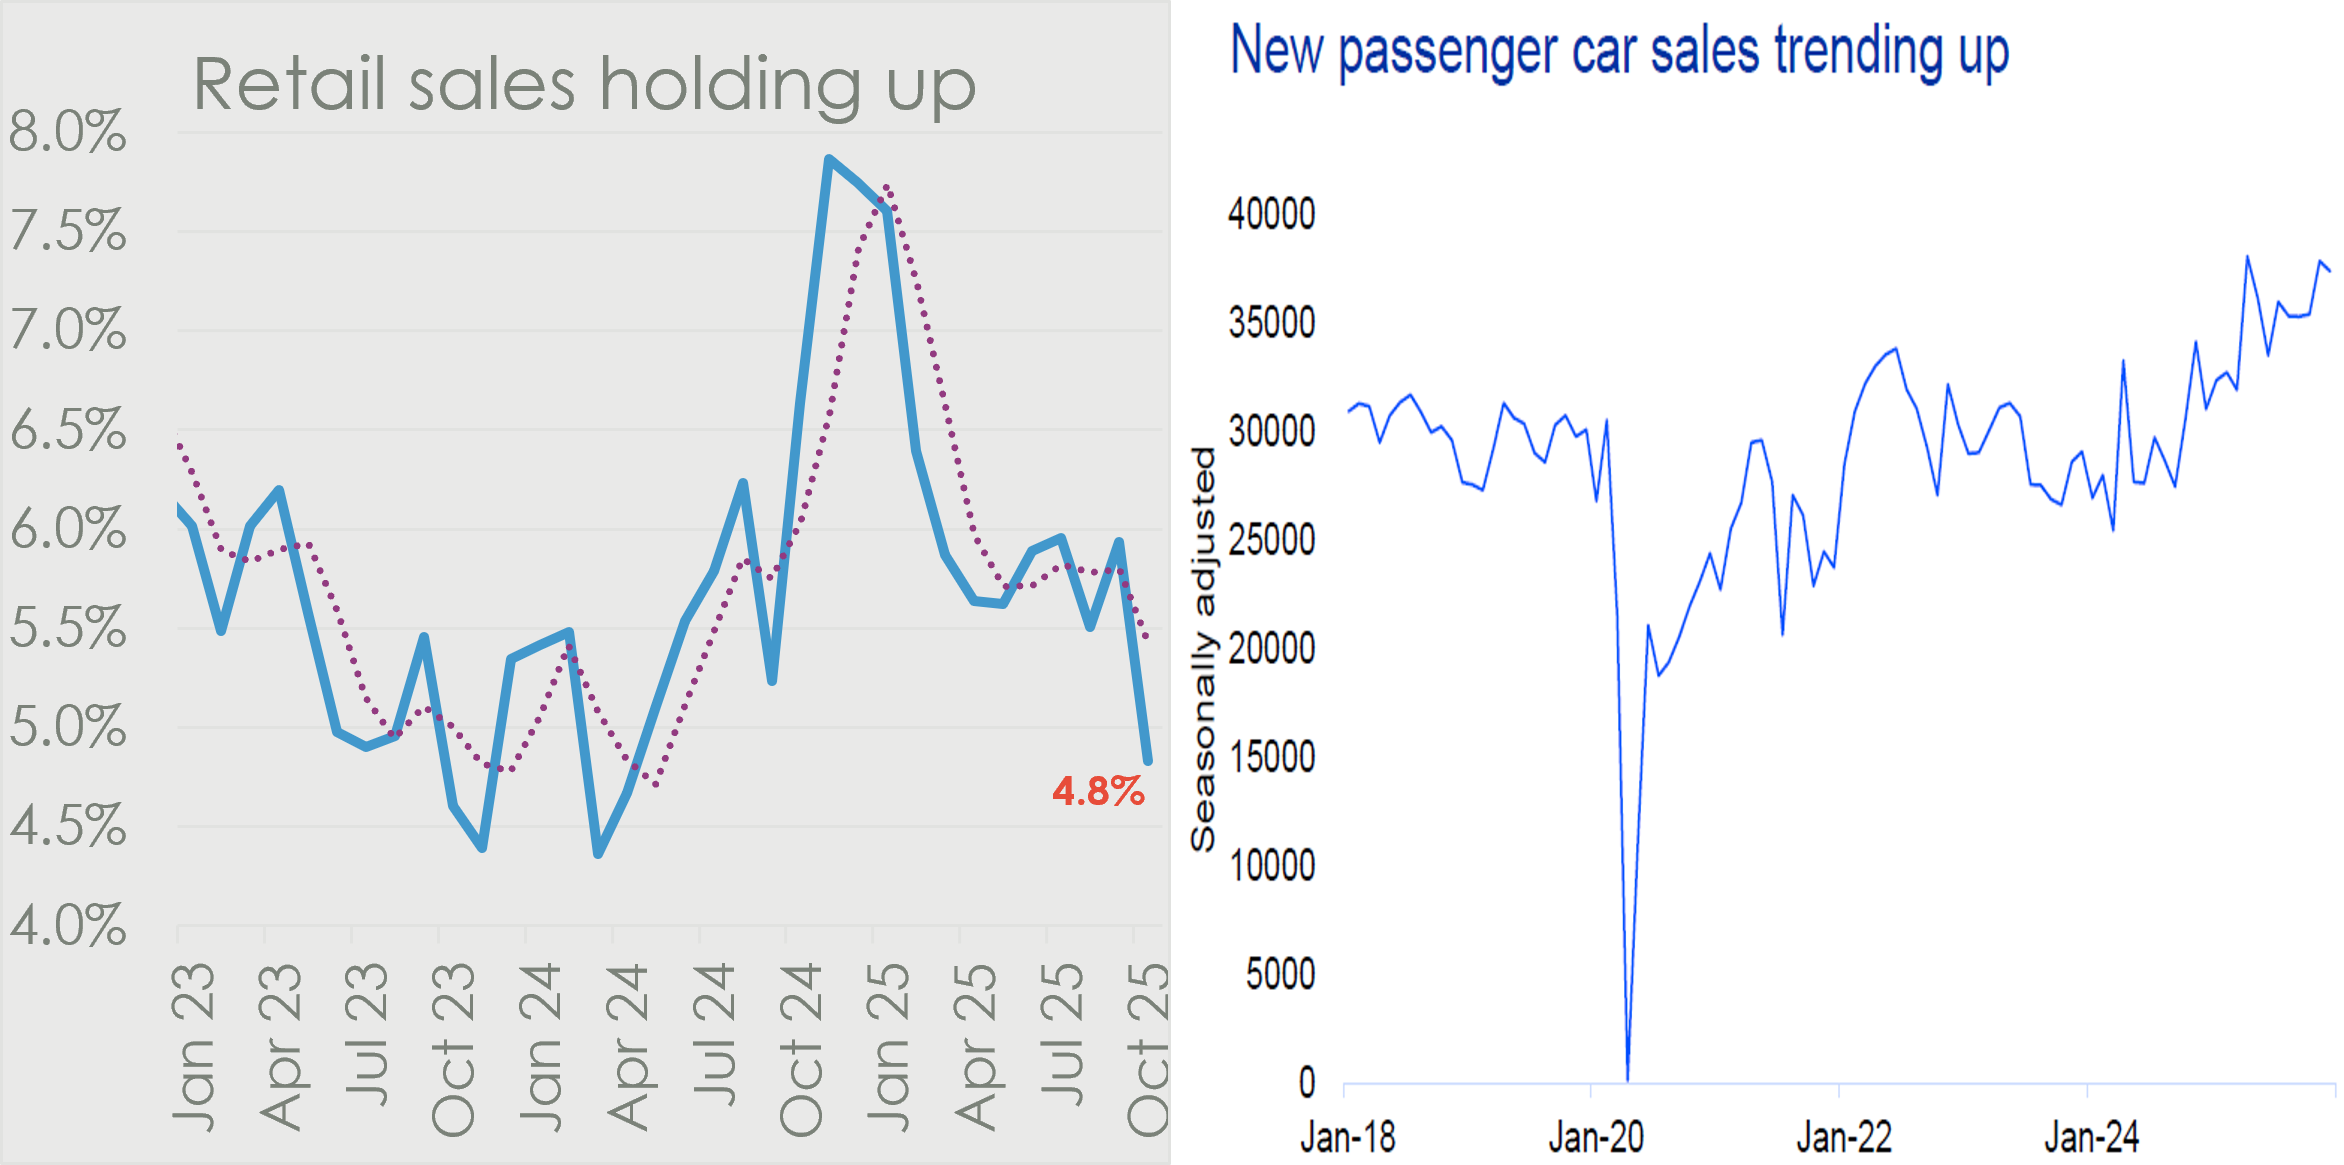
Consumer spending has held up well, with pockets of strength in the more interest-rate sensitive, durable goods sectors such as vehicles.
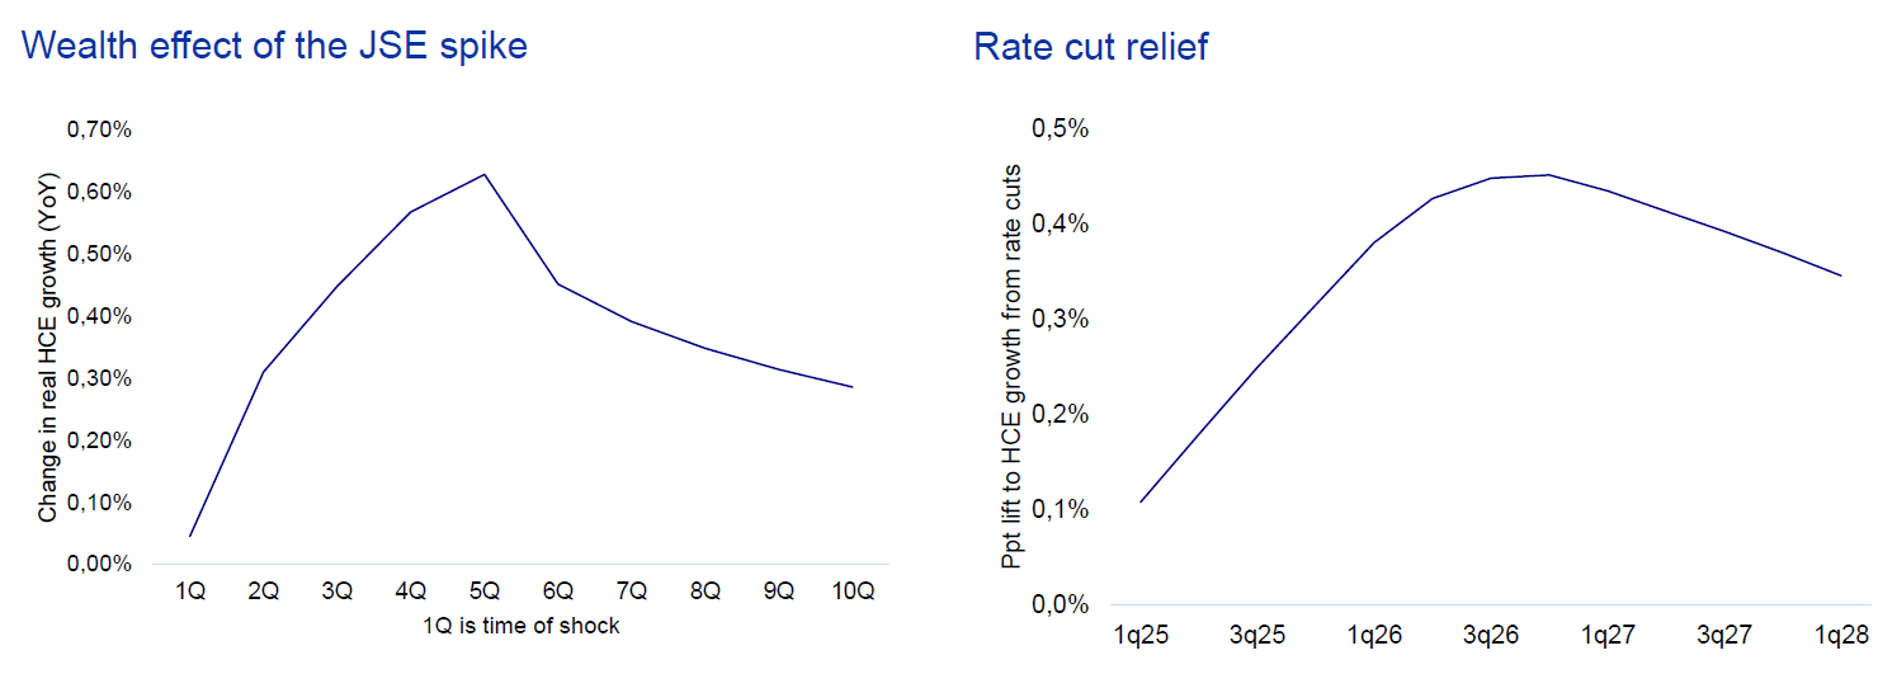
Household consumption is poised to receive further support from the wealth and income effects of the JSE performance over the last two years, as well as the seven rate cuts we have seen in this cutting cycle so far.
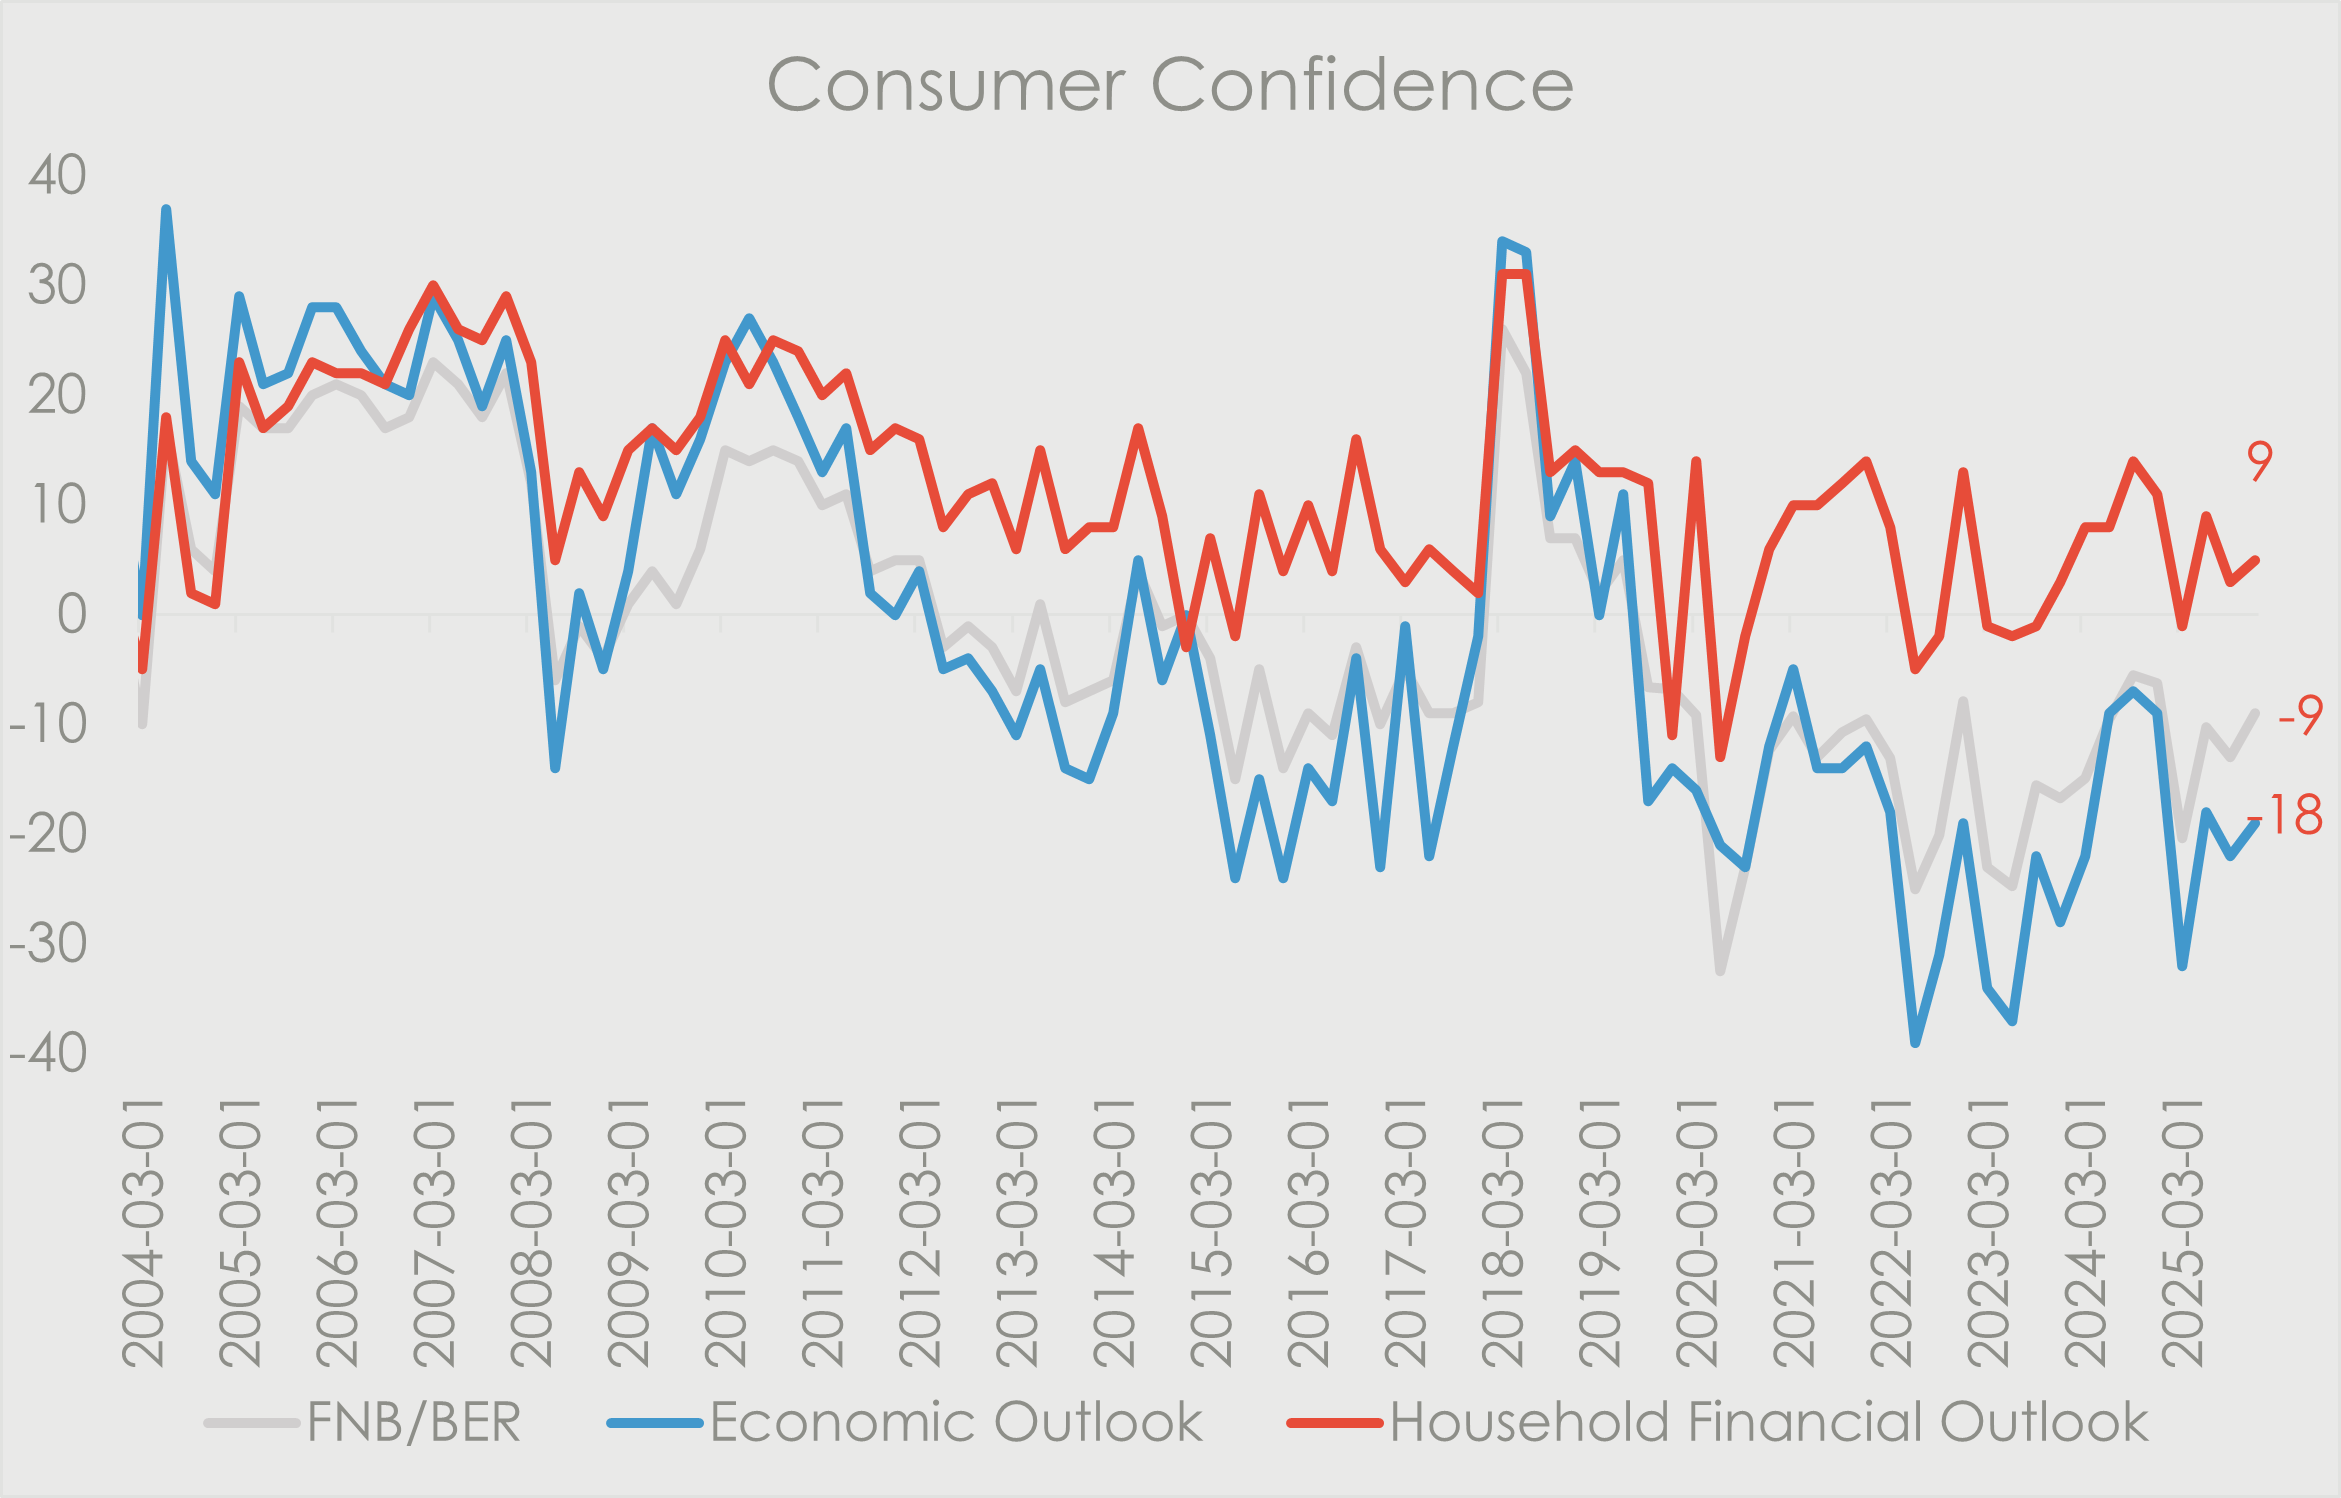
As of the second half of 2025, consumer confidence appears to be improving again after starting the year in a downtrend. We expect this trend to hold up into the new year, as the macro environment continues to ease.
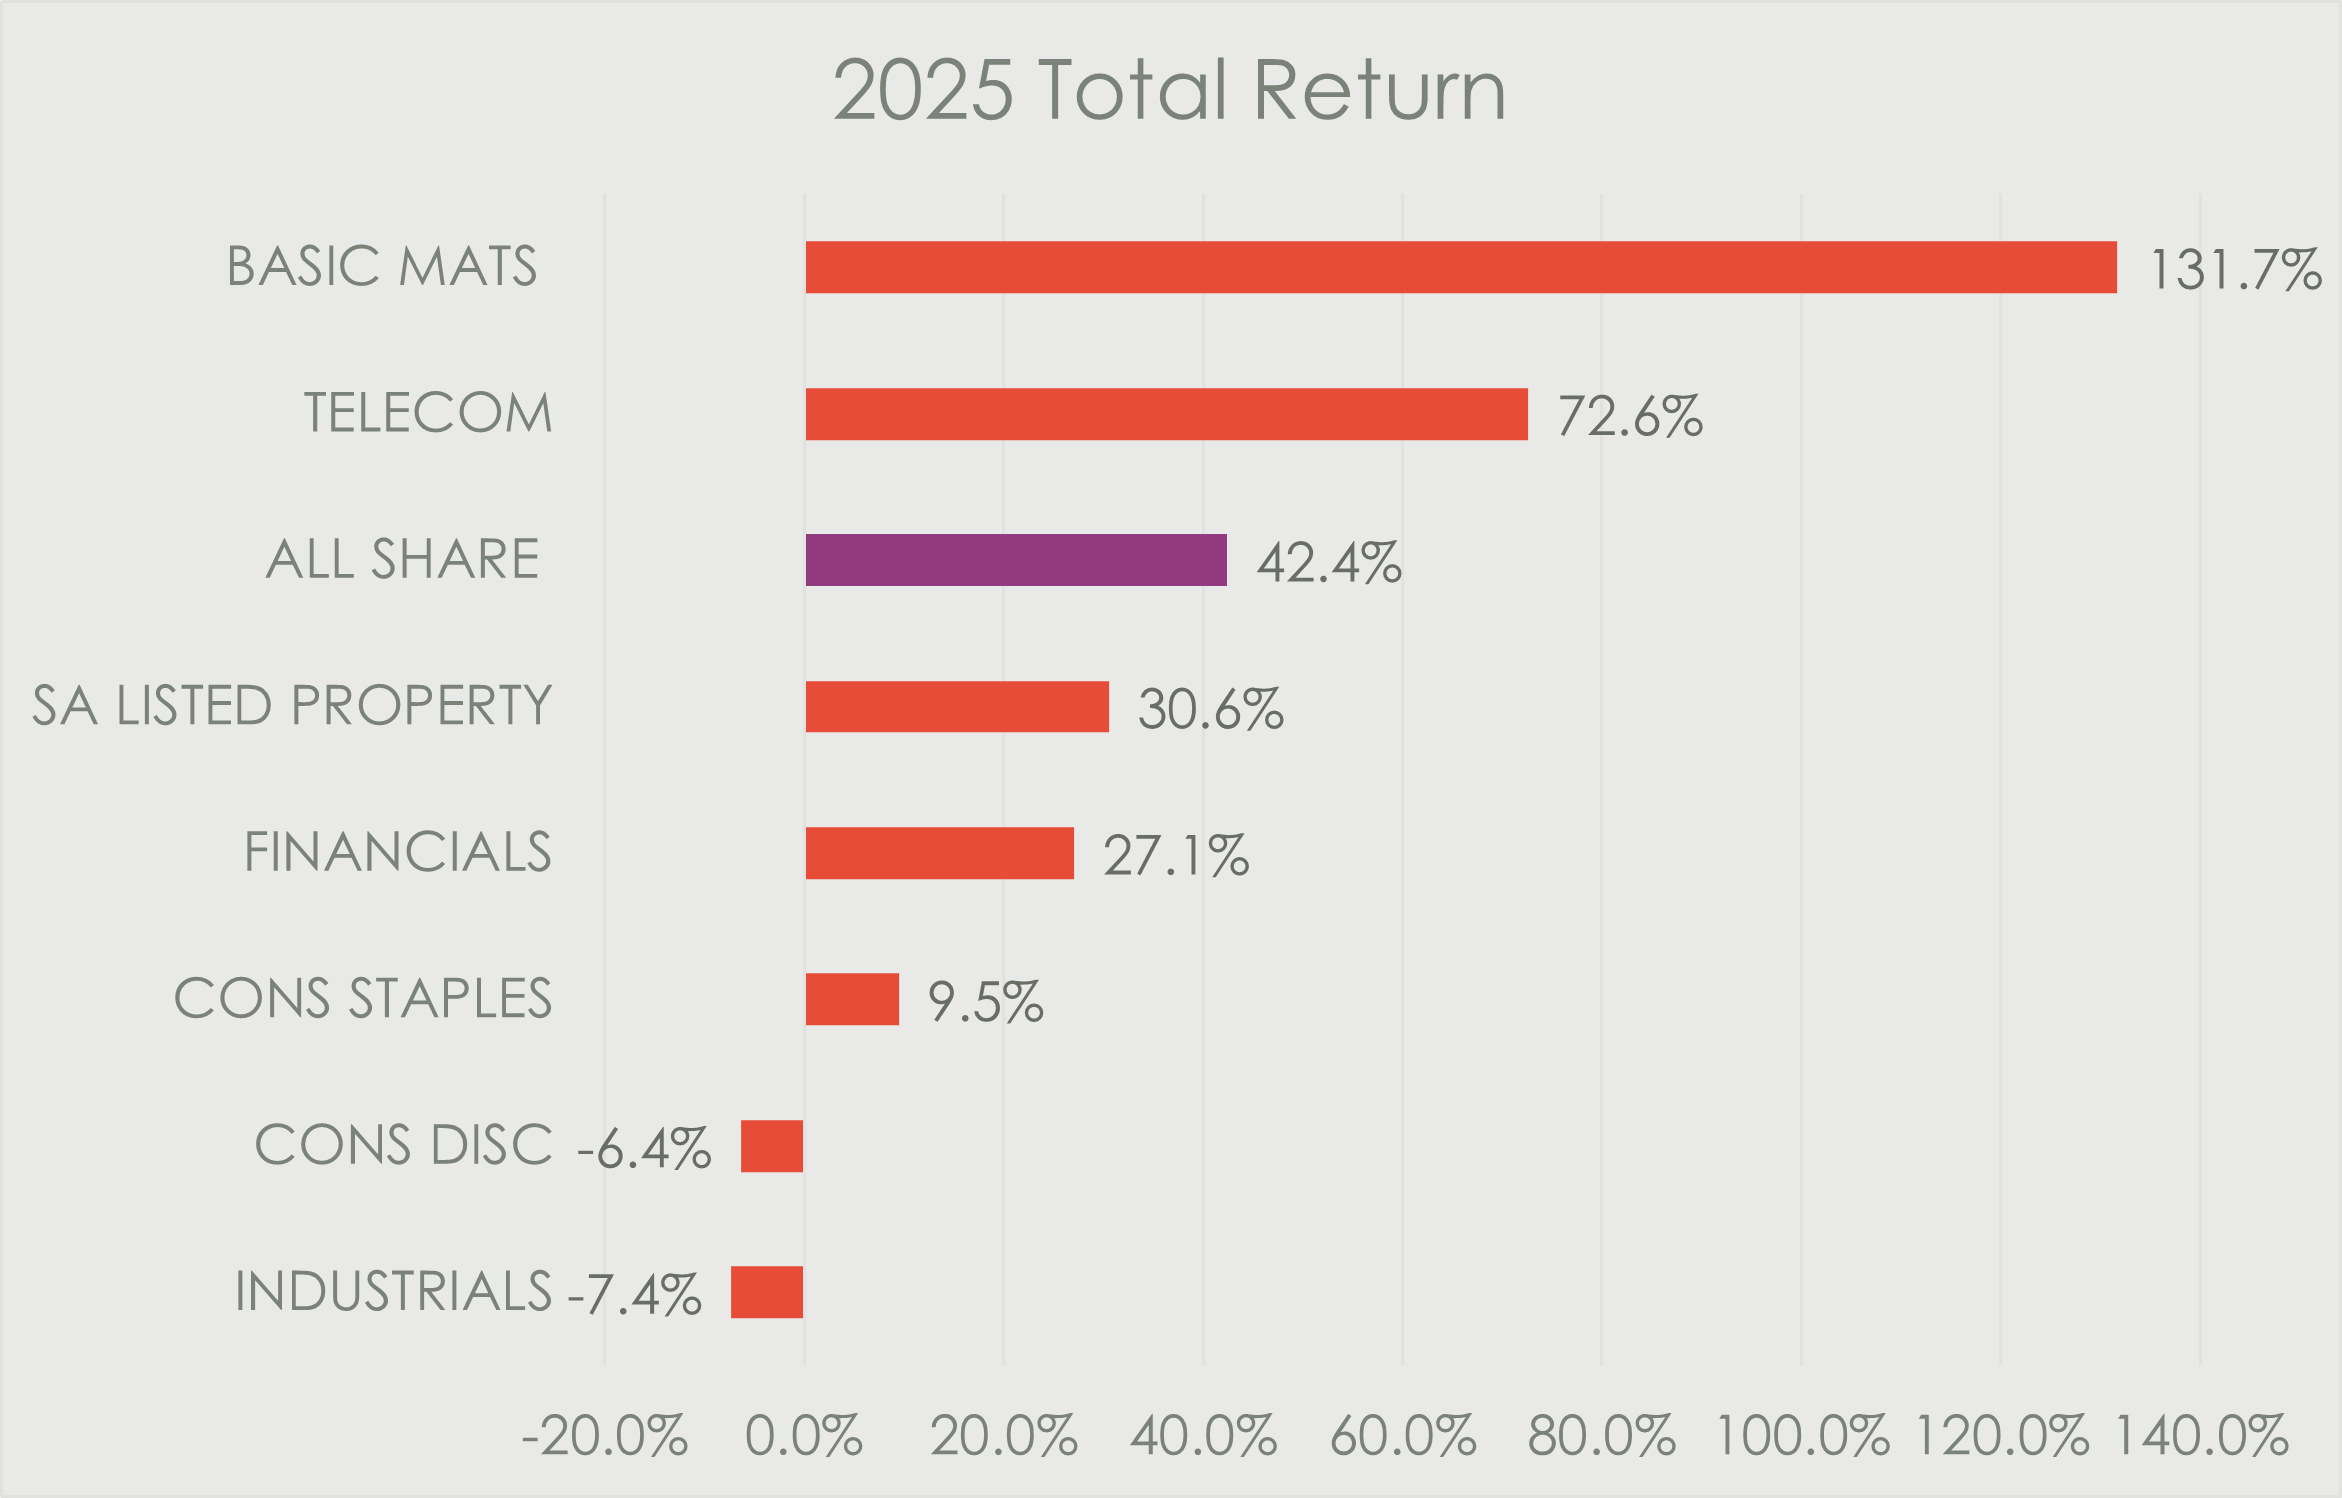
2025 Performance Breakdown
2025 was typified by a narrow rally in precious metals stocks that supported returns on the JSE. President Donald Trump came into office and immediately embarked on a chaotic foreign policy spree that upended forecasts and sentiment across markets. This uncertainty, along with a protracted budget saga in South Africa, permeated through the performance of local assets; causing a derating of multiples and earnings downgrades.
Low Valuation + Low Expectation = Opportunity
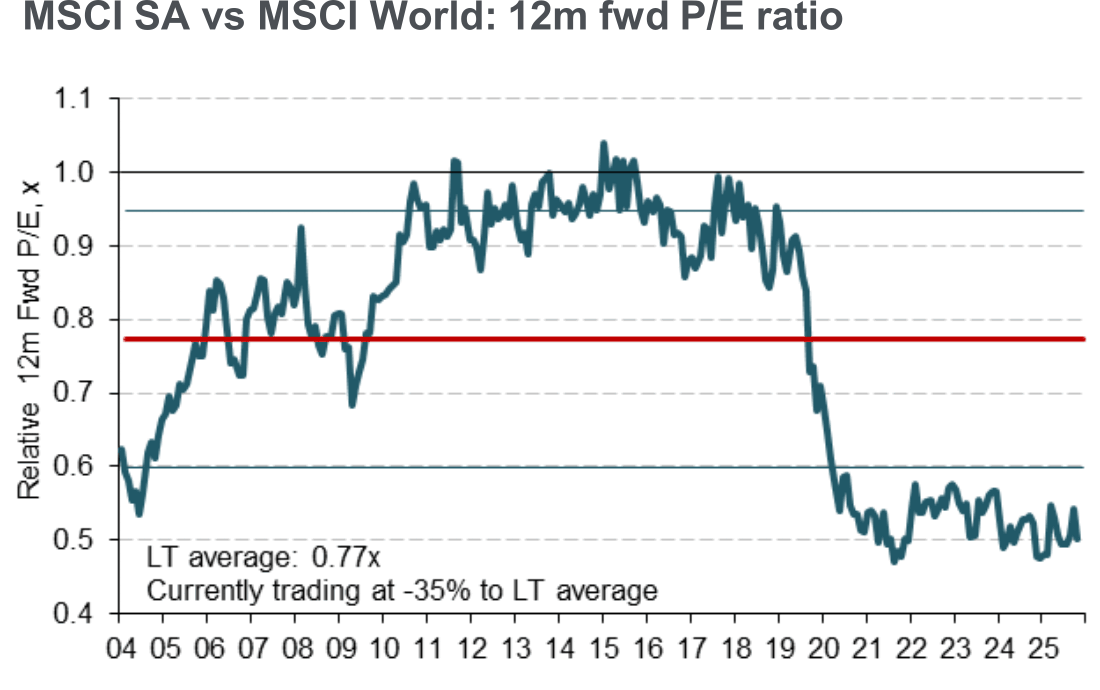
Despite outperforming emerging market peers, the JSE still screens cheap, trading at one standard deviation below the MSCI EM.
Our view is that the gradual strengthening of the underlying macro environment – outlined above – has the potential to lead to a rerating in South African assets as well as boosting earnings growth to drive total returns.
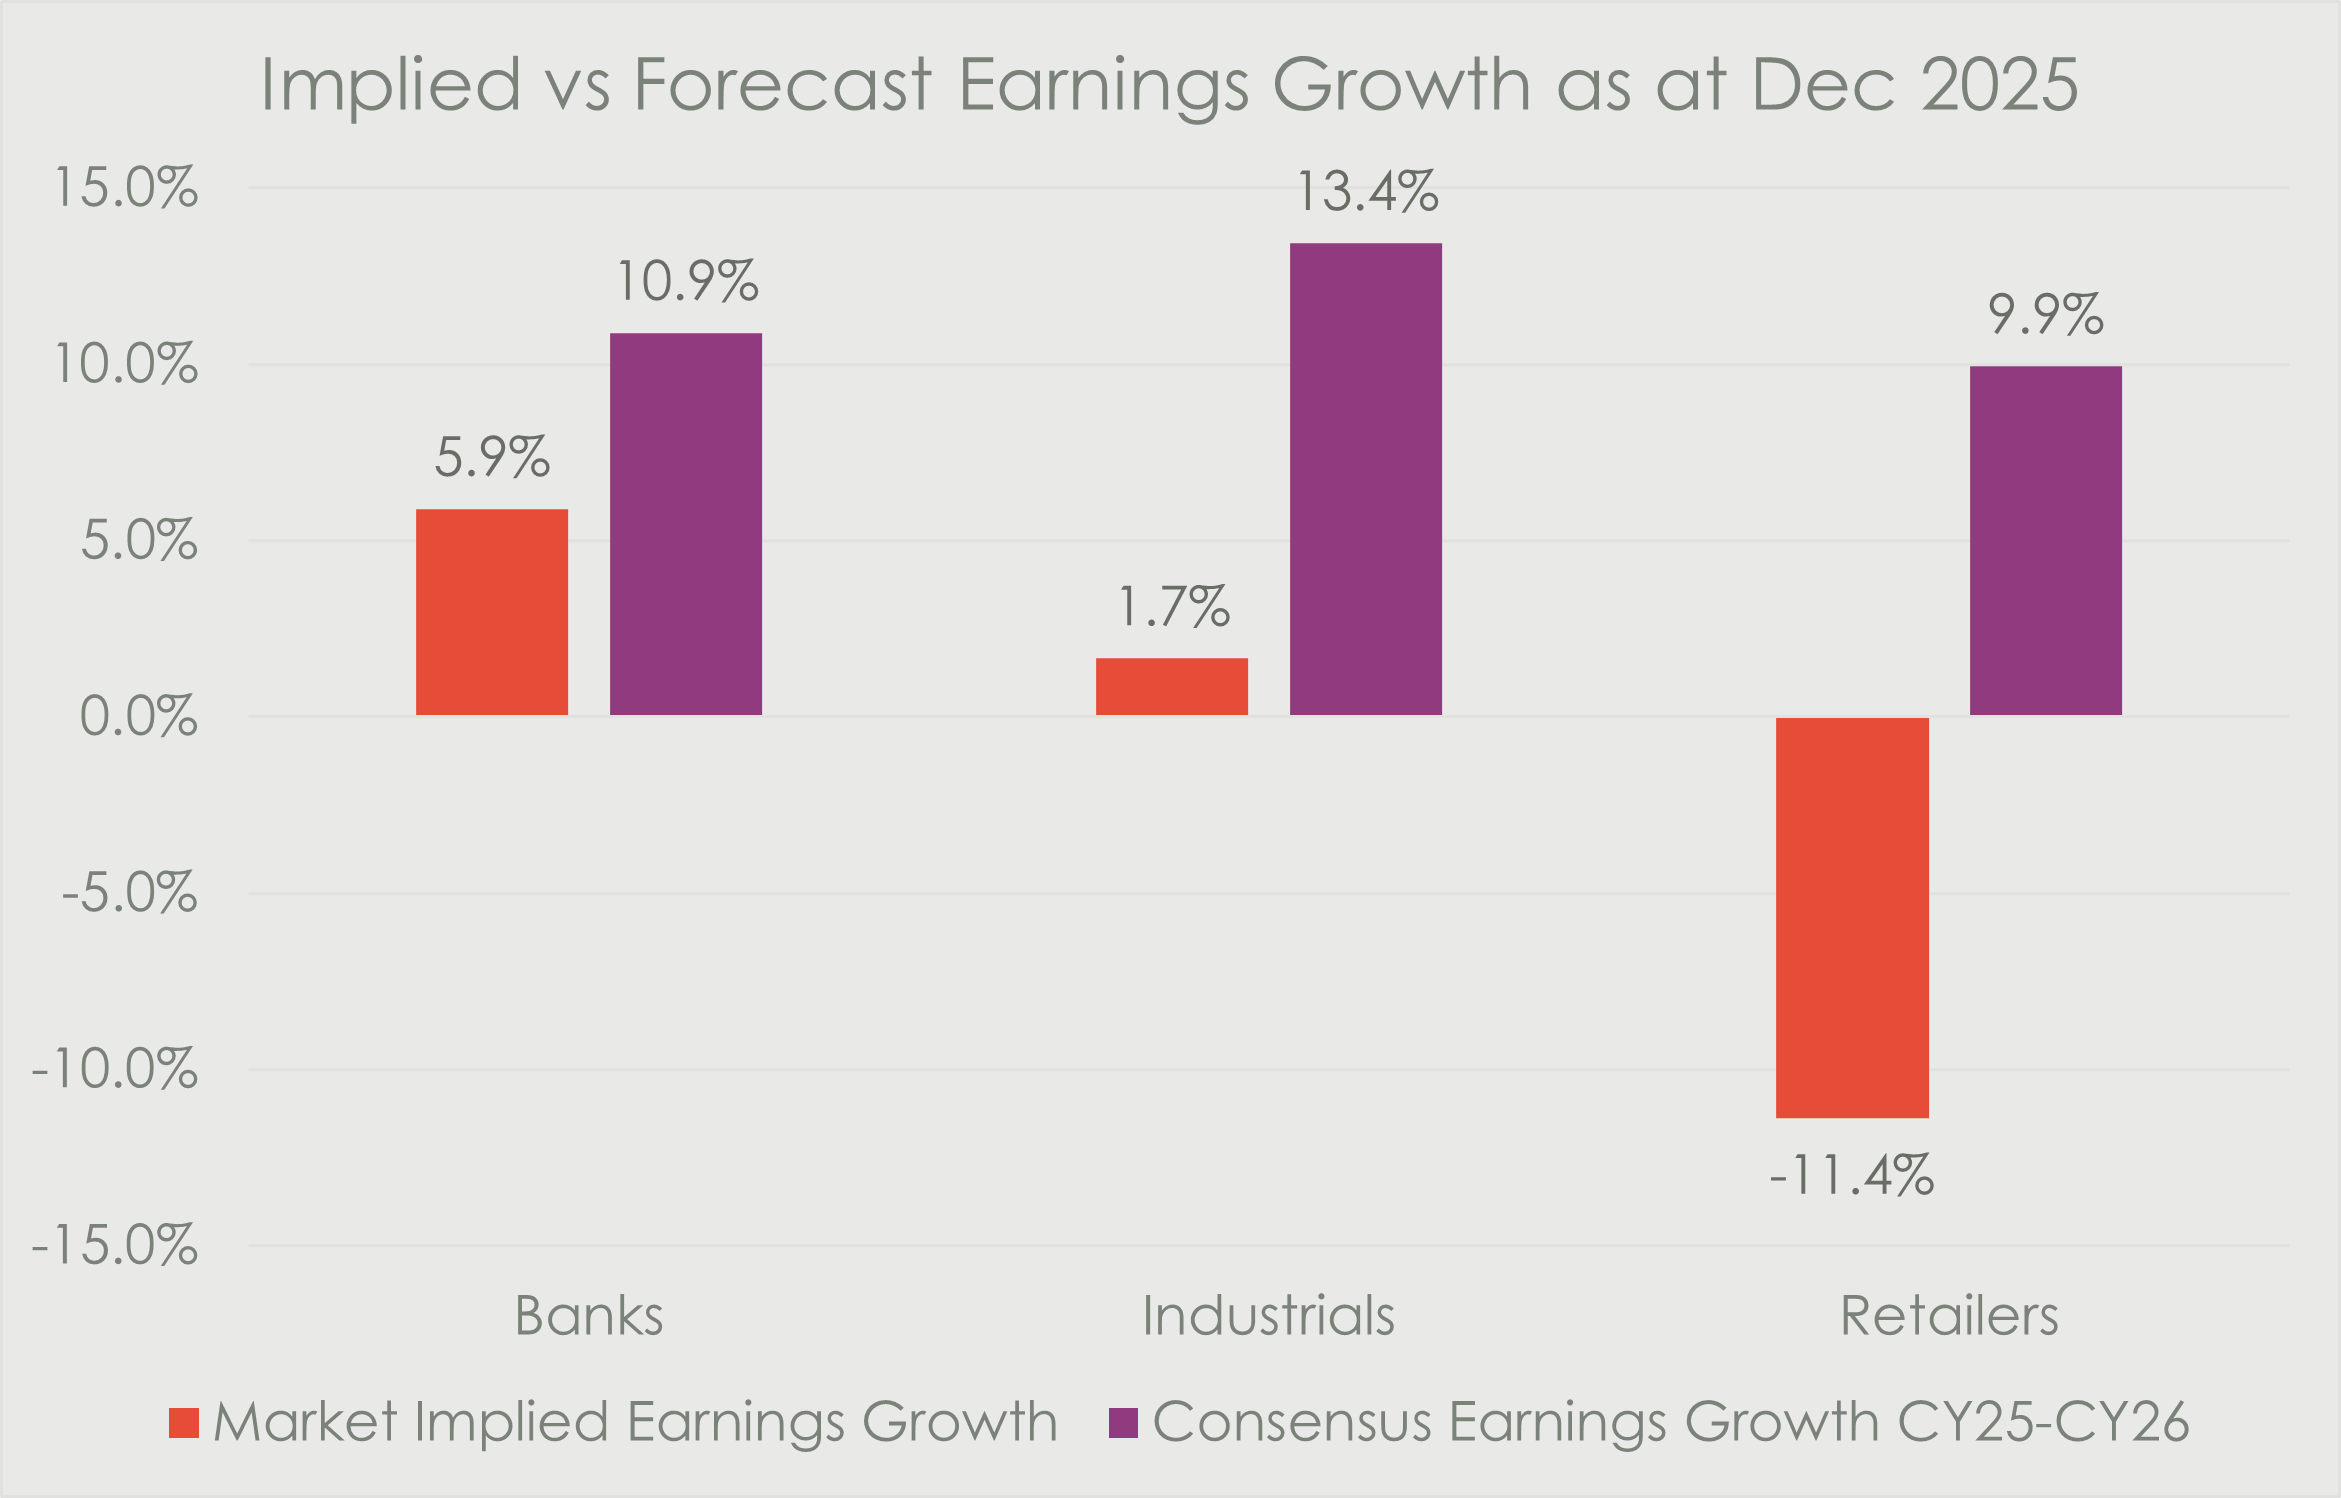
As we start 2026, we find that the market is still pricing in significant levels of pessimism and a regression in earnings, despite consensus forecasting mid-to-high single digit earnings growth for the year.
Ahead of 2026, we have identified catalysts that we believe will result in a positive performance for local equities.
- Second-order impact from the 2025 precious metals rally.
- Structurally lower policy and market rates, which may result in a broad rerating of SA stocks.
- A resilient consumer, with enough spending power to support economic growth.
- All of this culminating into an uptick in GDP growth, with a positive impact on global investor sentiment and earnings growth.
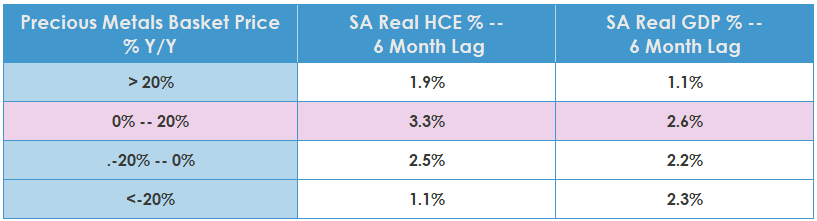
Empirical evidence demonstrates that increases in precious metals basket prices result in strengthening household consumption and GDP, with a six-month lag. We expect this to lead to an upward bias to our base case for GDP.
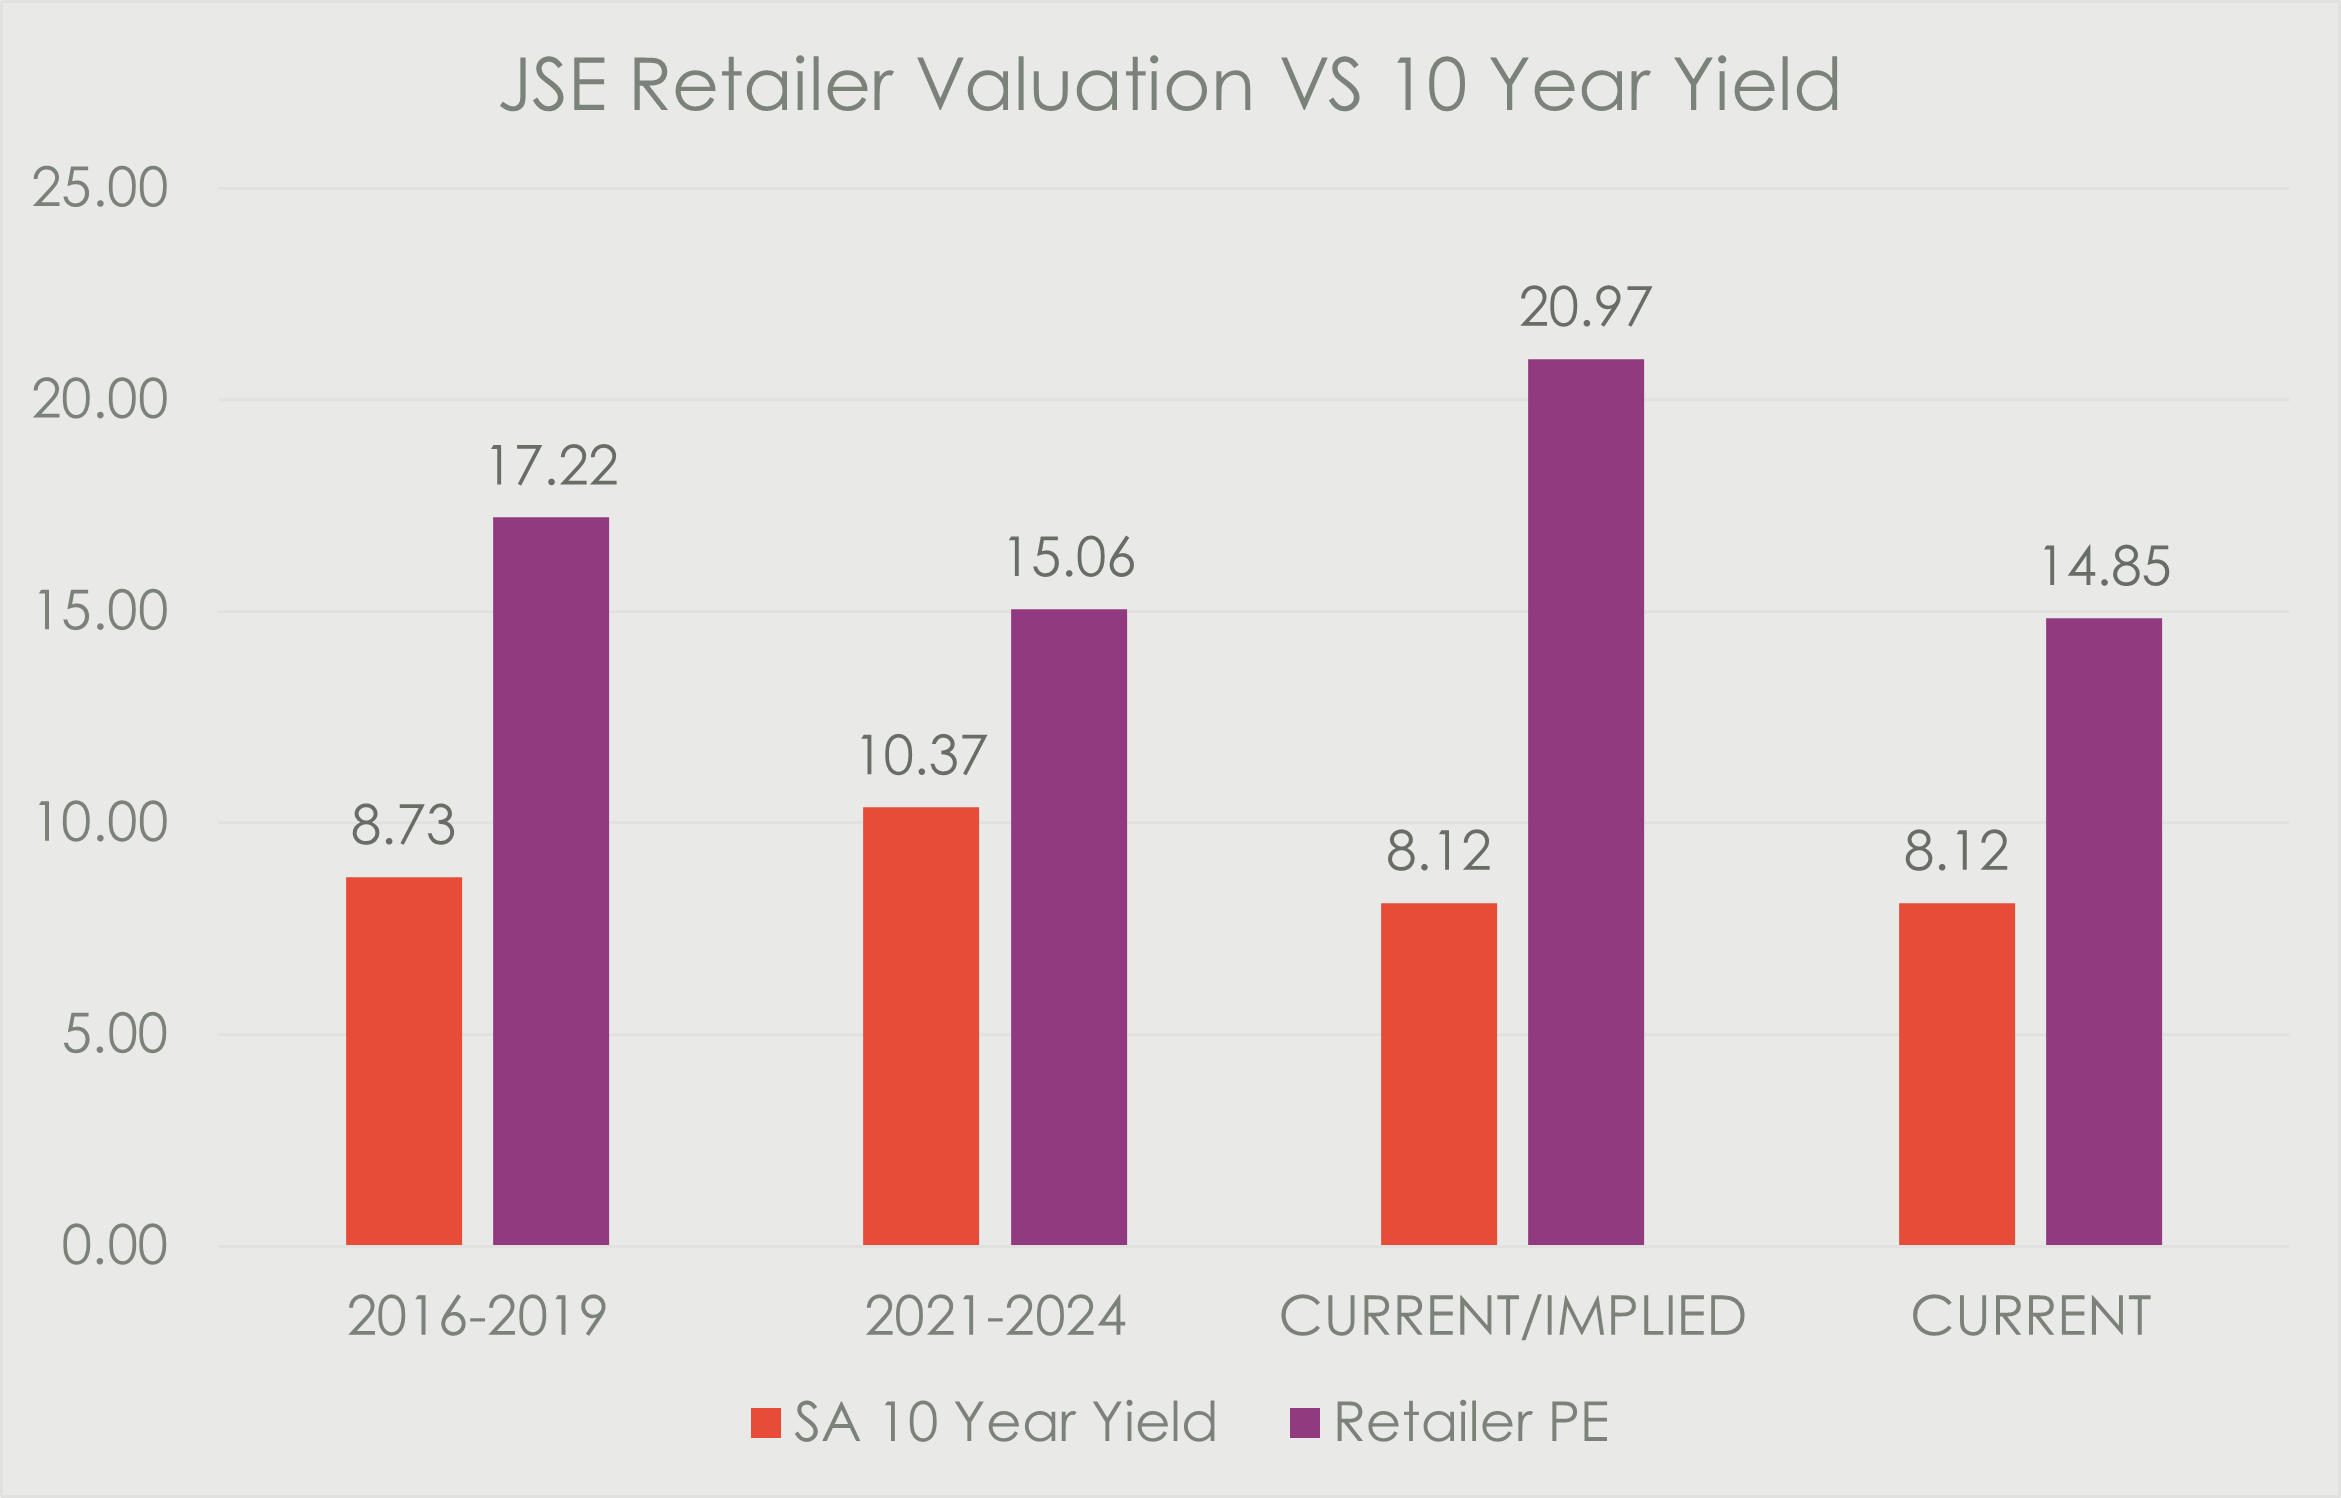
Lower policy and market rates lead to a rerating of market multiples, which drives stock performance higher, all else equal. Over 2025, the SA 10-year bond yield fell from 11% to 8.3%, while the central bank cut rates four times. According to our analysis, our market has not repriced to fully reflect this significant improvement.
Our base case for 2026 household consumption is a 1.2% growth rate, which would amount to an incremental R38bn in spending, against a base of R3.1 trillion in 2025. These levels provide a lever for an uptick in earnings growth, particularly among the banks and food retailers, which is currently not being priced in.
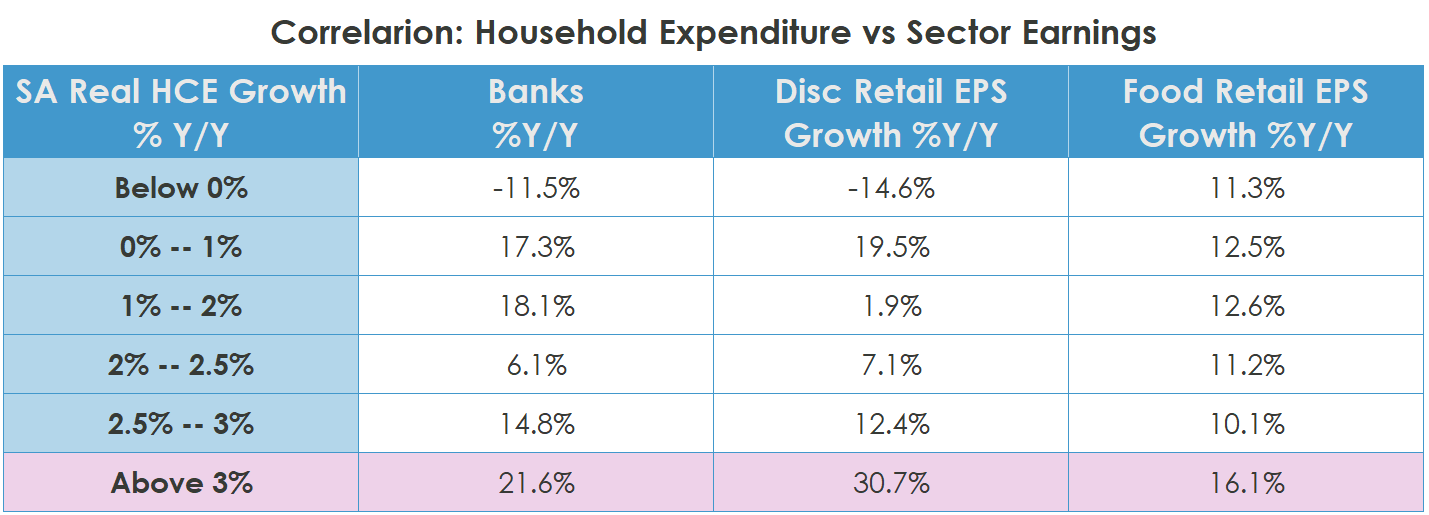
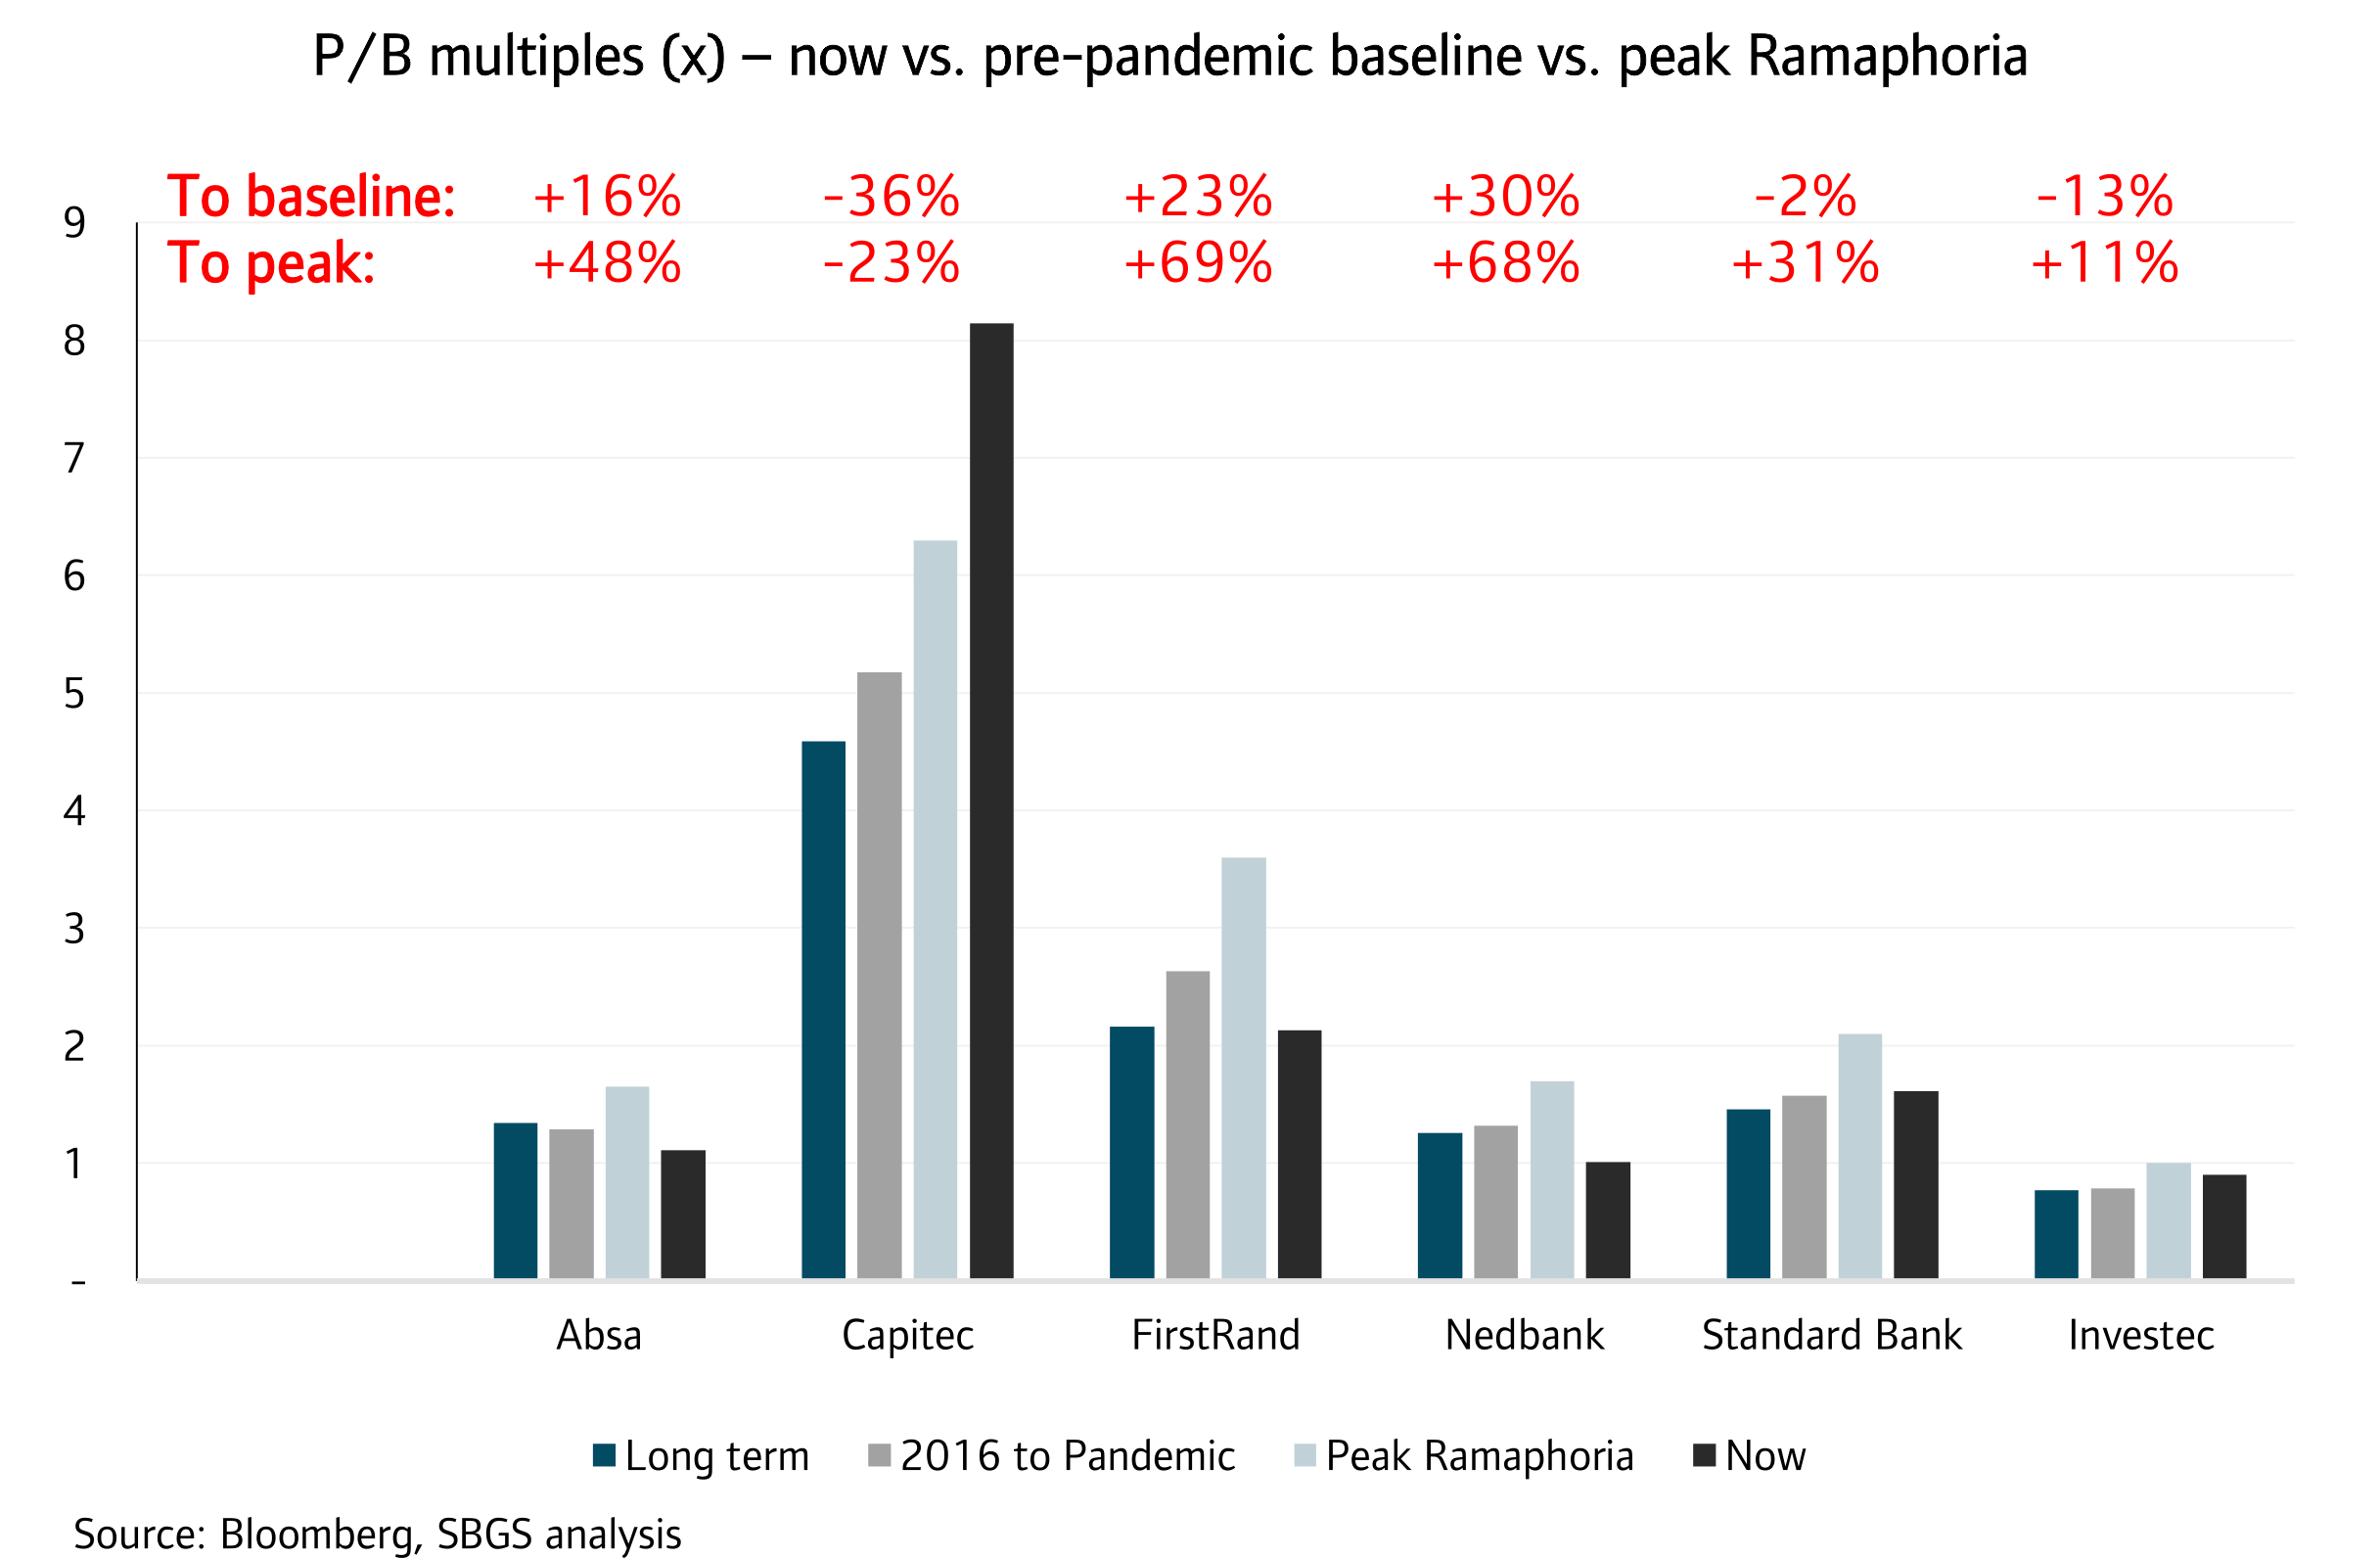
Despite bond yields and ROE prospects looking bullish relative to pre-pandemic levels, the big four banks trade at a 17% discount to pre-pandemic price-to-book multiples; indicating that further upside is possible in 2026.
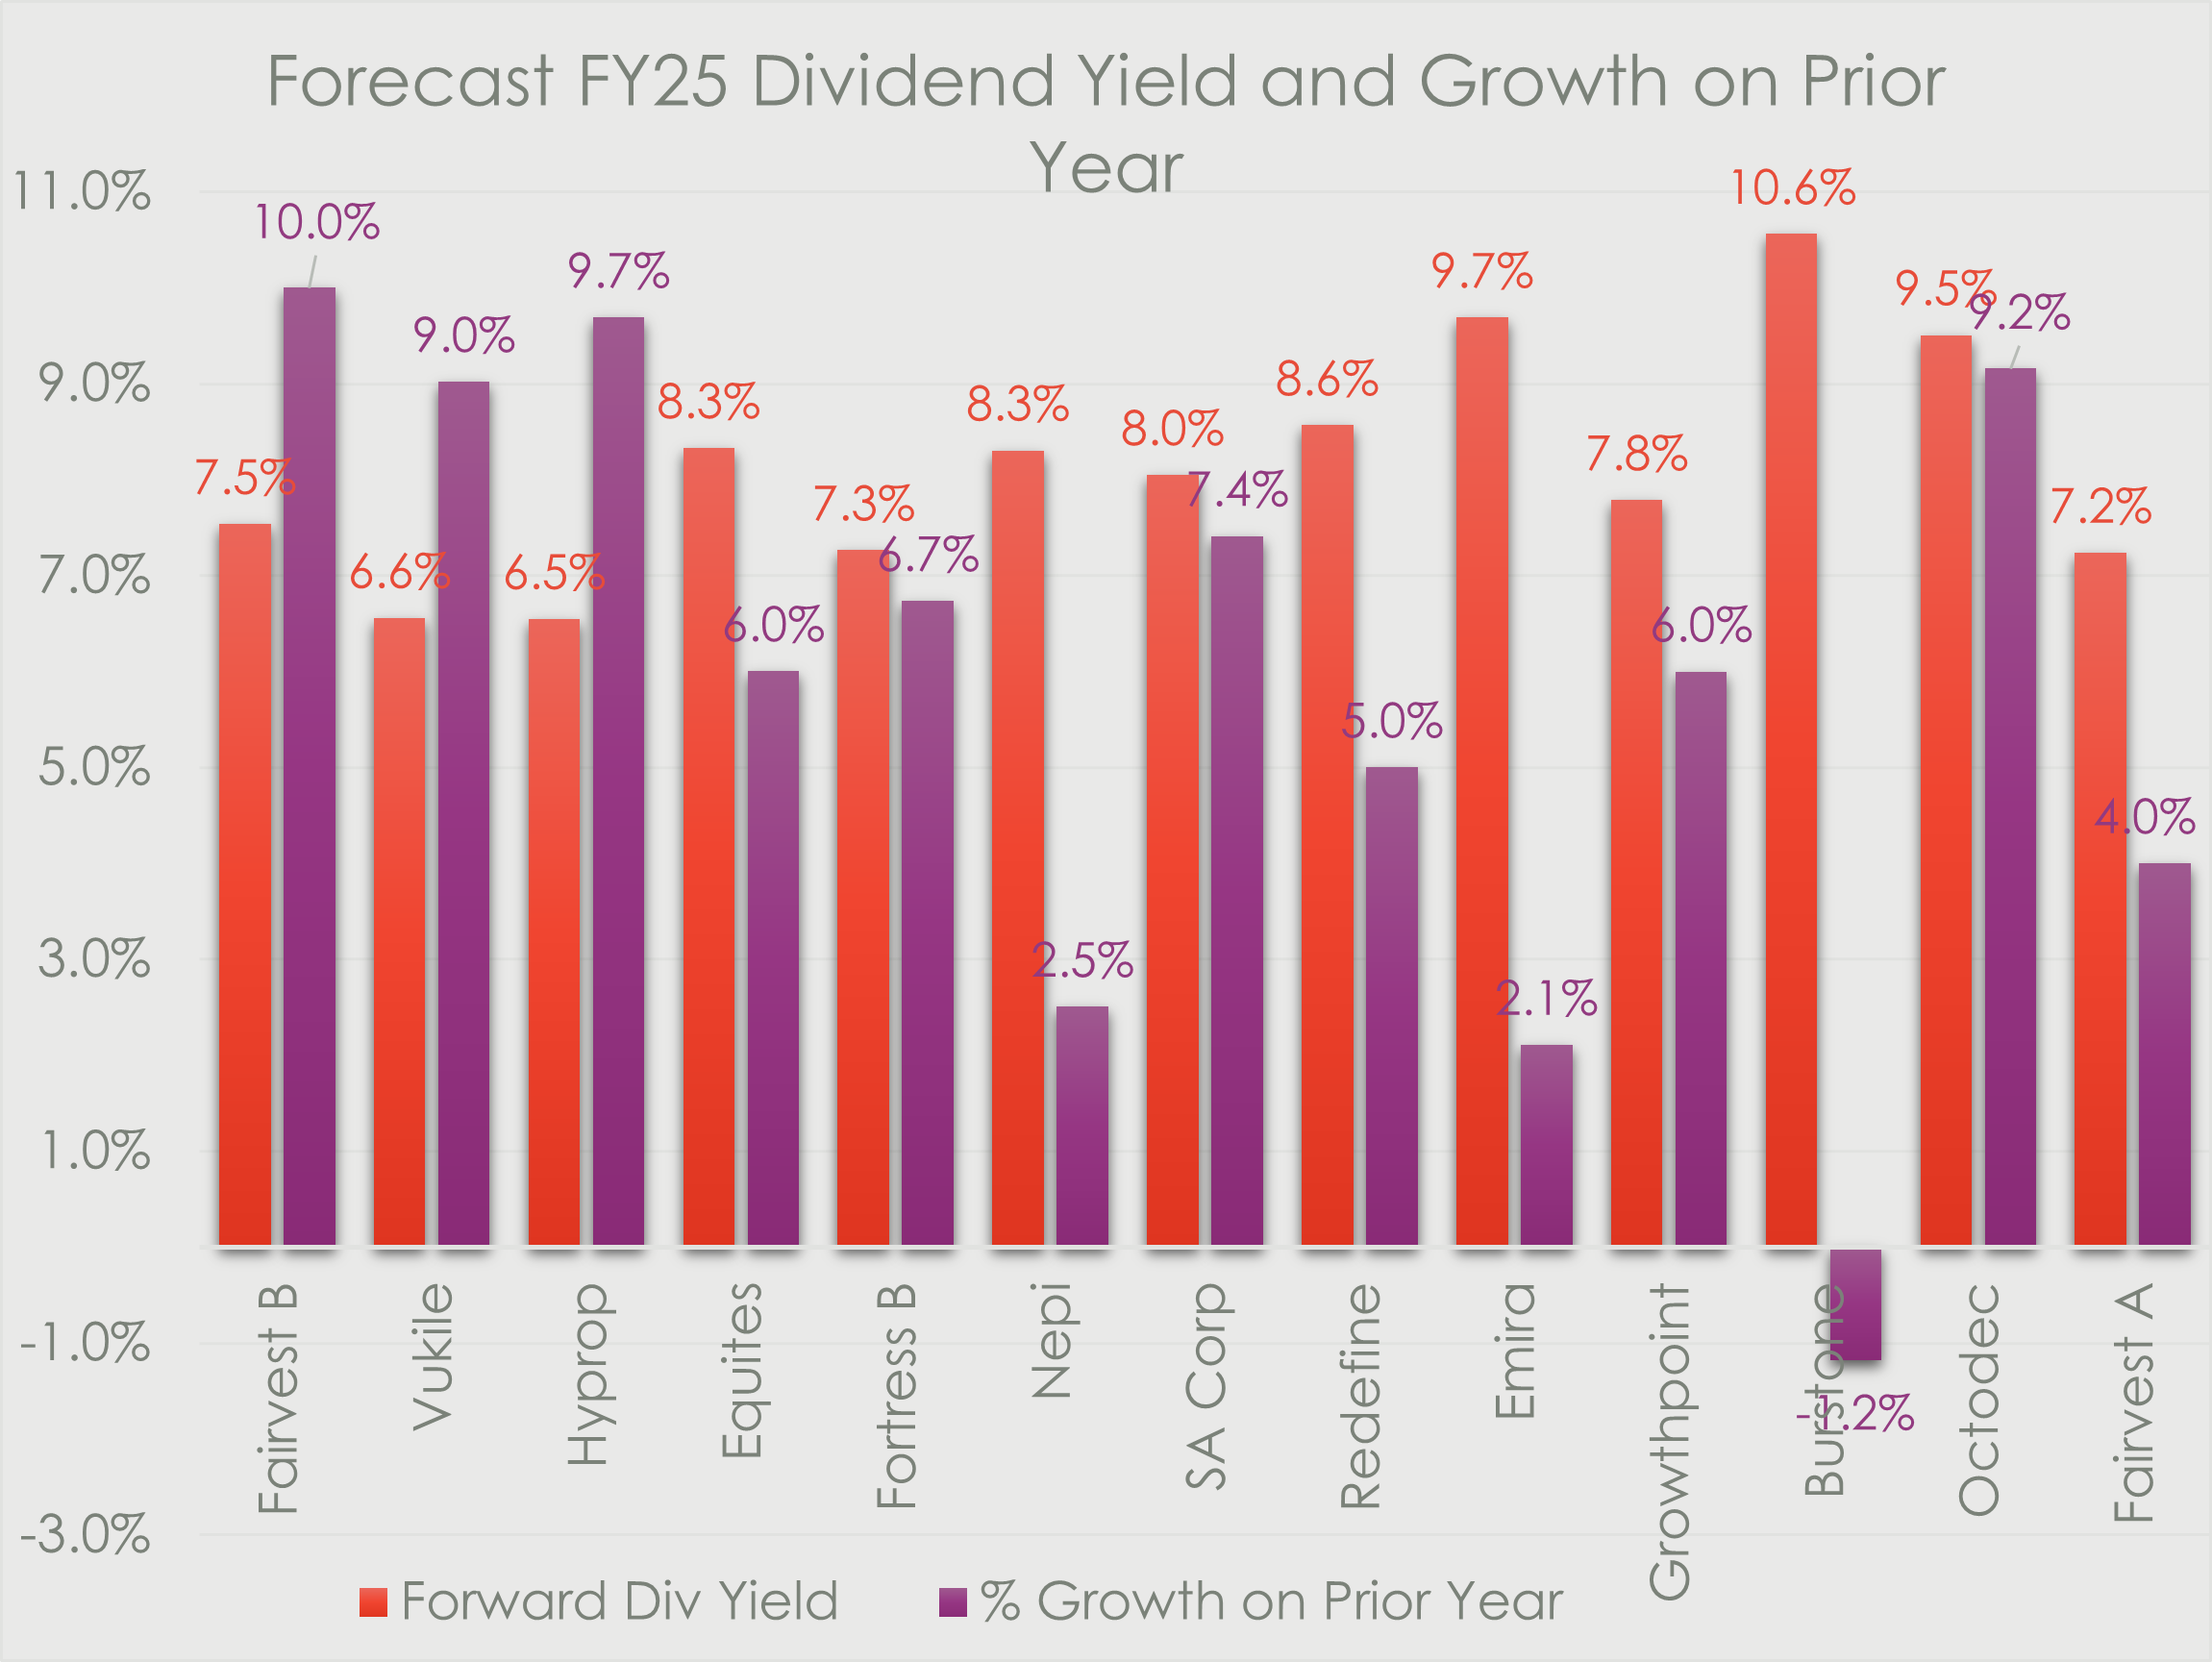
For the first time in a decade, listed property is seeing a growth in distributions across the sector. In our view, mid-single growth distribution and high-single digit yields should underpin further rerating to produce a mid-teens return profile in 2026.
Consensus earnings growth forecasts remain bullish for both 2026 and 2027. Excluding resources, local equities are expected to deliver low teens earnings growth over the next two years. This represents a significant strengthening relative to the recent past.

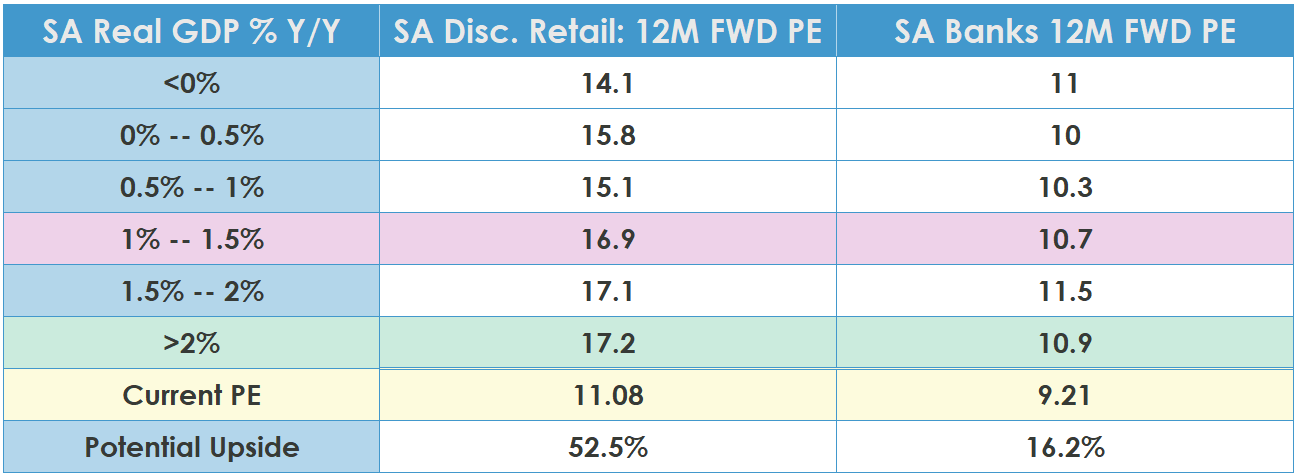
As a consequence of the above, we expect GDP growth to average 1.5% in 2026 and 2027. In these conditions, we expect a significant rerating to occur in local stocks, led by the under-owned and more cyclical sectors of the market, such as discretionary retail.
Positioning
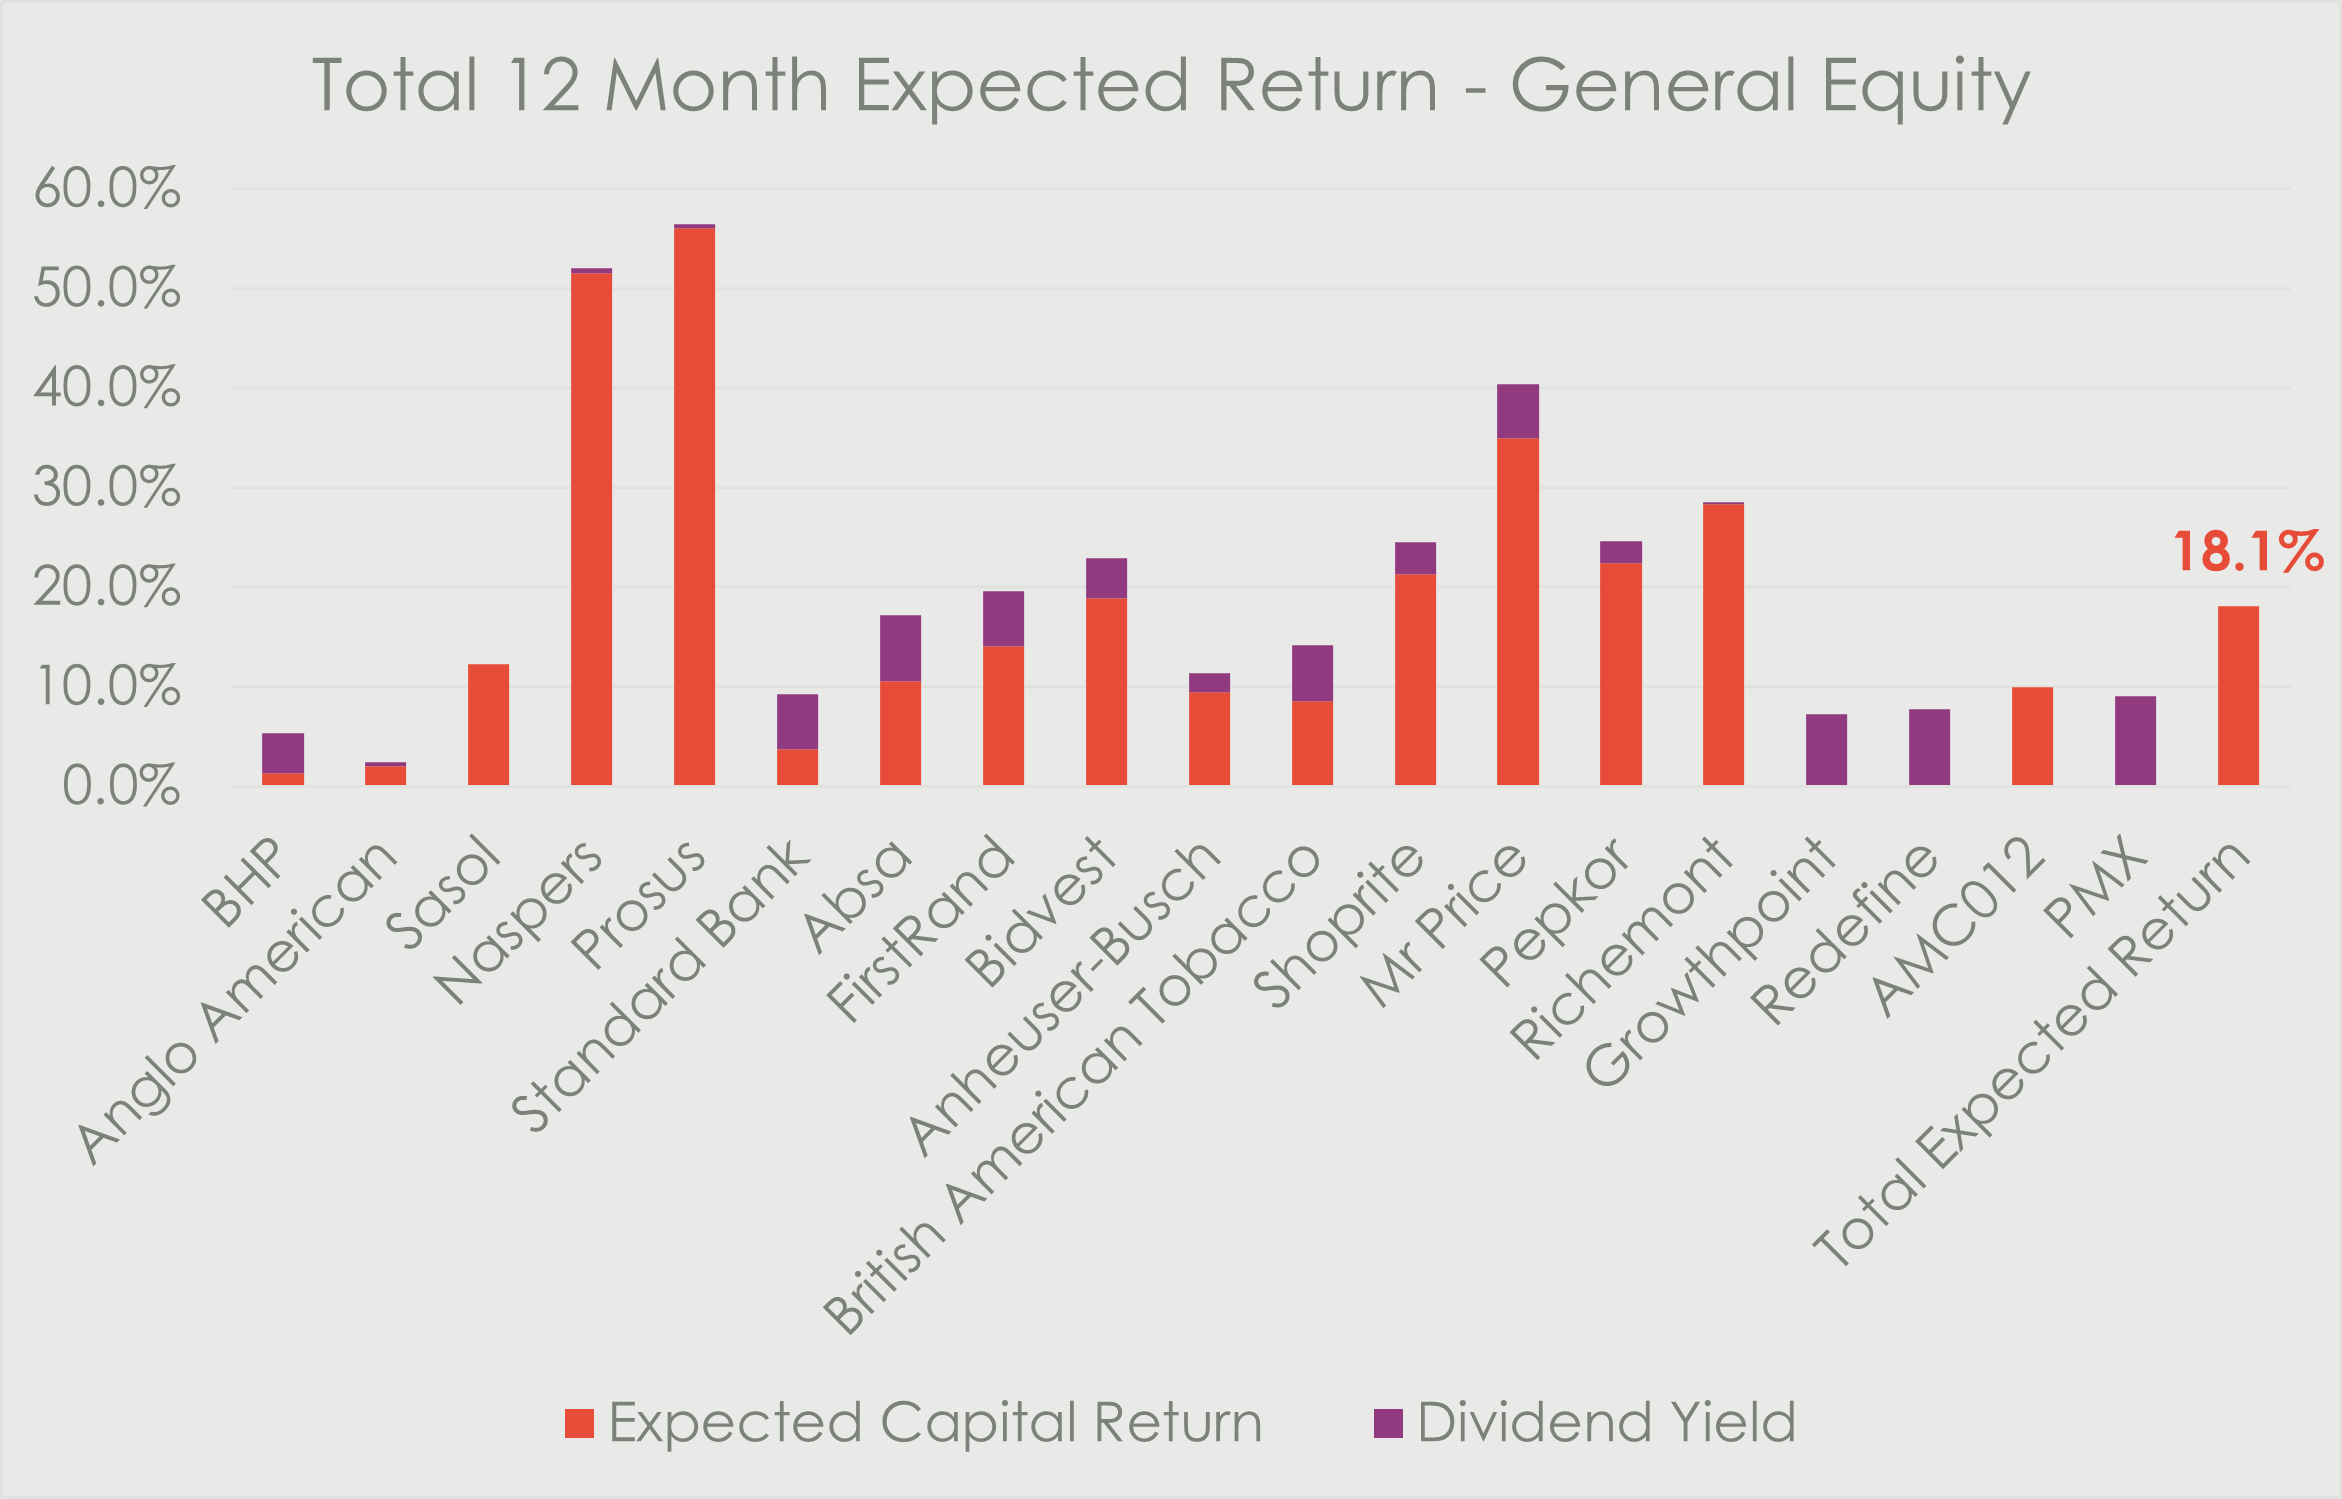
In light of the catalysts listed above, we expect another mid-to-high teens return from the portfolio in 2026.
We have bolstered our SA Inc. exposure with an increased focus on quality. To fund this change, we exited cyclical exposures, as well as reduced holdings of more fully priced names when the opportunity arose.
Our rand hedge exposure is anchored by our Global Equity AMC at 15% of the portfolio. Further to that, we maintain core holdings in the big consumer stocks, where we remain active on portfolio rebalancing to maximise value creation.
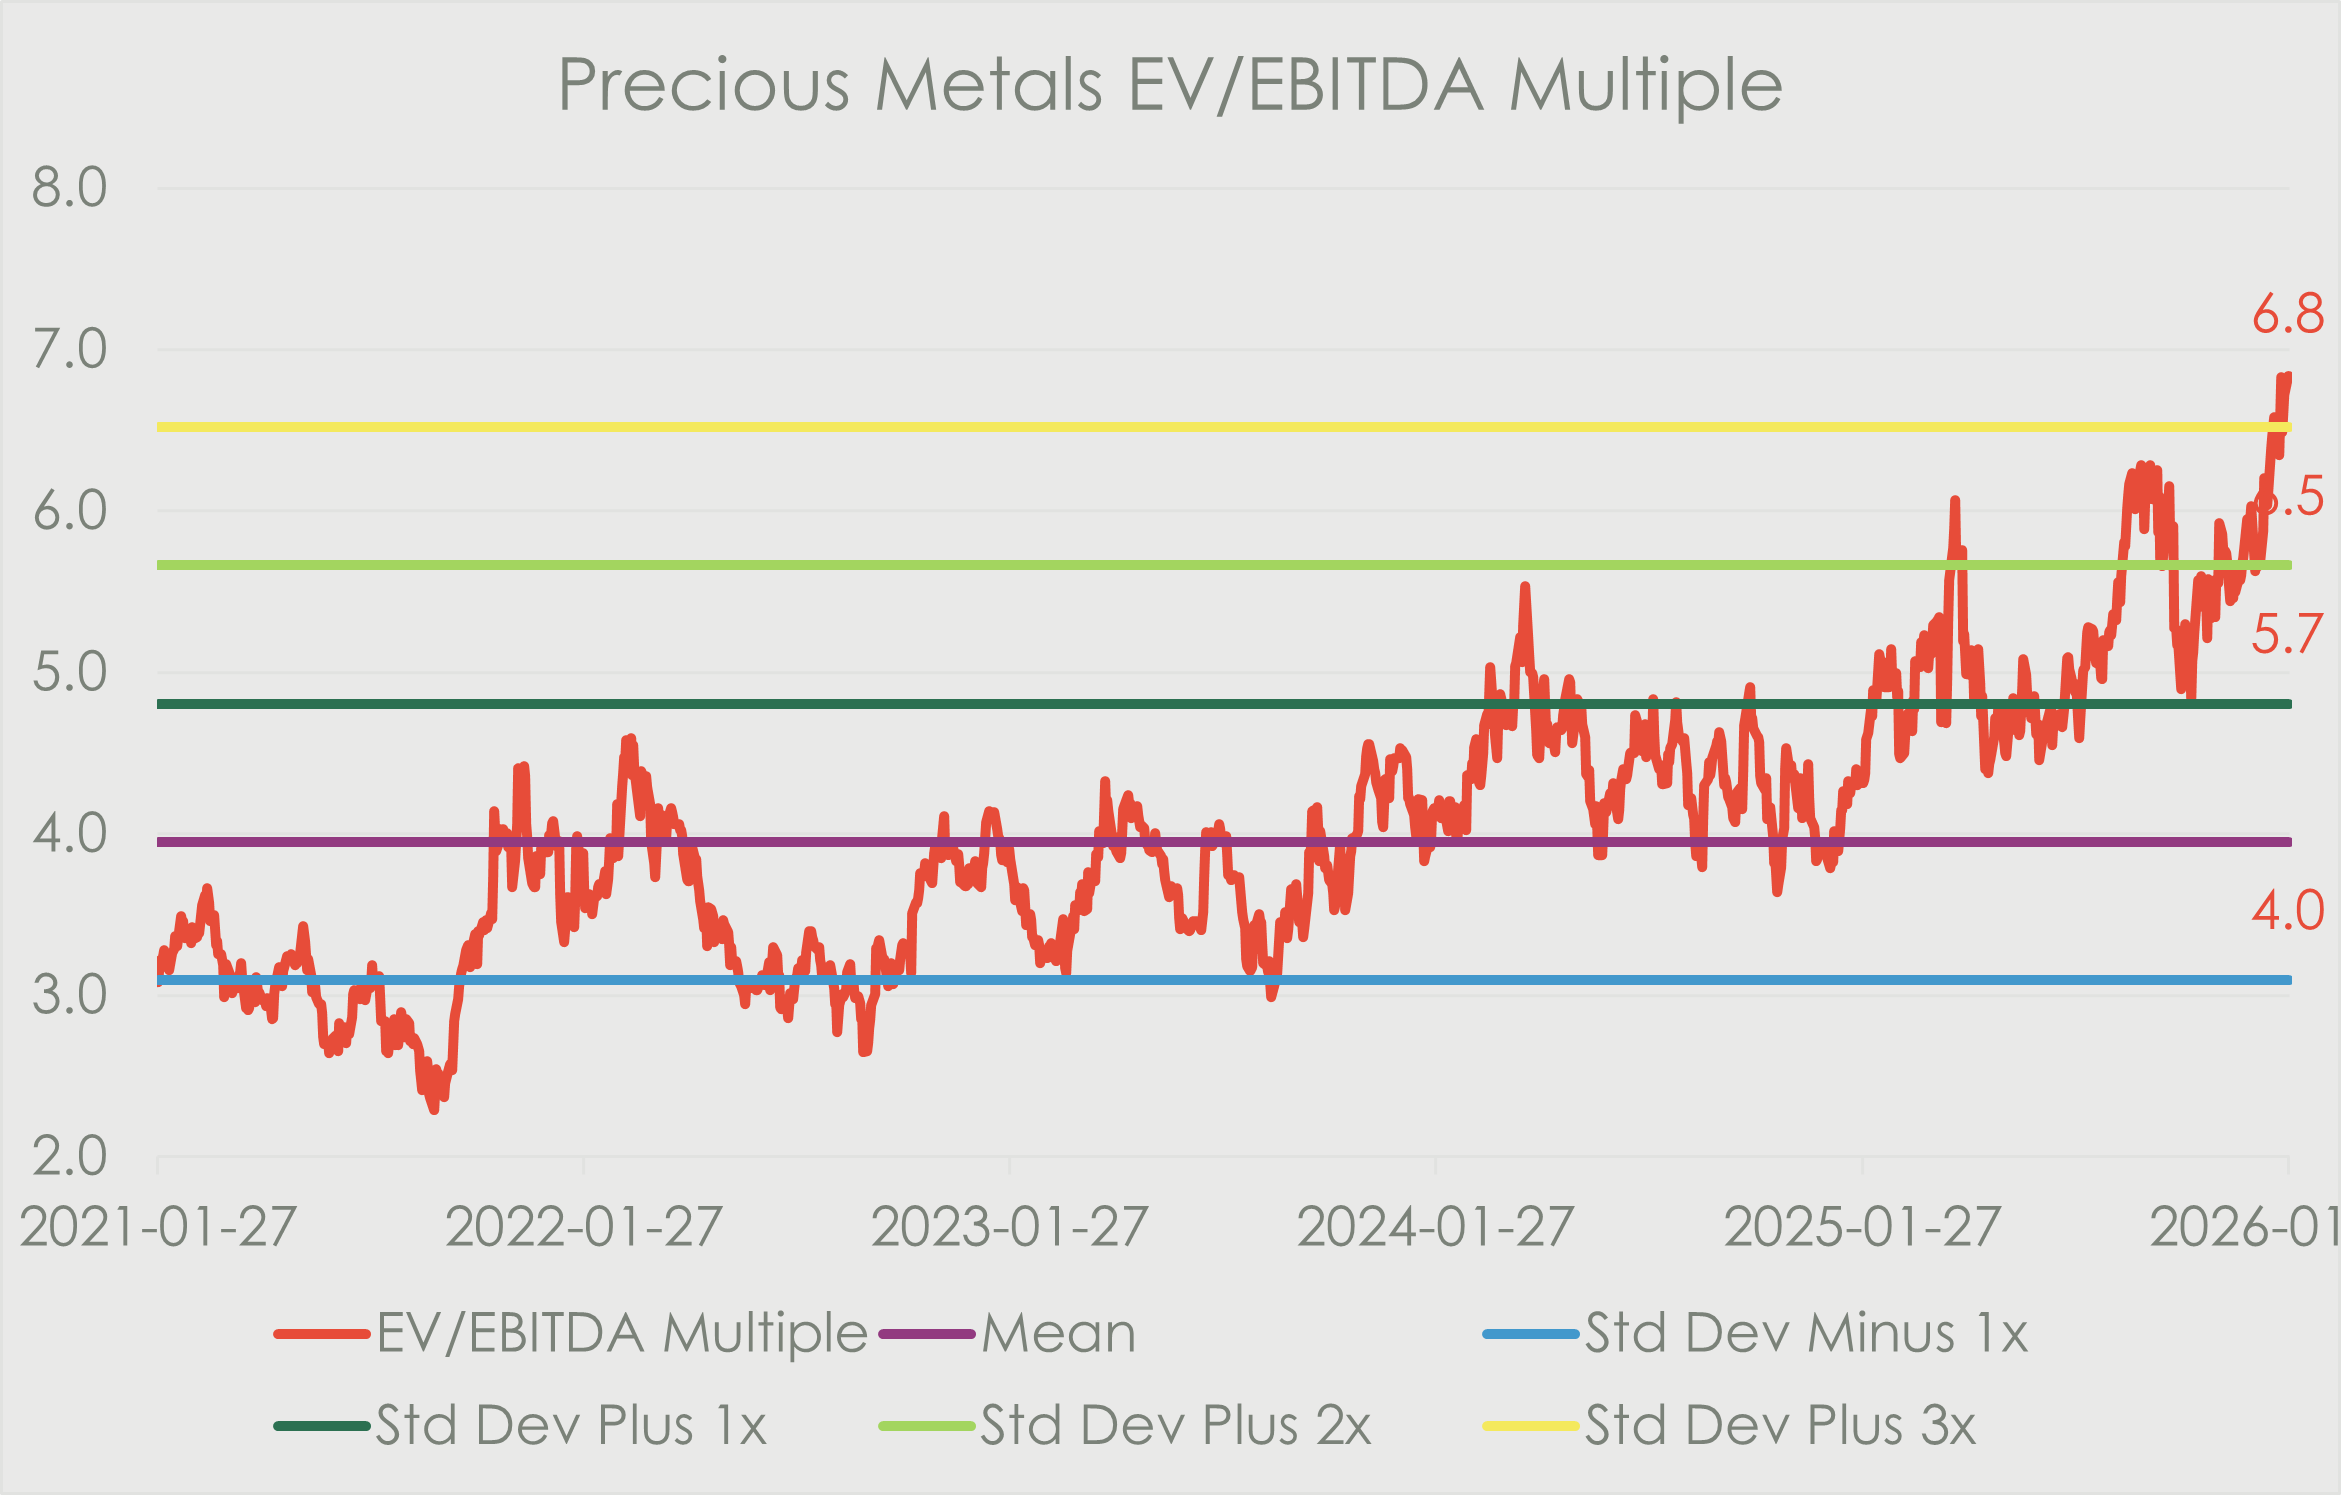
Despite material consensus earnings upgrades over the year, we find that precious metals remain exceedingly expensive, trading at approximately three standard deviations above their long-term valuations. The main drivers have been geopolitical, rather than fundamental in nature. Our sense is that risks are skewed to the downside on account of high operating leverage against expensive underlying metals prices.
Ever Present Political Risk
The main risks to our thesis are political in nature. It is our sense that the impact of Trump-related uncertainty has waned as markets have begun to look-through short term noise. However, he still has the potential to move markets negatively with his transactional style of diplomacy.
Domestically, the Local Government elections loom large at the end of the year. The markets will watch the results in major metros with great interest; with the Johannesburg race set to be the focus of investor attention.
Of equal import will be the progress made on the reform agenda, as Operation Vulindlela makes its way through a challenging second phase of the long-term implementation strategy.
Significant Rerating Potential
The convergence of fiscal discipline, infrastructure modernization, and deep valuation discounts makes 2026 a pivotal year for South African assets. As the economy transitions from sentiment-driven hope to data-backed growth, the potential for a significant rerating remains one of the most compelling alpha opportunities in the emerging market universe.