This month’s lead graphic is a reminder that the world is not yet clear of the threat posed by COVID-19. And while much of the First World has made significant strides in vaccinating their population, the emergence of the Delta variant has raised further fresh questions about how long this virus will really be with us.
At home, the Delta variant has wreaked havoc in the Gauteng population, with infection rates spiking beyond the peak of both the first and second waves. In response to the surge, President Ramaphosa imposed fresh restrictions on South Africa towards the end of June, with adjusted level 4 leading to the closure of schools, the banning of gatherings and prohibition on alcohol sales, amongst other measures.
But despite this, on aggregate, equities have continued to push significantly higher in the first half of the year. Locally, our market took its first breather in 7 this month, after a stellar string of 7 consecutive monthly positive returns in a row.
As markets move higher, the inevitable questions begin to surface about the level of the index. As stock pickers, our response is generally indifferent. As should be expected, we are much more concerned with the earnings outlook for the stocks we own, than the level of the All Share Index. It should be no surprise then, that regardless of index points, we are prepared to commit fresh capital to new positions, where we feel current prices are not congruent with our expectations of future earnings potential.
And so it is that this month we added a new stock to both our local and global portfolios, Truworths locally and New Oriental Education and Technology group offshore. Keep reading if you would like to get a little bit more info on either of these two companies.
We also contemplate what may be in store for us in second quarter US earnings on their way shortly and then do a deep dive into the health of the SA consumer, the data may well surprise you.
Enjoy this month’s read.

International Section
By the numbers | Earnings growth set to continue | Stock Comments
Local Section
By the numbers | SA consumer, heathier than you think | Stock Comments
International section
By the Numbers
The US market led the way higher, with the S&P500 almost doubling the ACWI return, not to mention the Nasdaq with gains in excess of 5%.
The Federal Reserve the main talking point, with a few more hawkish comments on inflation bringing rate hike expectations for the market forward into 2023, a year early than before.
The result of this unsurprisingly lower of expectations for long term growth, with the US 10yr yield dipping into the 130’s, consequently flattening the US yield curve.
Against this backdrop, not difficult to see some pressure in cyclical names in June and outperformance from ‘growth’ stocks, really encapsulated by the significant alpha from the Nasdaq relative to the S&P. In line with this, some good leadership from our US dollar proxy against a basket of global currencies (ticker DXY) gaining lost ground after having been under pressure for most of 2020.
This 2.5% strengthening of the dollar in June was more than most local currency market returns could handle with a resultant USD drawdown most major first world indices.
With this in mind, easy to understand financials taking the wooden spoon at a stock level, with tech featuring in major moves higher in June.
Two unusuals featuring at the top of the pile in Biogen (US) and Morrisons (UK). Biogen firing out of the blocks early in June as the FDA approved their new Alzheimer’s drug. It led to a halt in trading at one point and eventually finished the month up 30%. Morrisons also screaming higher even as the Board of Directors spurned an offer to buy out the company.


Earnings growth set to continue

Companies blew analyst estimates out the water for the 1Q, with actual earnings coming in almost double that of initial estimates. 1Q EPS growth finally settled at 49.5% vs 24.5% expected at the beginning of the reporting season.
Looking at 2Q21 EPS, current expectations are for 60.1% Y/Y growth, which has moved up from 52% Y/Y growth estimates at the beginning of the quarter.


Stock Comments
New Oriental Education & Technology Group (EDU) investment
In a country where education is one of the main keys to social mobility, Chinese parents are often willing to pay more for their children’s private tutoring to improve their performance in public examinations. This has encouraged the development of the world’s leading market in After School Tutoring (AST).
A recent survey shows that children’s education continues to be a top financial priority for families in China


The marketplace remains fragmented with the top 2 players only commanding 3% of the market. At present EDU accounts for just 1.8% of the nation’s AST market.
Over the last 3 years EDU has grown enrollments by 30% and revenues by 25% Y/Y. A current target is the expansion of its school network by 20-25%, as well as to grow its net revenue by 26% over the next 5 years.
The stock has fallen 65% since February 2021 as regulatory concerns resurfaced. We believe that the current market price has already discounted the most stringent regulations, which we see as an unlikely case. This pull back has created an excellent opportunity for us to take a position in a company that is at the forefront of an attractive industry, with the prospects of incredible and sustainable secular growth at significantly discounted levels.
EDU appears well positioned to withstand the uncertainty regarding the regulations, as these are essentially targeted at protecting children and preventing the smaller, less-known education facilities from taking advantage of education-eager parents and children. In fact, EDU stands to gain market share and benefit from these regulations as the smaller players leave the market. Consequently, EDU is likely to strengthen its dominant position as a well-established private educational-services provider.
New Oriental has been aware of the possible regulation changes since 2018; they have made the necessary changes and continue to engage with their PRC legal counsel. These regulations include:
- Limiting the collection of fees to no more than 3 months in advance.
- Increasing the regulation requirements for the acquisition and expansion of learning centres.
- Teachers are also expected to complete additional teaching certifications.
- Kindergartens and K-9 classes must be completed before a predetermined time and no homework can be assigned.
All these regulations are put in place to foster a positive environment to improve the education standards and enhance teaching quality.
From a valuation perspective, EDU has historically traded at a 40x PE multiple, a high multiple but justified given its growth and the growth of the sector in general. Given the current headline regulatory risk, this stock is currently trading at a PE multiple of 15x. We expect EDU’s profit to continue to grow on the back of solid revenue growth and improving margins.
Revenues of New Oriental Education and Technology from fiscal year 2010 to 2020 (in million U.S dollars)

International Section
By the numbers | Earnings growth set to continue | Stock Comments
Local Section
By the numbers | SA consumer, heathier than you think | Stock Comments
Local section
By the Numbers
June saw a drawdown of 4% for the equally weighted, the chief protagonist in this regard being our Resources sector.
Banks not that far behind after a period of outperformance, with property the belle of the ball in June.
The softening in the Resource sector could have been much worse were it not for the cushion of the rand, taking real pressure in June and losing more than 5% to the greenback.
Another very difficult month for the gold bulls, the standout movers in June for all the wrong reasons, with most SA listed gold miners pushing losses in excess of 20% over the reporting period.
Sentiment in SA also weighed down by spiking Delta variant COVID infection rates, with the President moving the country back to adjusted level 4 near the end of the month.
Another large current account surplus in May (reported in June) was not enough to keep the band playing as consumer sentiment stepped backwards in the face of fresh healthcare headwinds blowing through the country.
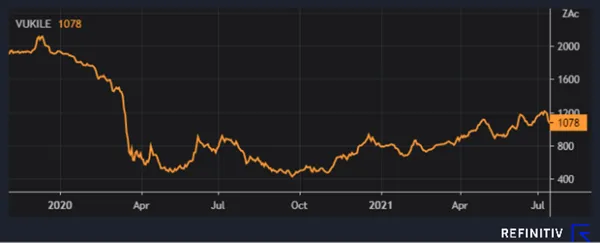
Big moves from the Foschini Group and Vukile property fund in the month after strong relative results, which obviously must be read in the context of the global pandemic. Foschini’s emerging with excess provisions, strong cash flow generation and significant reductions in gearing giving the bulls something to cheer about. Vukile’s results also ahead of expectations, with some analysts having to push their fair value estimates for the company more than 35% higher.


SA consumer – healthier than you think
There is a general negative perception that South African consumers are under strain, and this is flowing through into suppressed valuations of consumer-focused cyclical stocks in general and the apparel retail and bank stocks specifically.
While 2020 was a very disruptive year, the SA consumer has come out of it better positioned than it was going into the pandemic.
- Disposable Income is 6.7% higher than 2019 levels.
- Household Savings have increased to 1.9% of GDP, up from 1.2% on average levels.
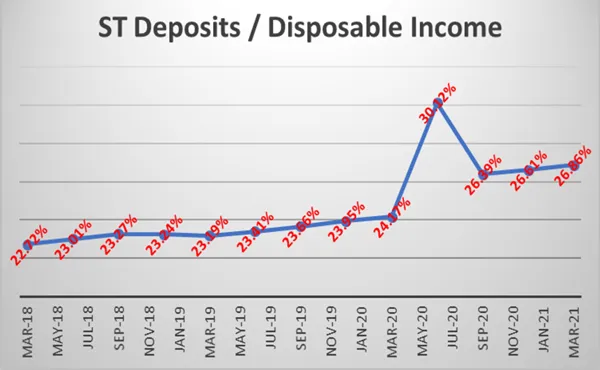
- Households have added R121bln to short-term cash deposits since Jan 2020, which amount to about 26.8% of disposable income. This results in excess cash deposits of about R121bln or 2.3% of GDP.
- Debt affordability has improved significantly. Debt service costs have fallen to 7.7% of disposable income, from 9.5% in 2019.
- Net Wealth was up 5% Y/Y in December 2020.
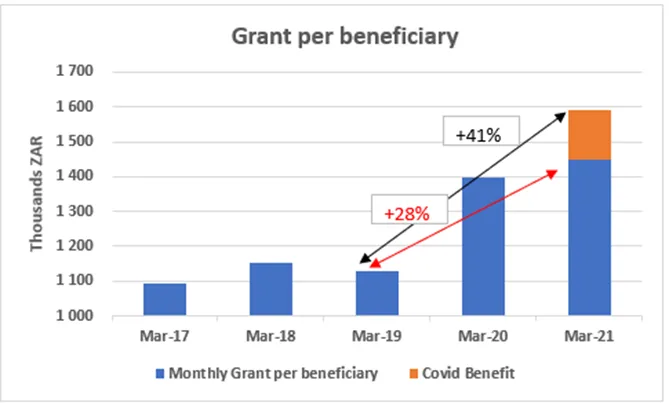
- Social grants have increased 28% per beneficiary from March 2019 levels.
What this all adds up to, is a consumer that is in a pretty good position relative to pre-pandemic levels with the capacity to drive spending and retail sales above normal levels. If confidence levels pick up as vaccinations become more widespread and households choose to loosen their wallets; this could add almost 1% to GDP growth, 3.5% to retail sales and potentially 22.3% to clothing sales going forward.
Our positive view of the SA retailers is not premised on a ramp up in sales above normal trends, however this analysis gives us confidence that our expectations are conservative, and the consumer is well placed to continue spending going forward.
Consumer income continues to grow
While the pandemic driven lockdown caused a temporary spike in unemployment, disposable income (Income less Taxes) has remained resilient, increasing 1.6% Y/Y in March 2021. When comparing disposable income to pre-pandemic levels, current disposable income is up 6.7% versus March 2019.


Despite 2020 experiencing one of the worst recessions in history, the SA consumer has come out the other end seeing very little impact to take home pay and with more disposable income than when it started.
Money in the bank
Clearly the SA consumer battened down the hatches during lockdown. Gross savings increased to 1.9% of GDP, peaking at 2.4% in Sept 2020 from average levels of 1.2%.


Households are wealthier
Not only are households earning more money, but their net worth is also increasing as property prices move up and financial assets recover.


Social grants beneficiaries aren’t being left behind
Given that more than 11.5mln South Africans receive a social grant of some form, it is important to keep them in consideration when discussing the SA consumer environment.
Social grant beneficiaries have not been left behind, excluding any additional Covid benefits, social grants are up 28% since March 2019 and a whopping 41% when including Covid benefits. This suggests that the spending power of grant beneficiaries remain in place.

Stock Comments

The South African retail environment is currently recovering from the hard lockdown restrictions imposed in 2020. Mr. Price, Pepkor, and The Foschini Group have all released results in March 2021. They have noted that sales growth and collections on credit books were better than expected. Property companies are also reporting increased footfall in their shopping centers, with consumers returning to their spending habits. In addition, banks have indicated that credit default forecast trends are significantly better than expected.
The UK environment is also bouncing back after the lockdown restrictions were lifted in April 2021, with shopping centers reporting an increase in footfall. The environment is starting to stabilize, and we can expect to see a recovery in retail sales.
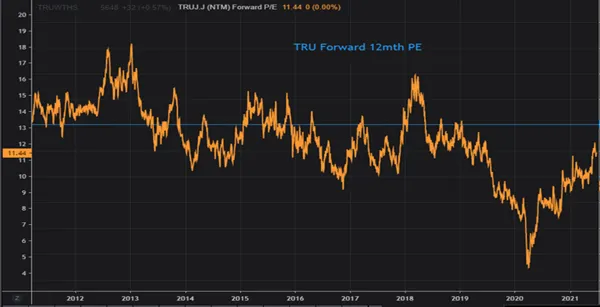
Despite the improving retail environment, consensus earnings estimates for TRU remain significantly depressed versus our forward year EPS estimates. Our estimates are currently 48% and 36% higher than consensus for 2022 & 2023, respectively. Our above consensus estimates are also based on conservative assumptions, so if the current trends in the retail environment continue, our valuation numbers could be too low.

Using our 2022 EPS estimates with a 12x PE multiple gets you to a target price of R80.76. Using a 10-year average multiple of 13x gets you to R87.50/shr.

Sales forecasts remain conservative in an improving environment
Given TRU has a June Year-End, the last 2 years have been impacted by various degrees of lockdowns driven by the pandemic. As we enter a more normalized environment, we model sales against 2019 revenues.
- We assume SA revenue for 1H22 will increase by 3% from 1H20 and increase 3% in 2H22 from 2H19. This will result in total revenue for FY22 growing 4.55%, from a FY19 base (15.27% from FY21 revenue).
- The UK business has been under significant pressure over the last 3 years. Going forward we assume Office stabilizes and improves as management has been able to remove an enormous amount of costs. We forecast revenue for 1H22 to be at 1H20 level, and 2H22 to be at 2H19 level as conditions in the UK return to normal. This equates to FY22 revenue increase of 40.78% from FY21 (2.25% decrease from FY19 base).
- Total group revenue for FY22 is forecasted to be up 20.52% from a Covid impacted FY21. A mere 2.83% growth from FY19 revenue levels. FY23 revenue is forecasted to grow at 6% from FY22 levels. Our revenue growth assumptions are conservative compared to the current sales growth levels of 8%.
- Margins are forecasted to move closer to pre-Covid averages of 23-25%, with FY22 OM estimated to be 21.5%, and FY23 OM at 23%.

Improving credit book offers a large potential earnings boost
TRU has a large credit book that typically drives 80% of its retail sales. During the crisis, TRU pulled back on lending and wrote-up their provision for bad debt to a record 30%. As the environment normalizes, we expect credit growth to restart as well as bad debts and credit provisions to come down; this has the potential to significantly drive EPS.
- The Trade Receivables book could add an incremental R0.80 – R1.12 per share to EPS, as credit growth kicks off again and bad debt and provision levels normalize.


- Gross debtors are forecasted to grow a modest 6% from FY21, resulting in a credit book still down 2.86% from Dec-19 levels.
Catalysts:
- Should the consumer cycle continue to improve without stricter lockdown regulations in South Africa and a stabilizing UK environment, we believe that the revenue in the next 6-12 months will increase to above consensus revenue levels.
- We expect a trading statement to be released for FY21 around the 2nd or 3rd week of July.
- FY21 financial report in August.
Risks:
- Key investment risks include harder lockdown restrictions being imposed by the South African government, resulting in non-essential businesses shutting down amid the surge of the third wave of Covid.
- Continued poor performance of Office in the UK despite a stabilizing environment, resulting in lower margins than anticipated.
- A slower consumer environment, which may translate into lower sales growth than currently forecasted.
- Stricter lockdowns impose a fashion risk, resulting in higher inventory write-downs and lower gross margins.

Vukile Property Fund released full year results for a period which fully encapsulated the impact of South Africa’s lockdown from April 2020 to March 2021. Results showed resilience in a very tough operating environment and a solid structure heading into their next financial year. 49% of the group by value is in South African assets with the balance of 51% in Spain.

Despite the top line pressure Vukile’s strategy of simplifying its corporate structure allowed them to provide R467 million of rental relief ending the year with low portfolio vacancy rates of 3.2% in South Africa and 1.7% in Spain. Rental collection rates of more than 95% were seen in Spain and more than 98% in South Africa supported by the relief and the return of shoppers following the easing of lockdown restrictions.
The balance sheet strengthened over the period as debt reduced by R3.1bn with loan-to-value reducing to 42.8% from 46.1% during the year as a result. The reduction in balance sheet debt was largely supported by the sale of its 34.9% holding in Atlantic Leaf for R1.1bn. Vukile has guided to reduce its gearing to around 40% over the medium term through a combination of the sale of non-core assets, increased retained earnings and the introduction of equity partners in Castellana (Spanish assets).
When looking at footfall and sales in the Southern African retail portfolio in particular, March 2021 footfall recovered to 99% of the comparable period while sales exceeded those generated in the 2H period. In addition, Vukile noted sales rebounding faster than footfall which continues the trend of larger basket sizes, less frequent visits and more focused shopping. Similarly to the SA retailers and banks, Vukile have noted a much stronger consumer than expected.

Vukile currently trades on a 12 month forward dividend yield of 8% with a discount to underlying NAV of 40%. In our opinion this disconnect appears severe given their resilient performance and ability to strengthen their balance sheet in very challenging conditions. We remain holders of Vukile and buyers on appropriate portfolios.

International Section
By the numbers | Earnings growth set to continue | Stock Comments
Local Section
By the numbers | SA consumer, heathier than you think | Stock Comments
Closing Comments
This month we have deliberately tried to steer clear of yet another yield curve discussion, but this doesn’t lessen the potential it has to disrupt the status quo. However, as we know, great companies have a way of navigating challenging conditions effectively if they are given enough time and support to do so.
As we reflect on the companies we own on behalf of our clients, we’re increasingly pleased with what we see and look forward to a strong positive contribution from our latest additions.
Stay warm if you’re based in chilly Johannesburg, we’re now halfway through Winter with Spring just over the crest now.

