

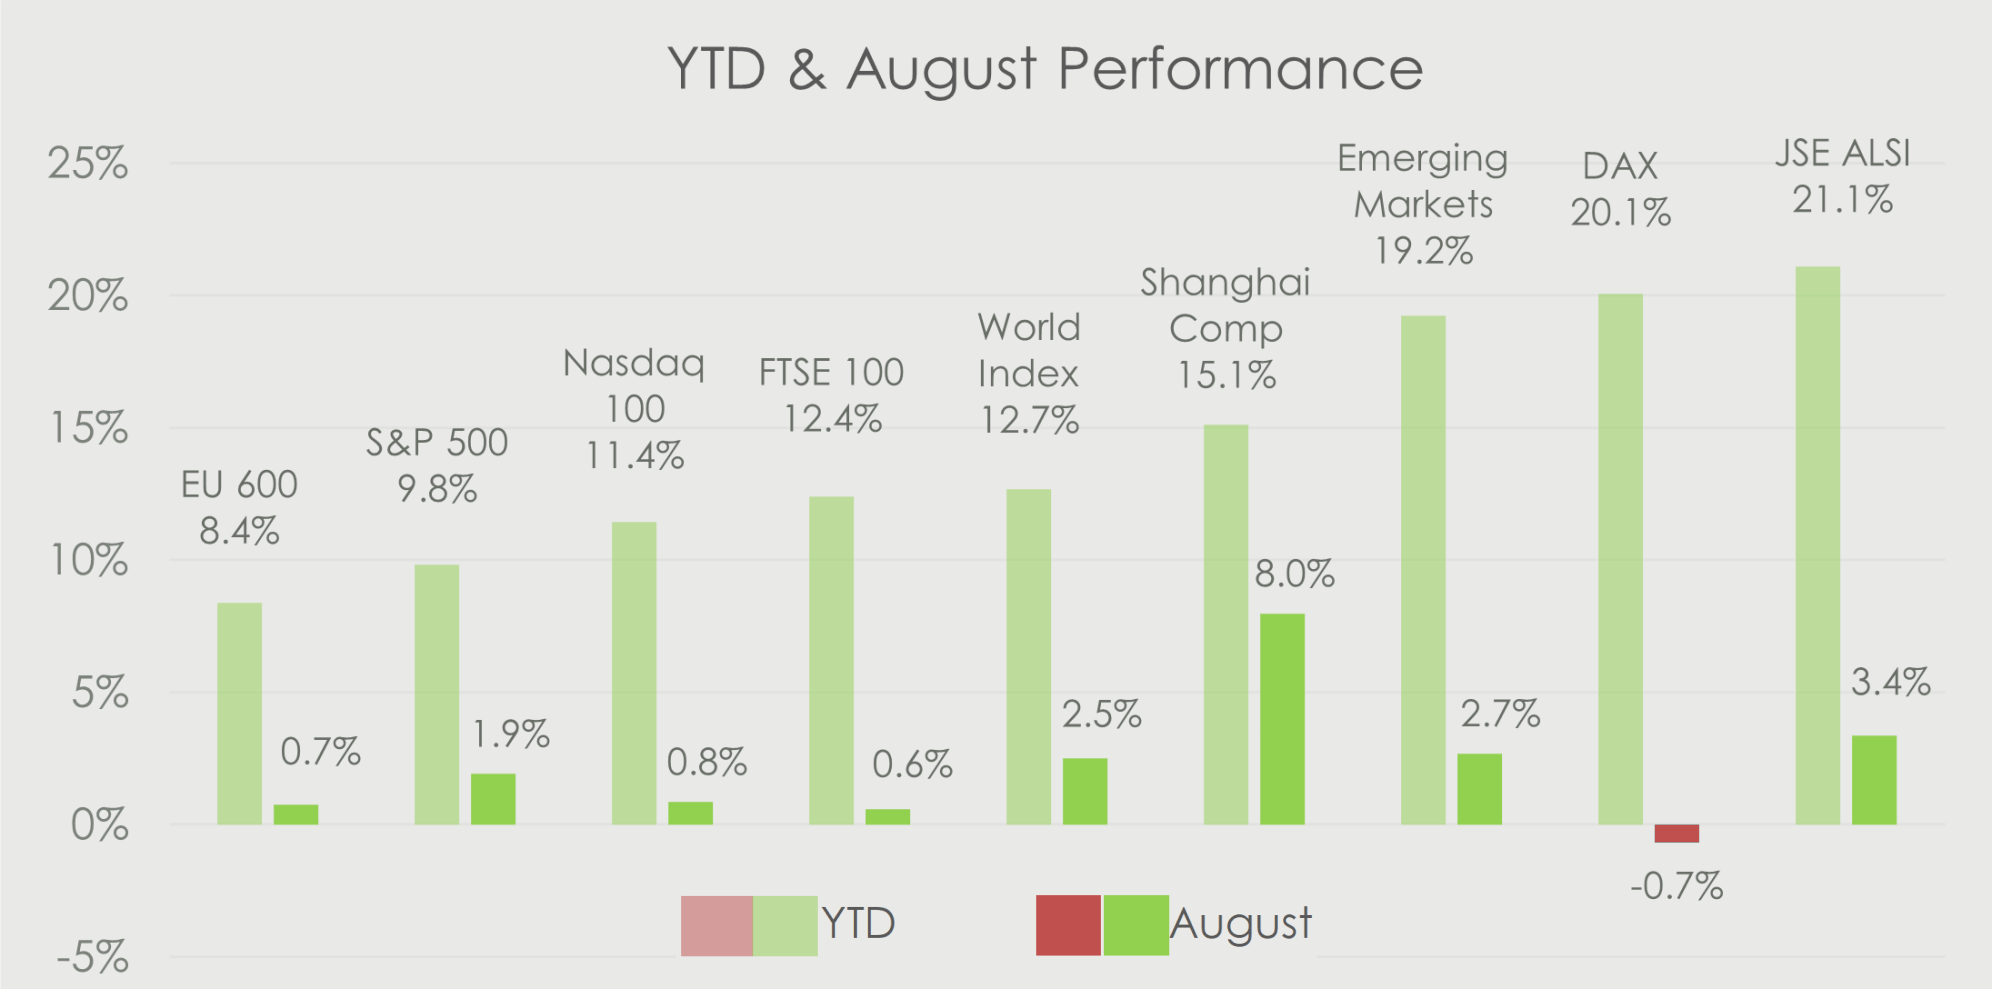
August was another solid month for global equity performance
August marked the end of second quarter earnings reporting season in the U.S. Once again, corporate America goes from strength to strength, earnings came in 7.2% ahead of expectations, delivering growth of 12%. Additionally, earnings estimates for FY25 have also increased to 10.6% Y/Y growth versus prior forecasts of 8.9% growth.
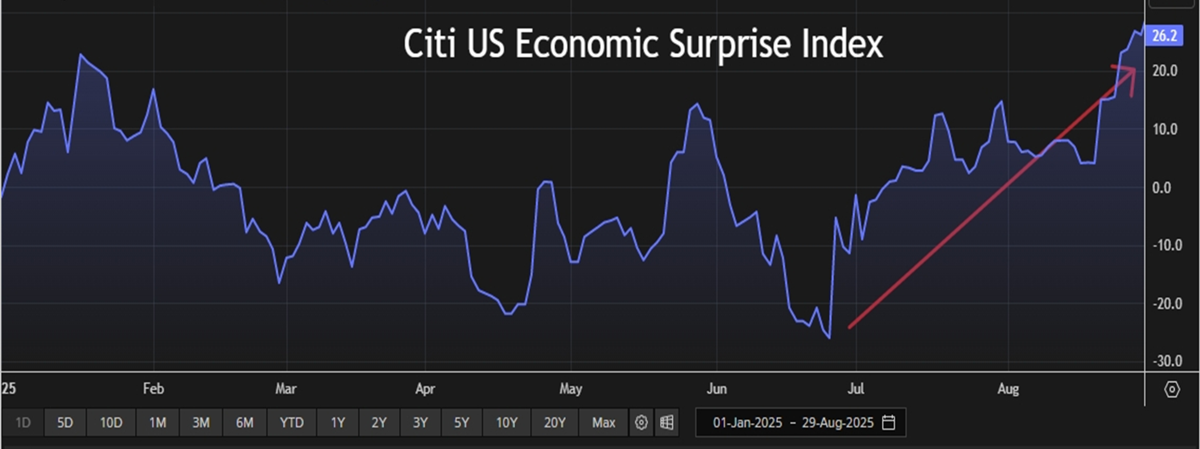
The strength in corporate earnings correlates well with Citi Group’s Economic Surprise index which has been showing economic data points continue to surprise to the upside. While its maybe a little too early to make concrete conclusions, U.S. tariffs have yet to have the negative impact on growth that most had expected in April. The U.S. economy & Corporate America appear to be well placed for now and supportive of current market valuations.
The Fed Turns Dovish
Going into August, the focus was firmly on the Fed and the direction of travel for interest rates heading into the final three FOMC meetings of the year (September, October and December). Given the split decision to keep rates on hold in July, investors began to speculate that September would be a live meeting. At the press conference, Jerome Powell noted, “the Economy is in a solid position, and the current stance of monetary policy leaves us well positioned to respond in a timely way to potential economic developments”.
July’s Non-Farm Payroll data – which came out a couple of days after the FOMC meeting – threw the cat among the pigeons. Jobs growth came in weaker than expected at 76k, compounding this was the revision of the previous two months, reducing jobs previously stated by 258k.
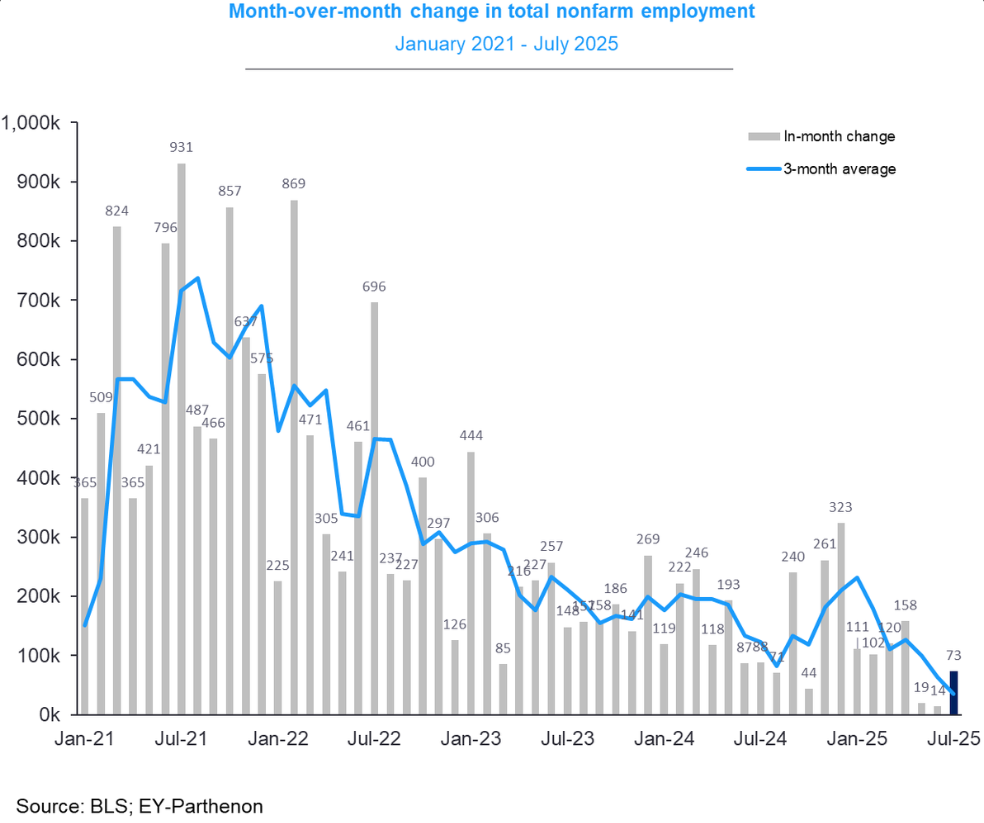
Thus, providing a picture of a much weaker labour market than previously thought. Trump subsequently fired the head of the BLS (Bureau of Labour Statistics).
At the meeting of Central Bankers in Jackson Hole a few weeks later, Chairmen Powell changed his rhetoric on rates:
“Nonetheless, with policy in restrictive territory, the baseline outlook and the shifting balance of risks may warrant adjusting our policy stance” and “This unusual situation suggests that downside risks to employment are rising. And if those risks materialize, they can do so quickly in the form of sharply higher layoffs and rising unemployment.”
Investors quickly began to price in three cuts for the rest of the year.
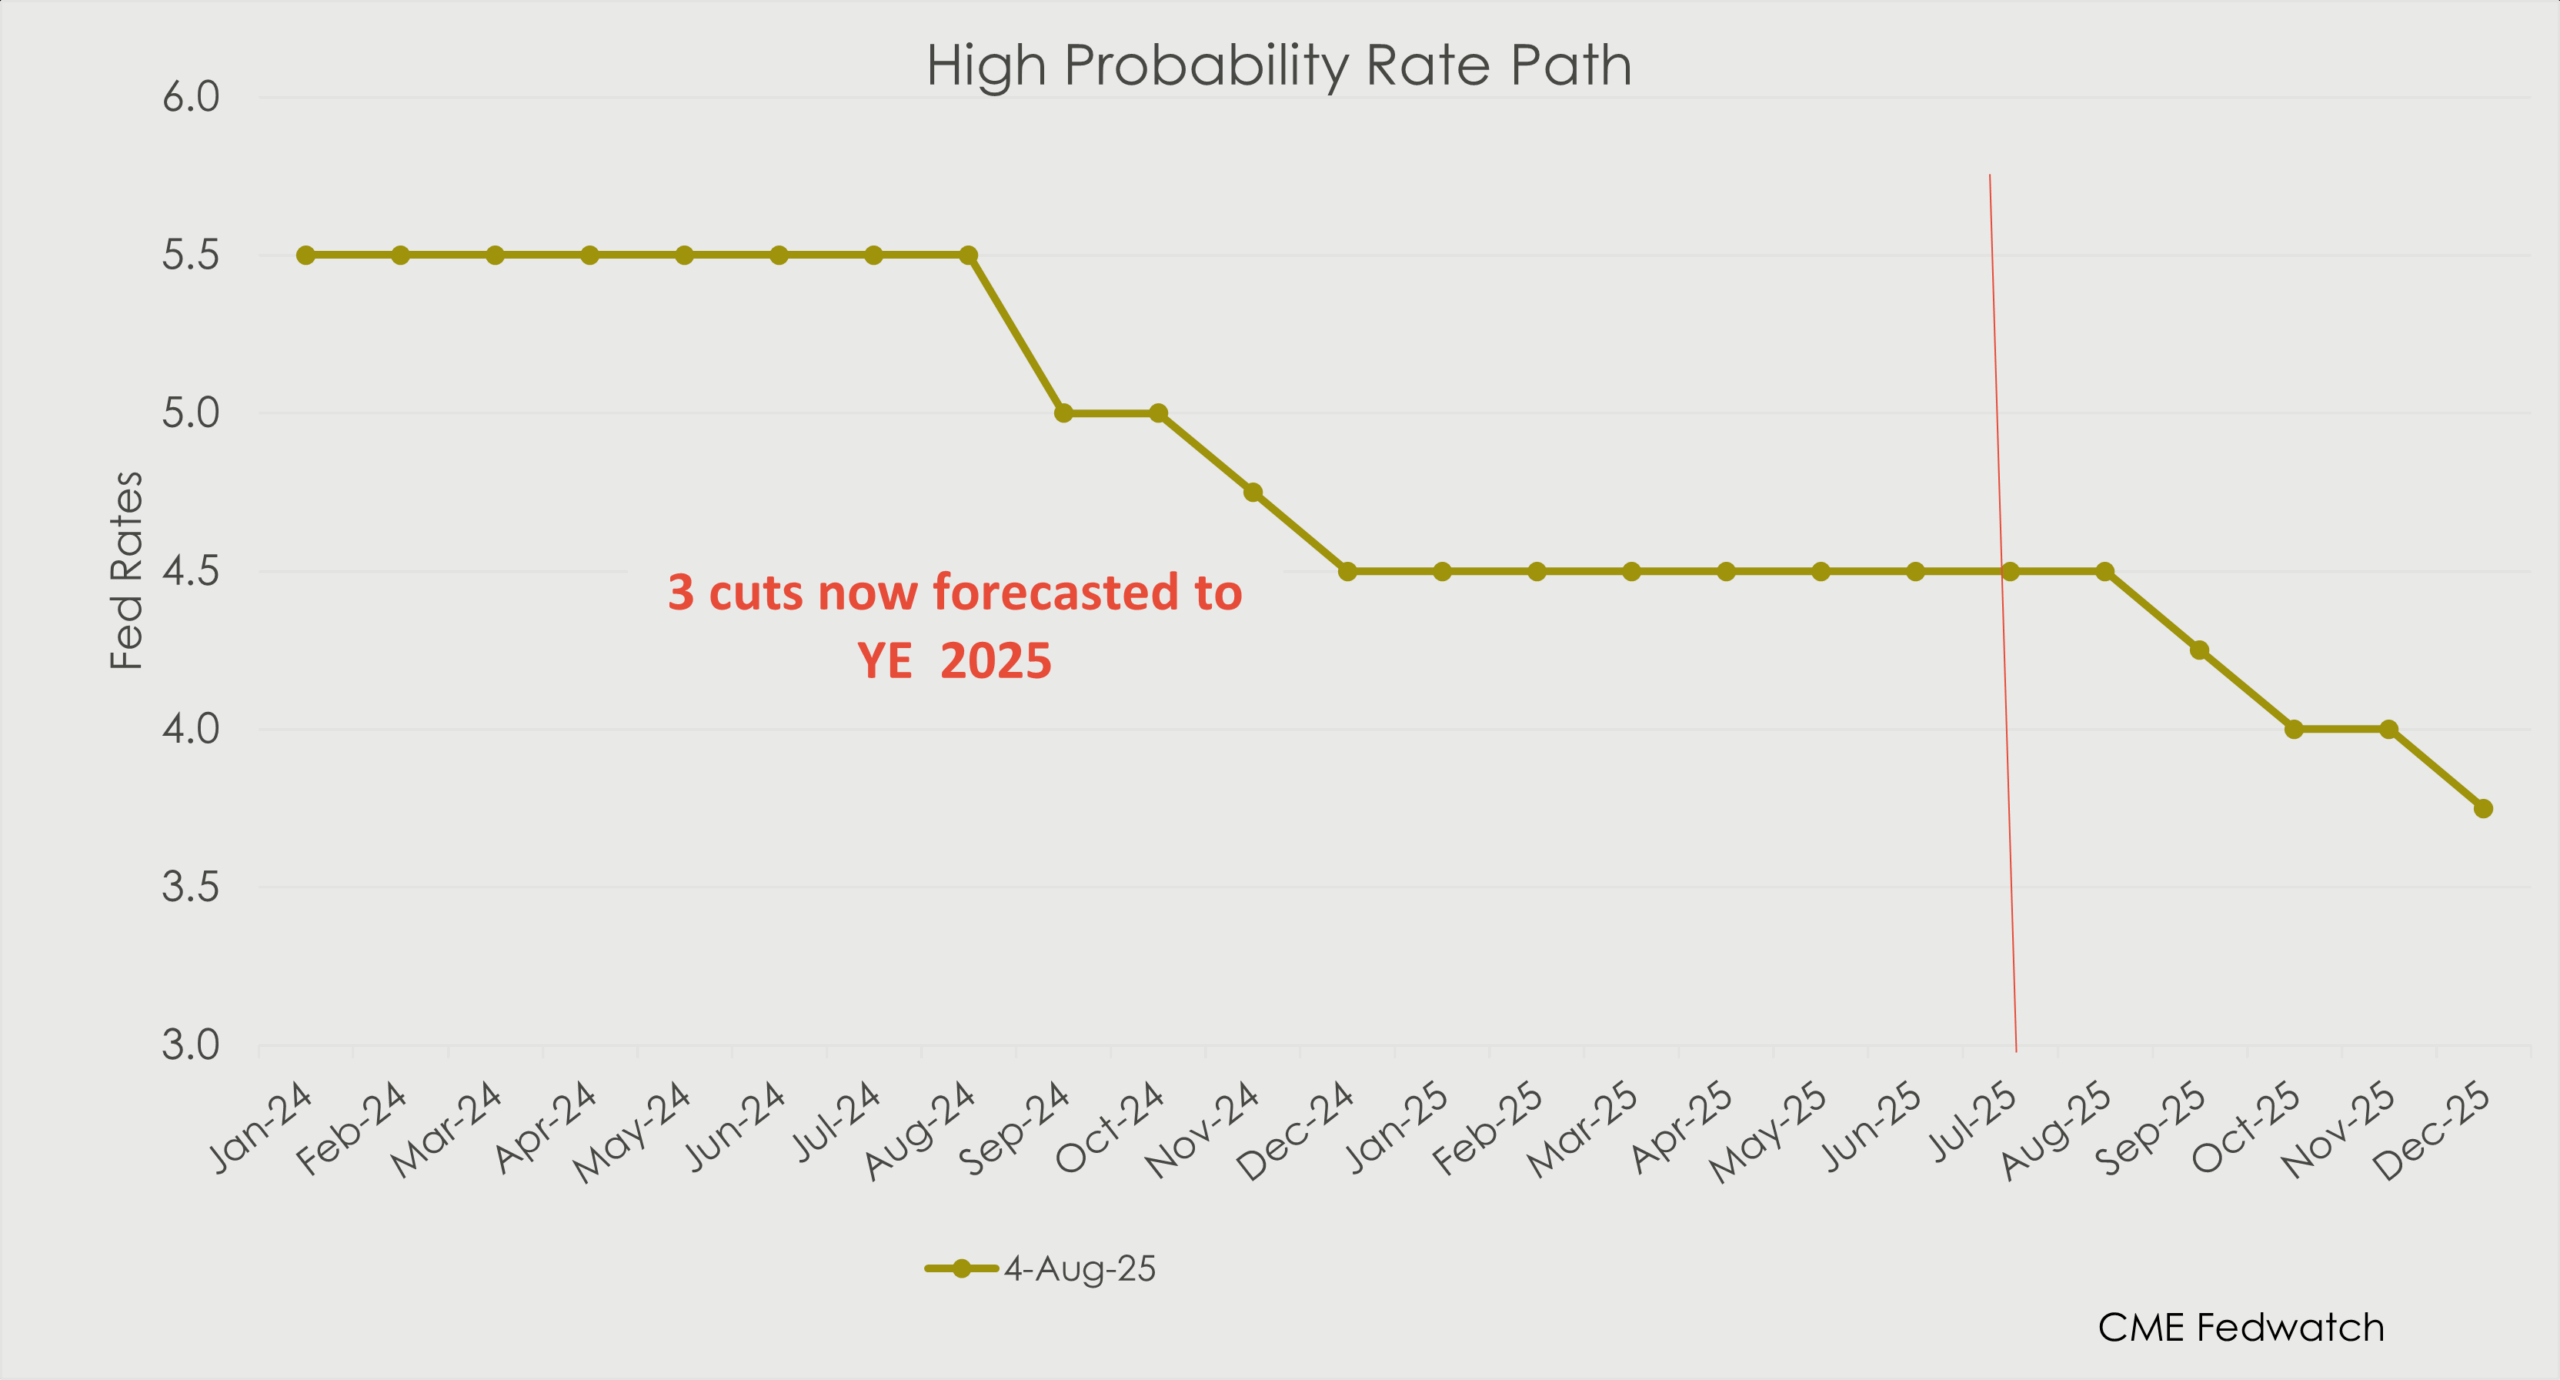
From the Equity market perspective, the current situation remains conducive to equity outperformance; economic activity remains resilient, and monetary policy is about to become looser. Markets continued to break through all-time highs in August.
Policy Uncertainty Receding
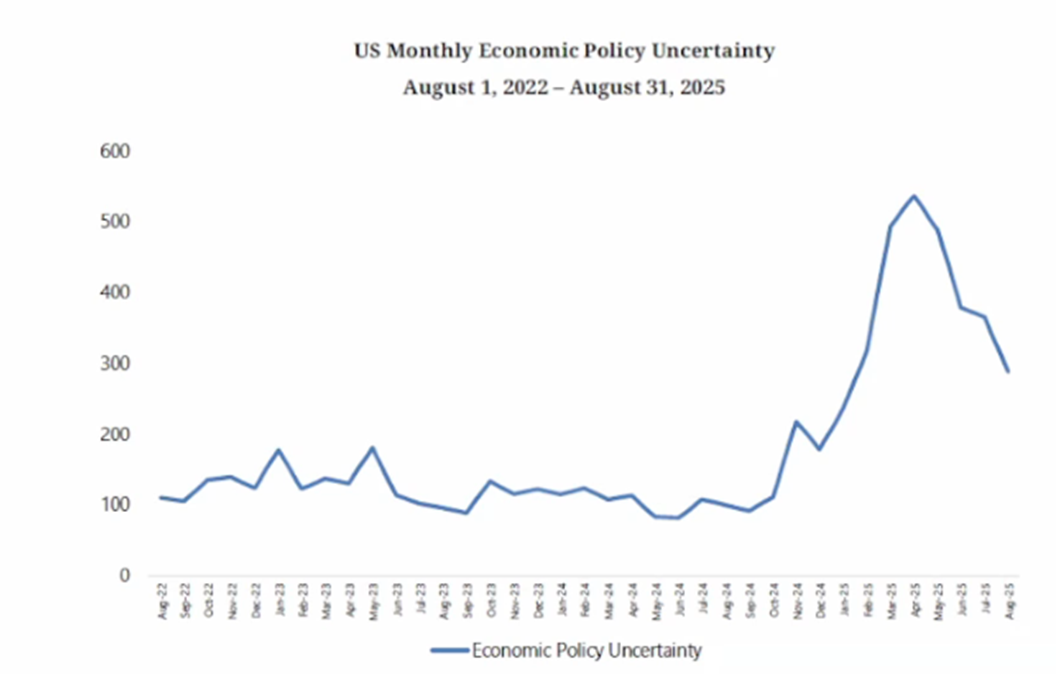
As we move towards the end of the year, President Trump continues his authoritarian drive, aiming for control across all aspects of the U.S. economy; from tariffs to interest rates and everything in between. Despite the current status quo, investors seem to have become more accepting of Trump’s modus operandi as the political uncertainty index continues to recede from its April highs. This normalization in political uncertainty has given investors’ confidence to drive global markets up in tandem.
Liza touches on the real time impact we are seeing from tariffs and the revenues that they are generating. Further, we investigate what we can expect next from President Trump and his team in the form of deregulation. We could begin to see government policy that supports global markets.
On the local front, we continue to remain constructive on SA stocks, however, the economy remains stuck in “muddle through” mode. Valuations for SA equities are enticing across the board. We have been doing lots of work to determine what is required to see multiple expansion in SA cyclicals that will drive significant outperformance. The magic number seems to be a GDP growth rate of 1.4% plus. Anda takes us through what he thinks is require to attain the magic number.
Additionally, we take a look at some portfolio changes we made in August.
We hope you enjoy this month’s Wood for the Trees.
International section

By the Numbers
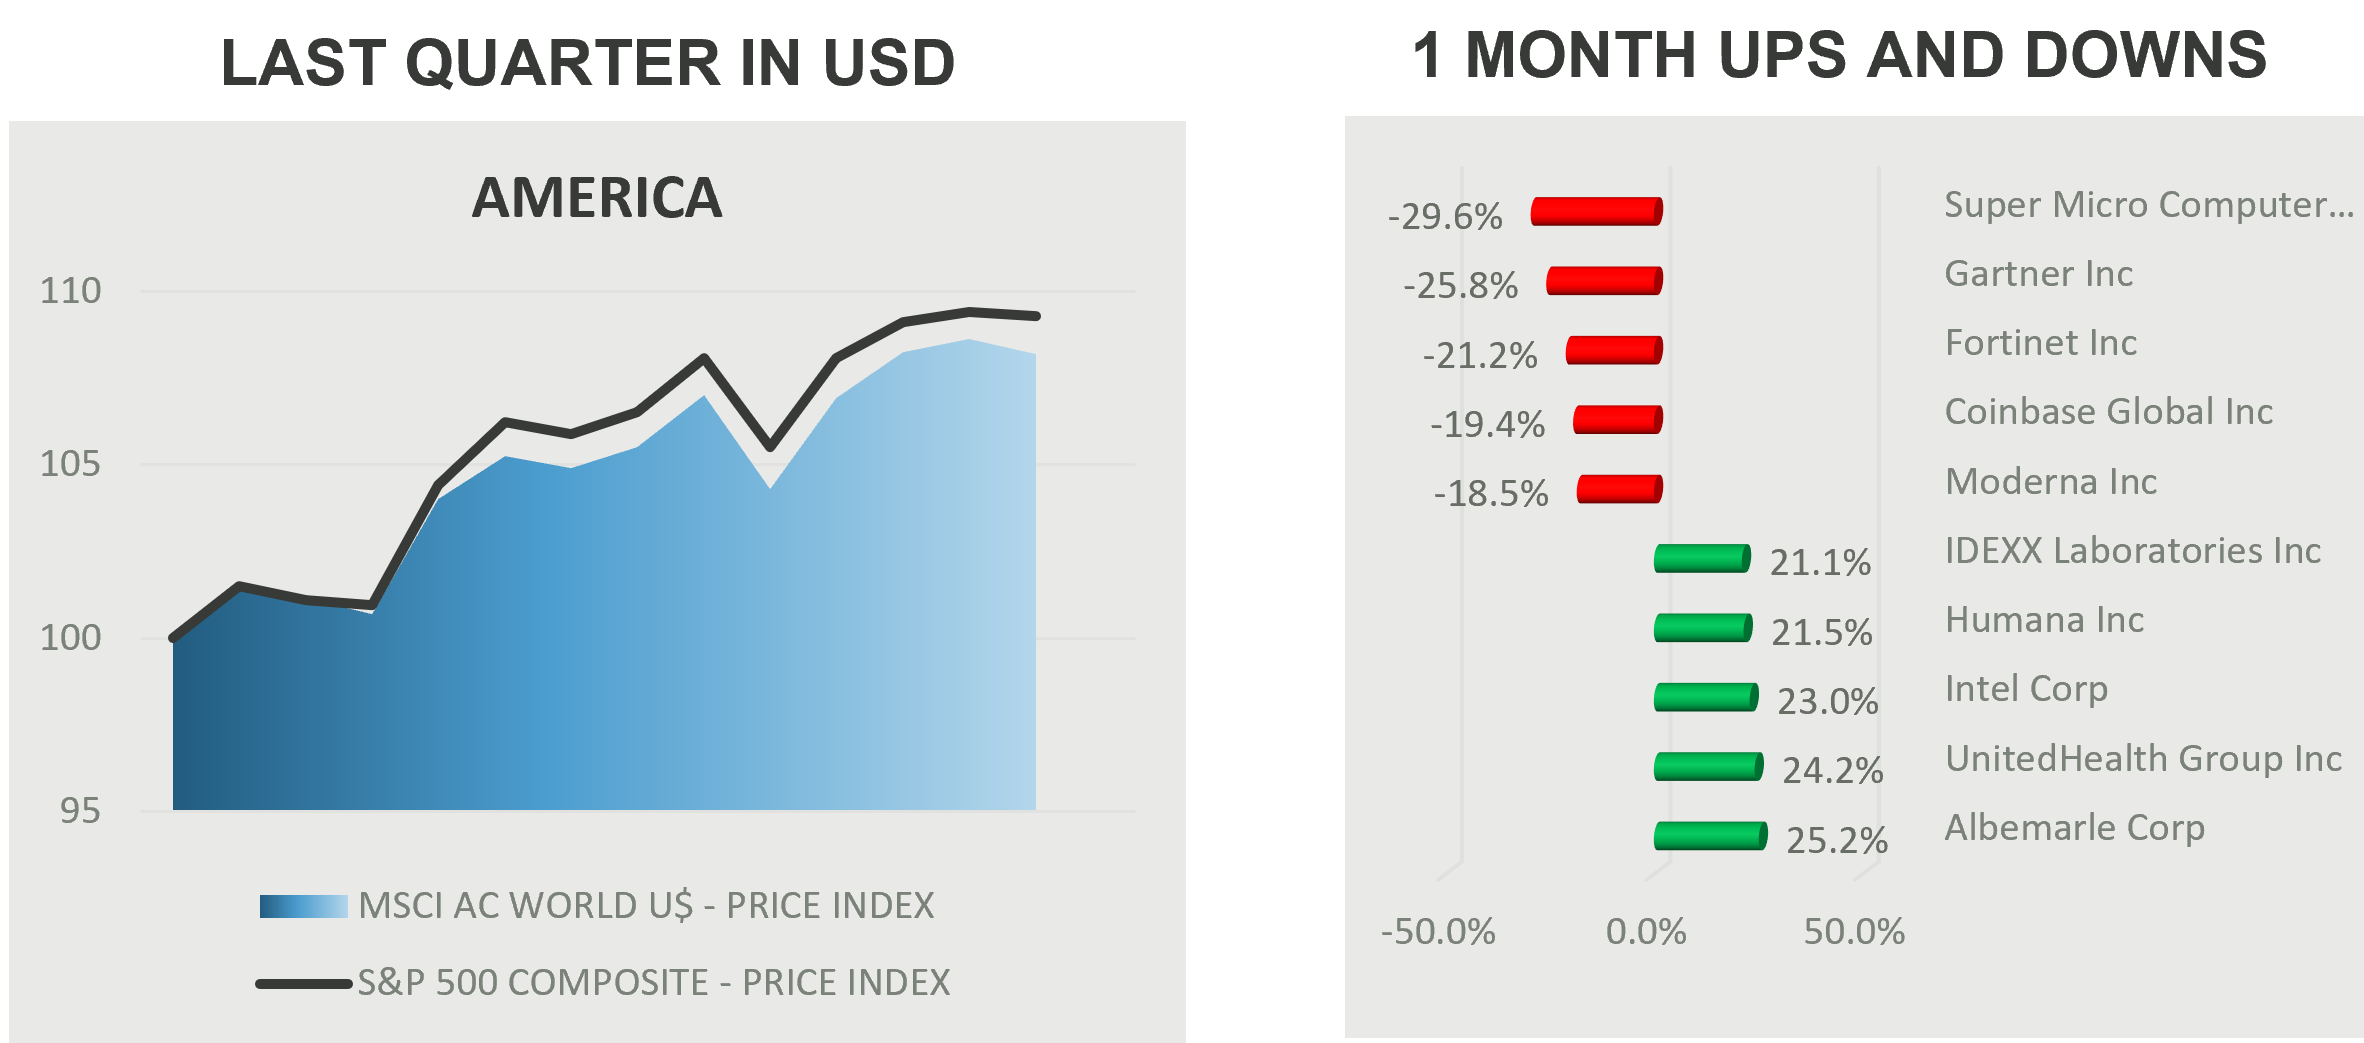
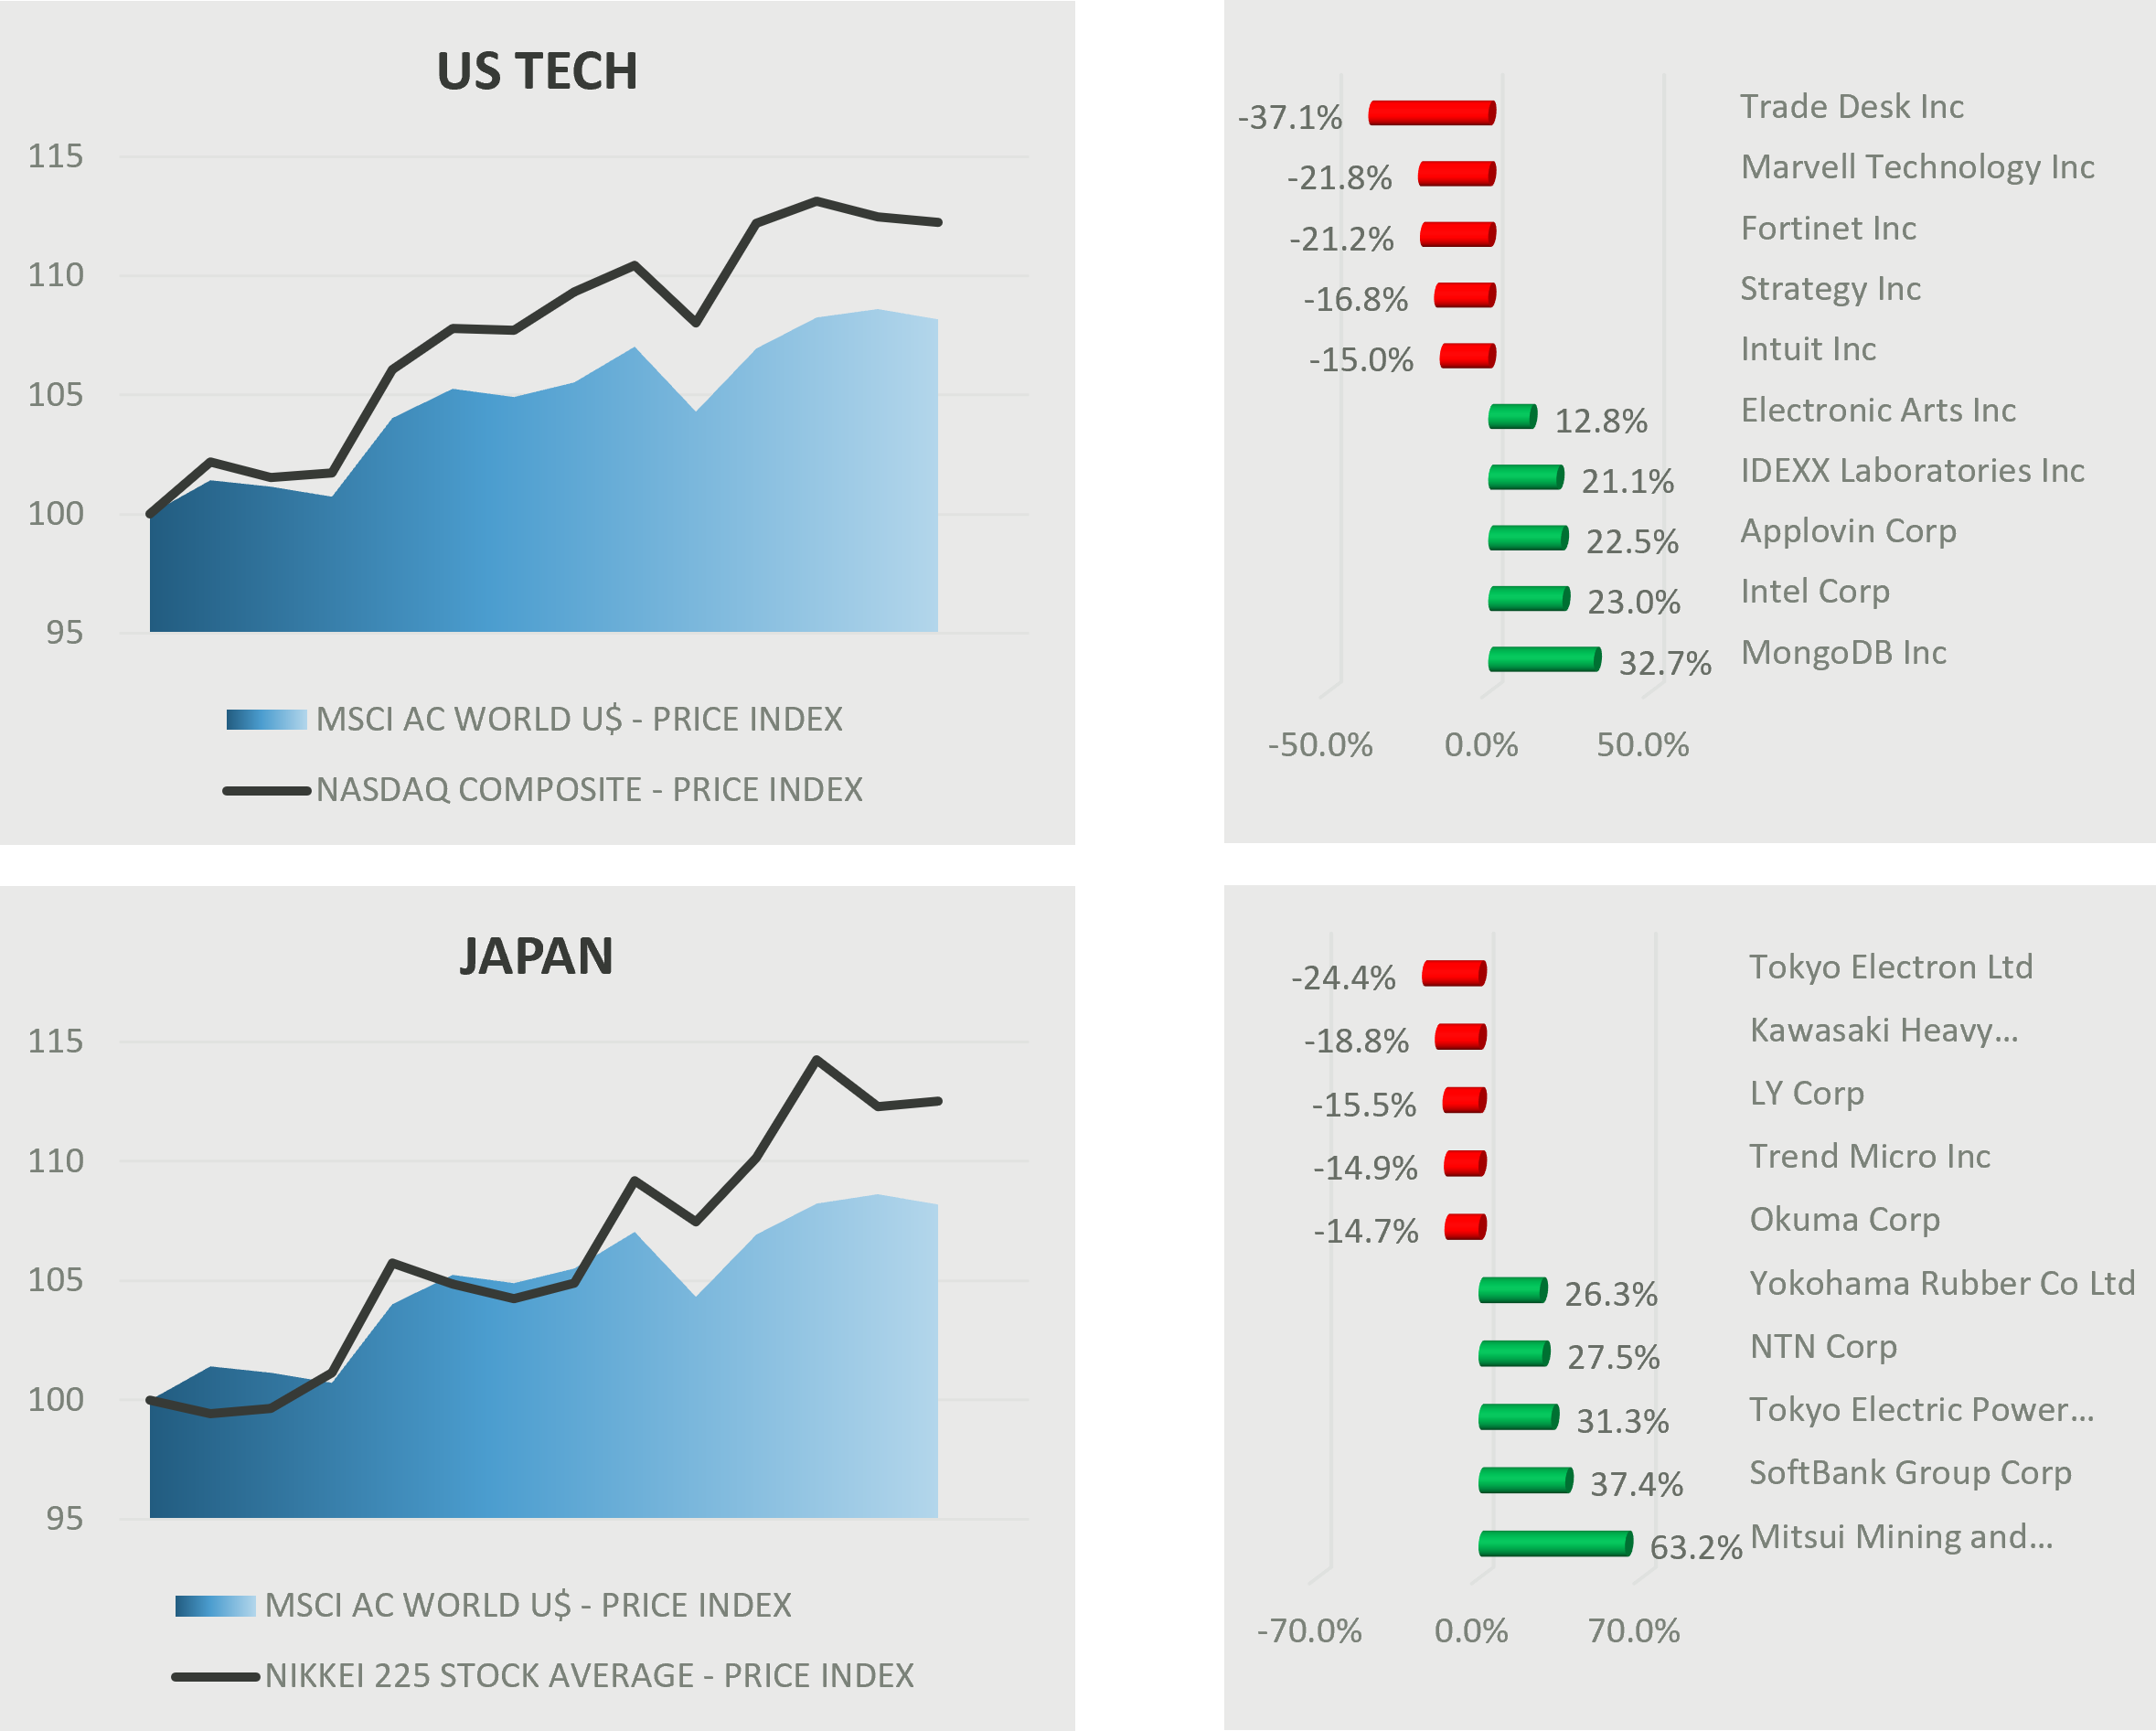
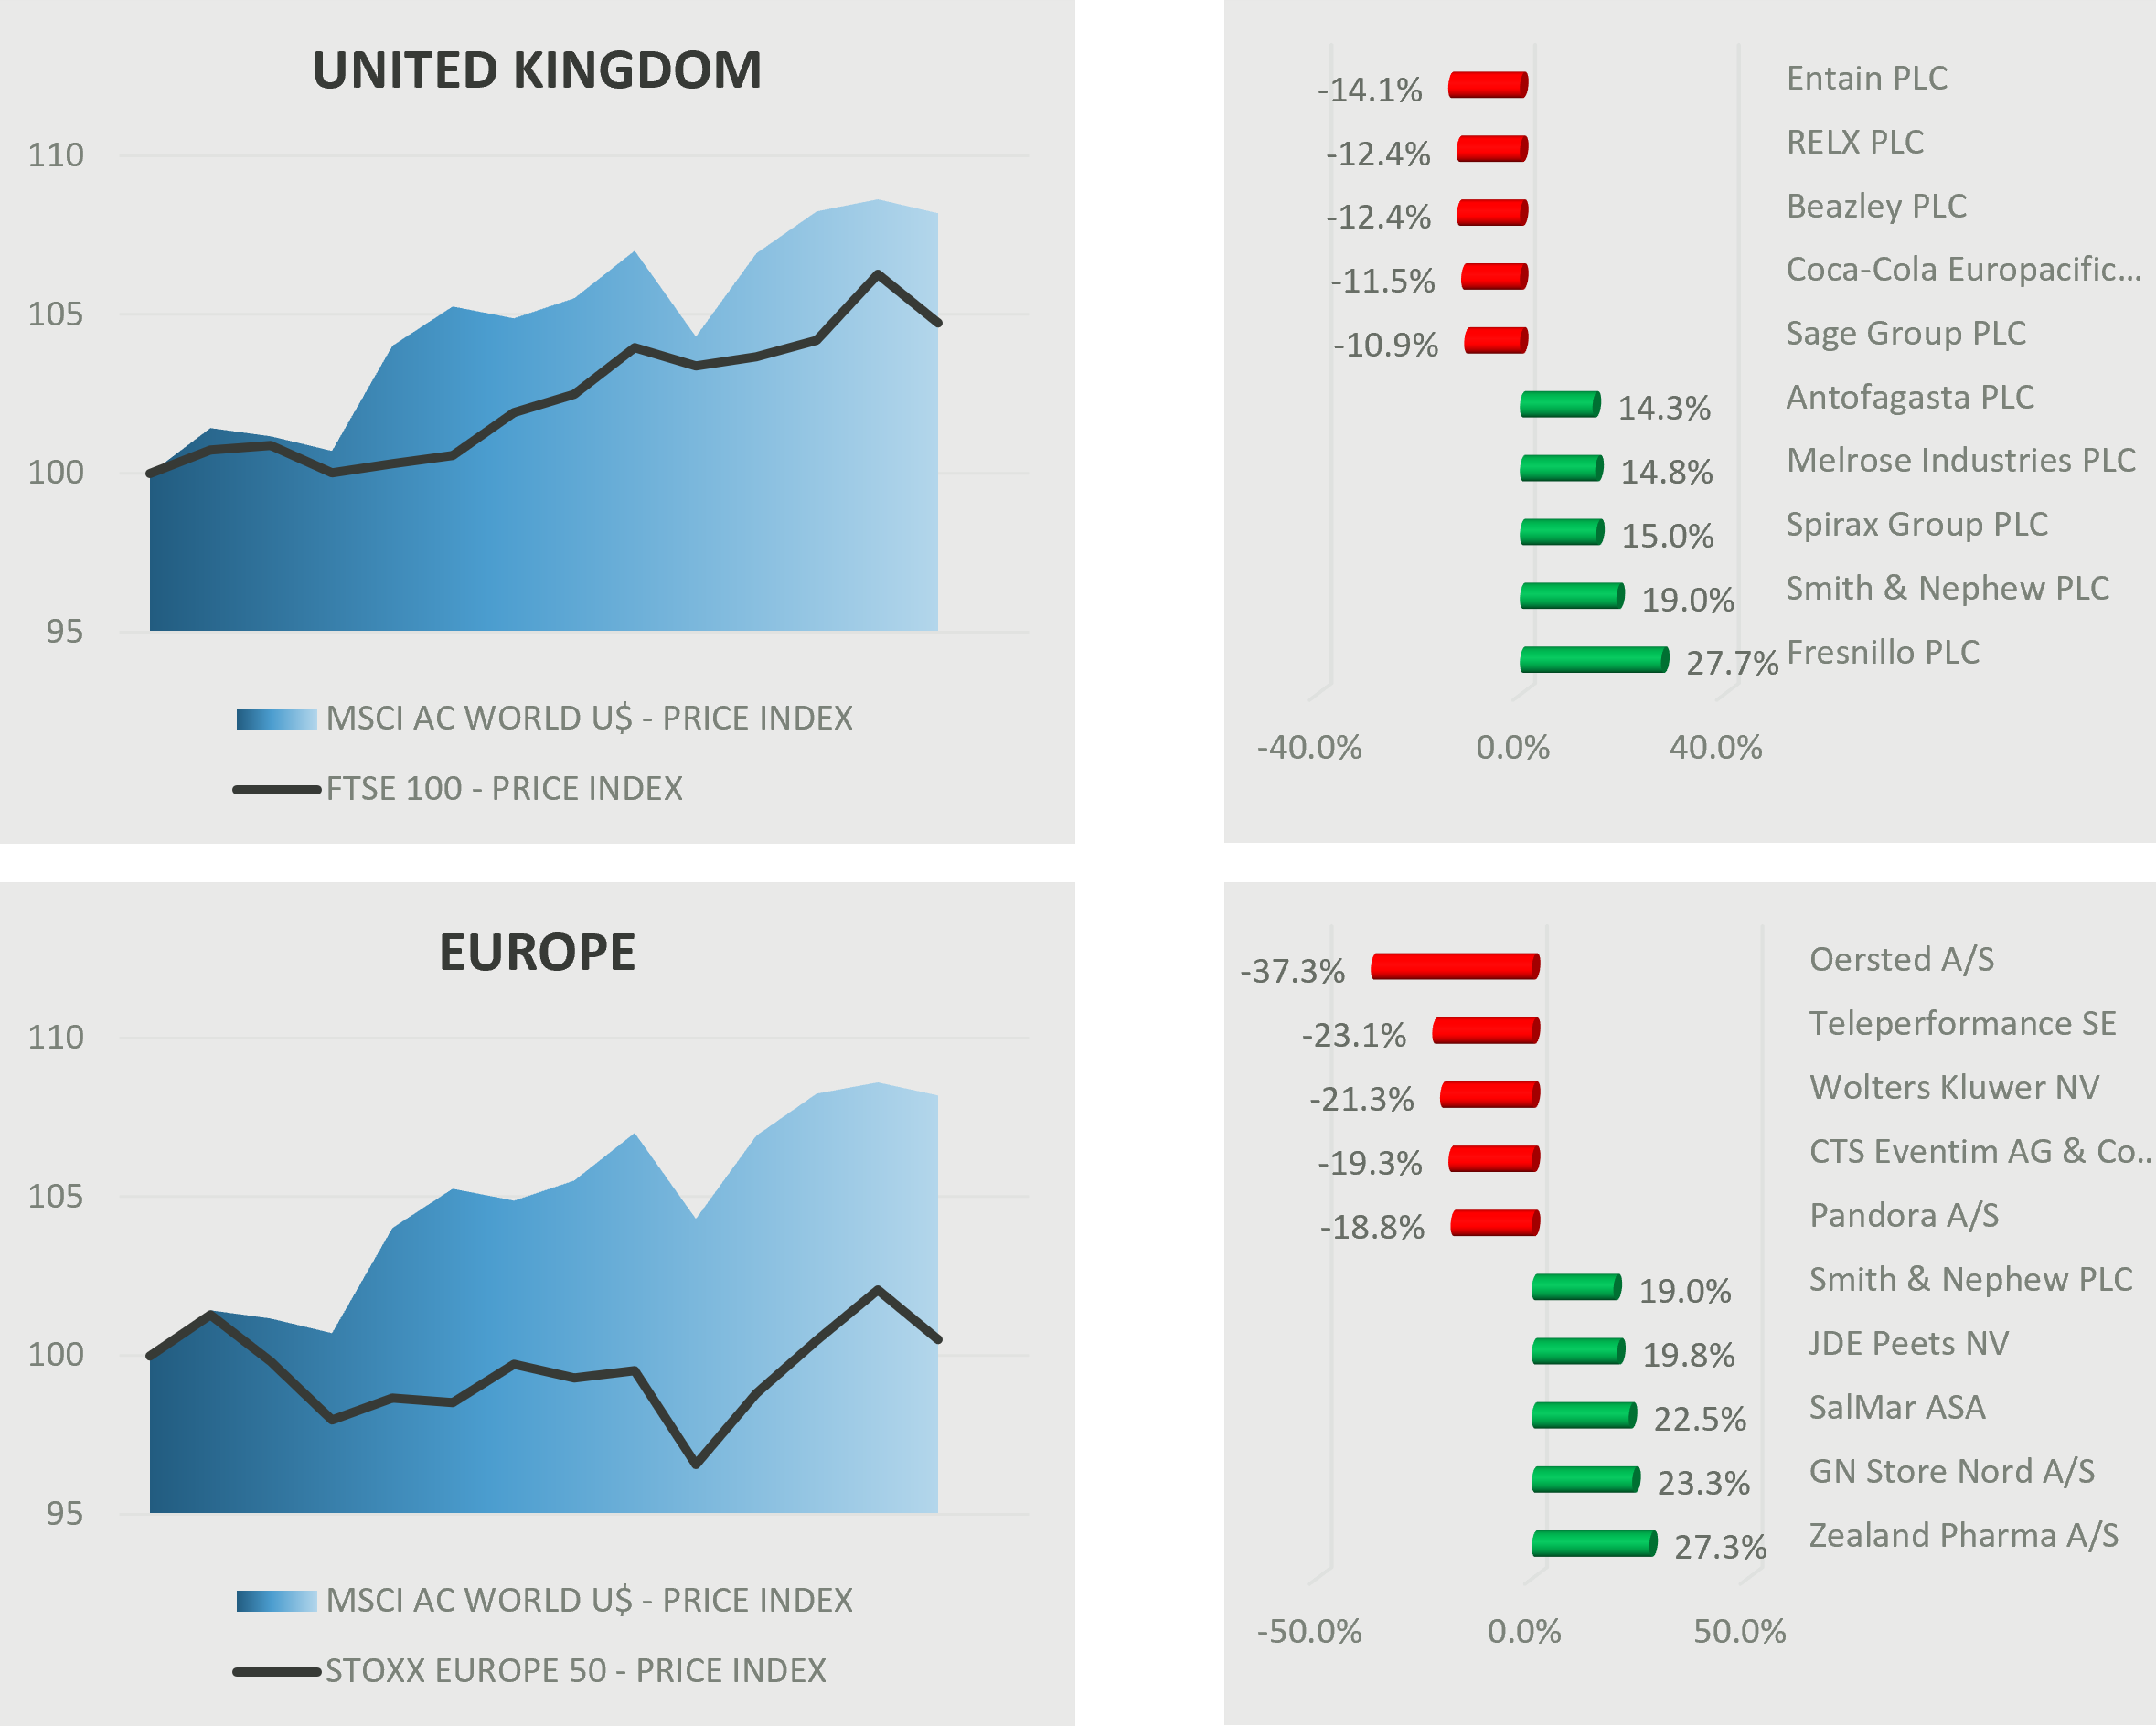
Global markets moved higher in August, with the S&P 500 and Nasdaq both extending their record-setting run and continuing to outperform European markets. U.S. gains were underpinned by strong corporate earnings, positive economic data, and expectations of an interest rate cut by the Fed in September.
Specialty chemical company Albemarle (+25.2%) surged after releasing stronger-than-expected Q2 results, surprising investors compared with a loss last year. UnitedHealth (+24.2%) rallied after Berkshire Hathaway disclosed a $1.6 billion stake, and Humana (+21.5%) moved higher in sympathy. Moderna (-18.5%) fell as sentiment remained soft around vaccine-related revenues.
Semiconductors were mixed: Intel (+23.0%) climbed after securing nearly $5.7 billion in U.S. CHIPS Act funding, while Marvell Technology (-21.8%) fell on cautious guidance. Broader technology delivered outsized moves, with MongoDB (+32.7%) reporting strong earnings beat and raising full-year outlook, as well as AppLovin (+22.5%) who was supported by robust advertising growth. By contrast, The Trade Desk (-37.1%) plunged on weak digital ad spending trends, while Fortinet (-21.2%) slipped in cybersecurity. Coinbase (-19.4%) tracked weakness in cryptocurrencies.
In the UK, Fresnillo (+27.7%) shares jumped as profit surged, and benefitted further from higher silver & gold prices. Similarly, Antofagasta (+14.3%) also benefitted from favourable commodity prices. Sage Group (-10.9%) and RELX (-12.4%) fell on concerns that AI could pose a risk to the business. In Europe, Ørsted (-37.3%) slumped on renewable energy headwinds. Pandora (-18.8%) fell despite reporting in-line results, as tariff worries soured sentiment.
Chinese markets were buoyed by increasing efforts from government in chip production, as well as hopes for more stimulus measures. Consumer platform, Meituan (-15.5%) lost ground after reporting a drop in profit and missing revenue expectations. The company warned that intense competition would squeeze profit margins in the near-term. Zijin Mining (+22.1%) gained on commodity strength.

The Washington Dispatch
Trump’s second term has been dominated by trade headlines and ever-changing tariffs. However, tariff impacts have been more orderly than the headlines suggested, with investors becoming more accepting of Trump’s policies.
For equities in particular, there are supportive catalysts coming to fruition: rising tariff revenues to help fund fiscal stimulus policies (the One Big Beautiful Bill), and a push for deregulation that lowers compliance costs and unlocks investments.
Tariff Revenue Supporting Fiscal Stimulus Policies
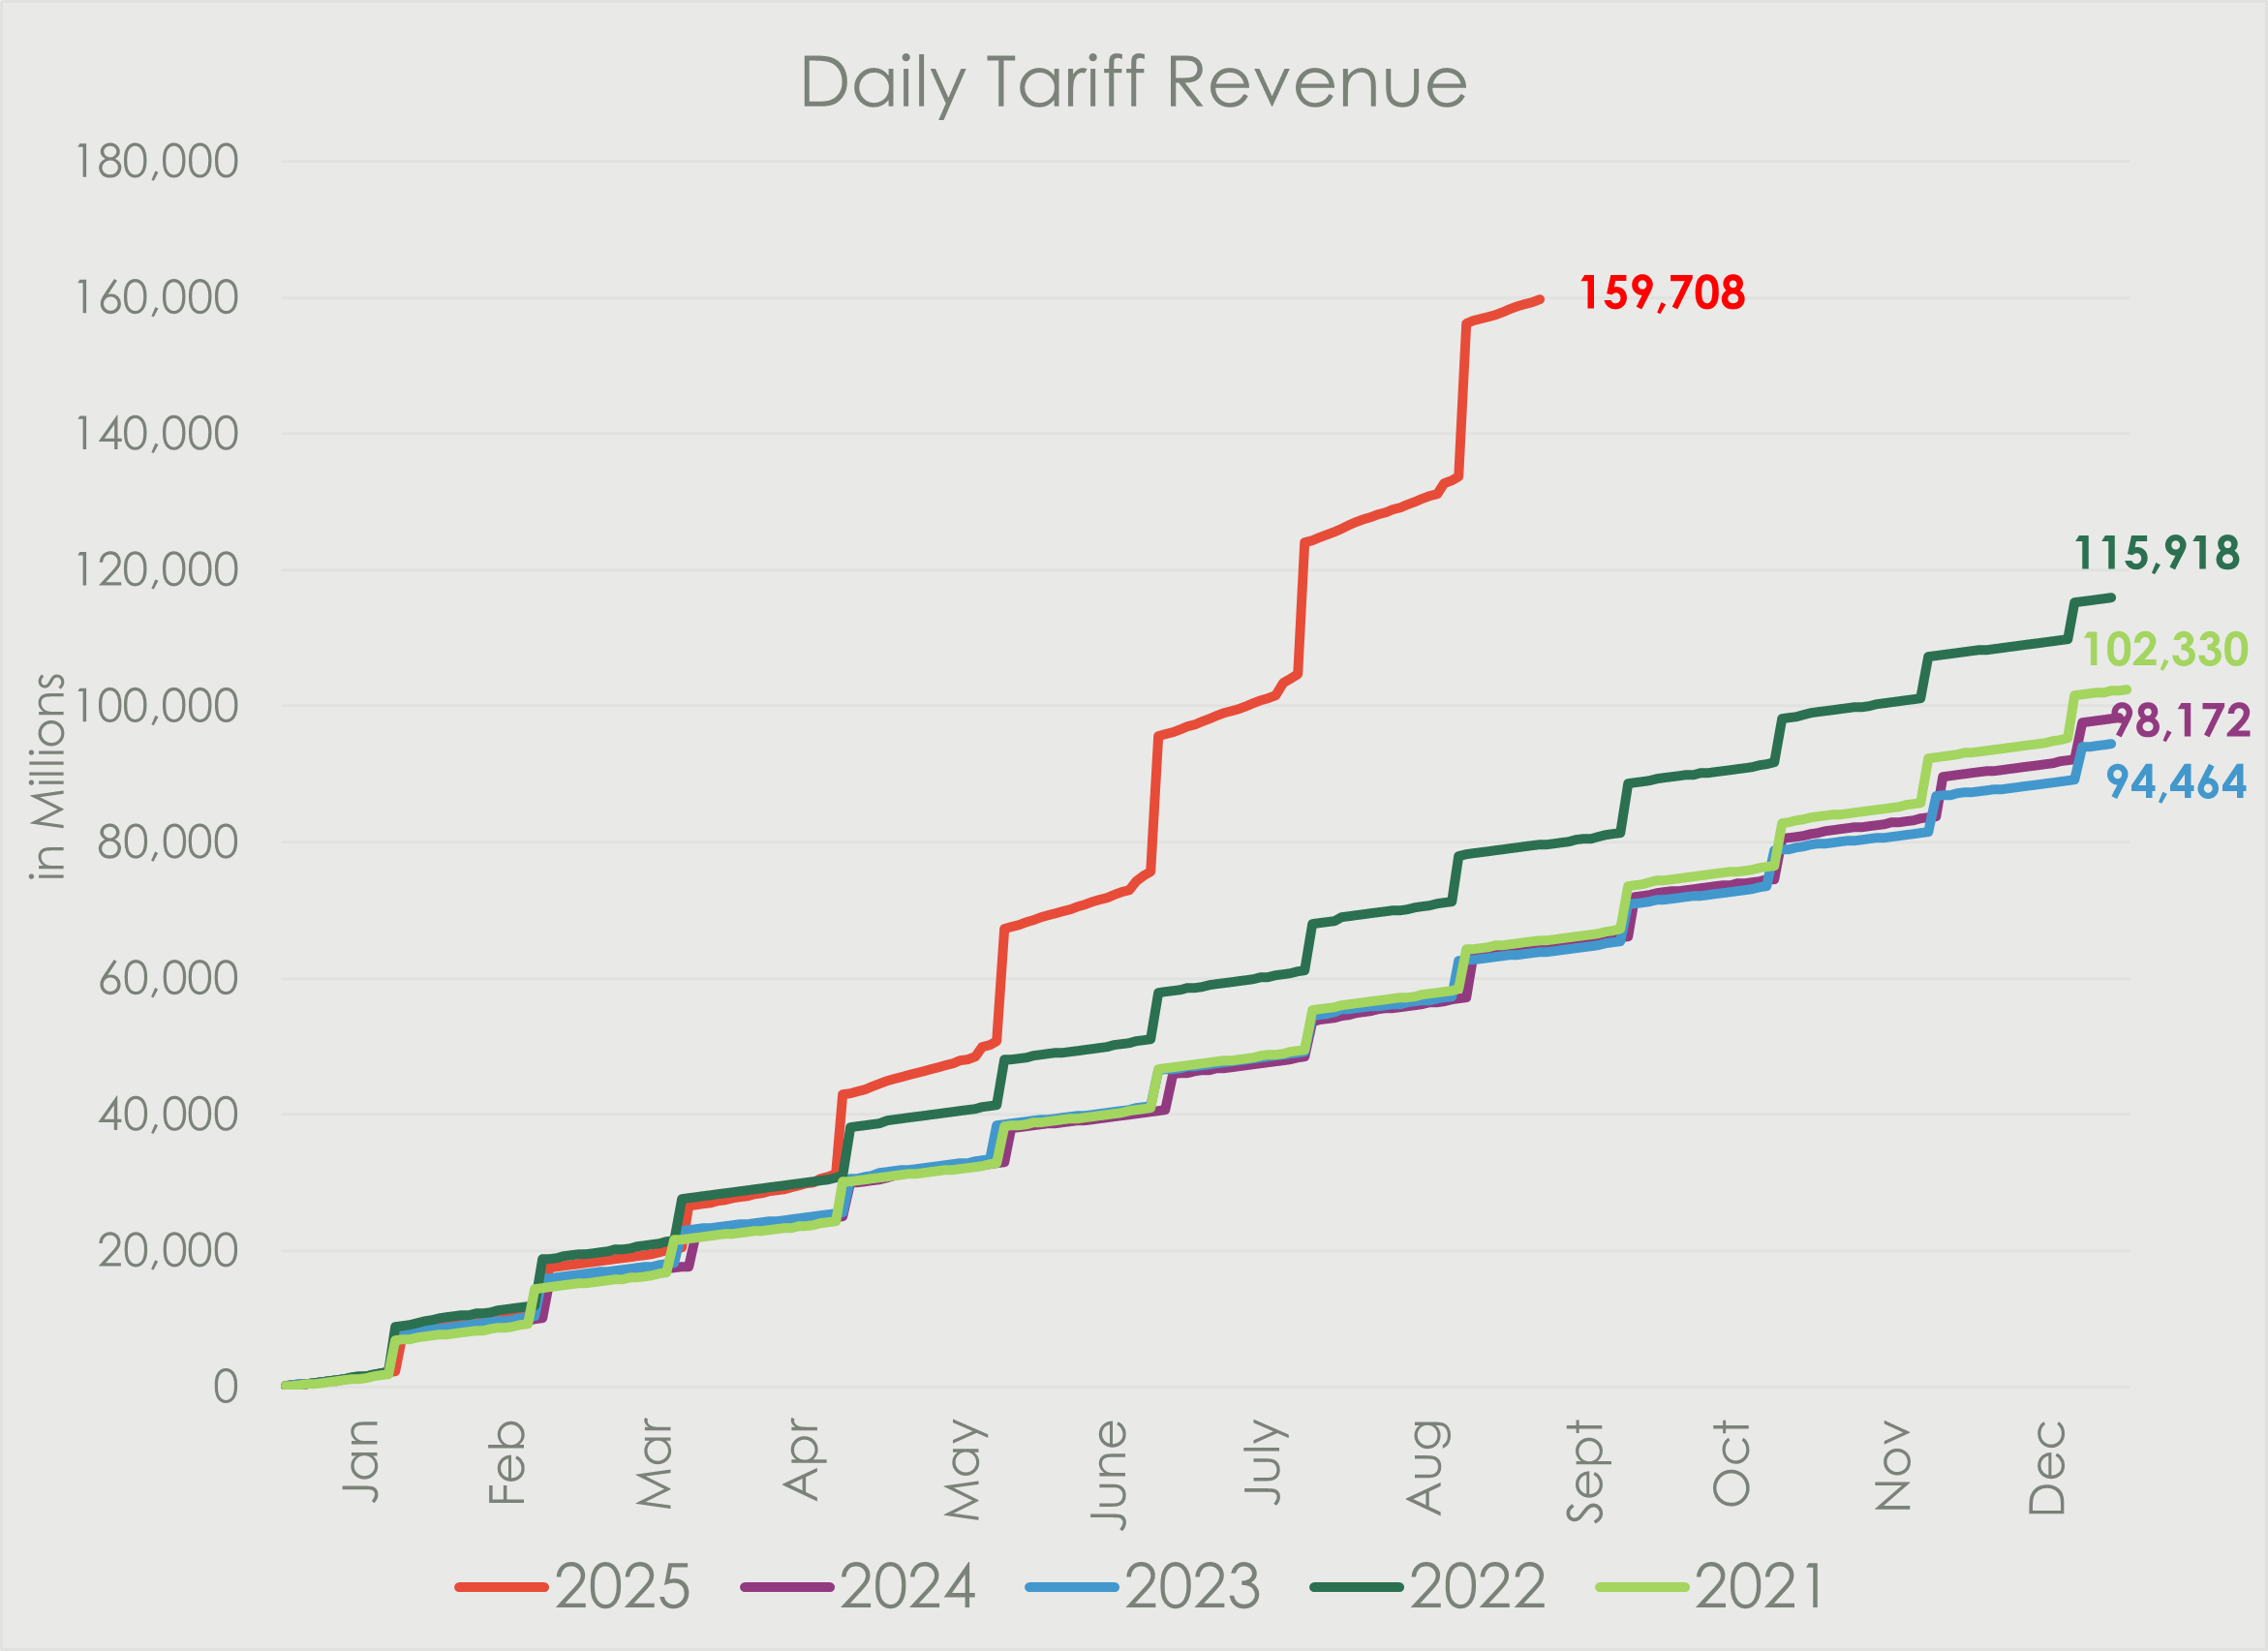
Despite all the negative connotation around tariffs, the reality is that they have generated $159bn in revenue for the U.S. government to date. These revenues will go a long way in supporting Trump’s tax-cut package (One Big Beautiful Bill) and offset federal deficits.
The graph below shows how much the U.S. Treasury Department has already received in tariff revenues compared to previous years.
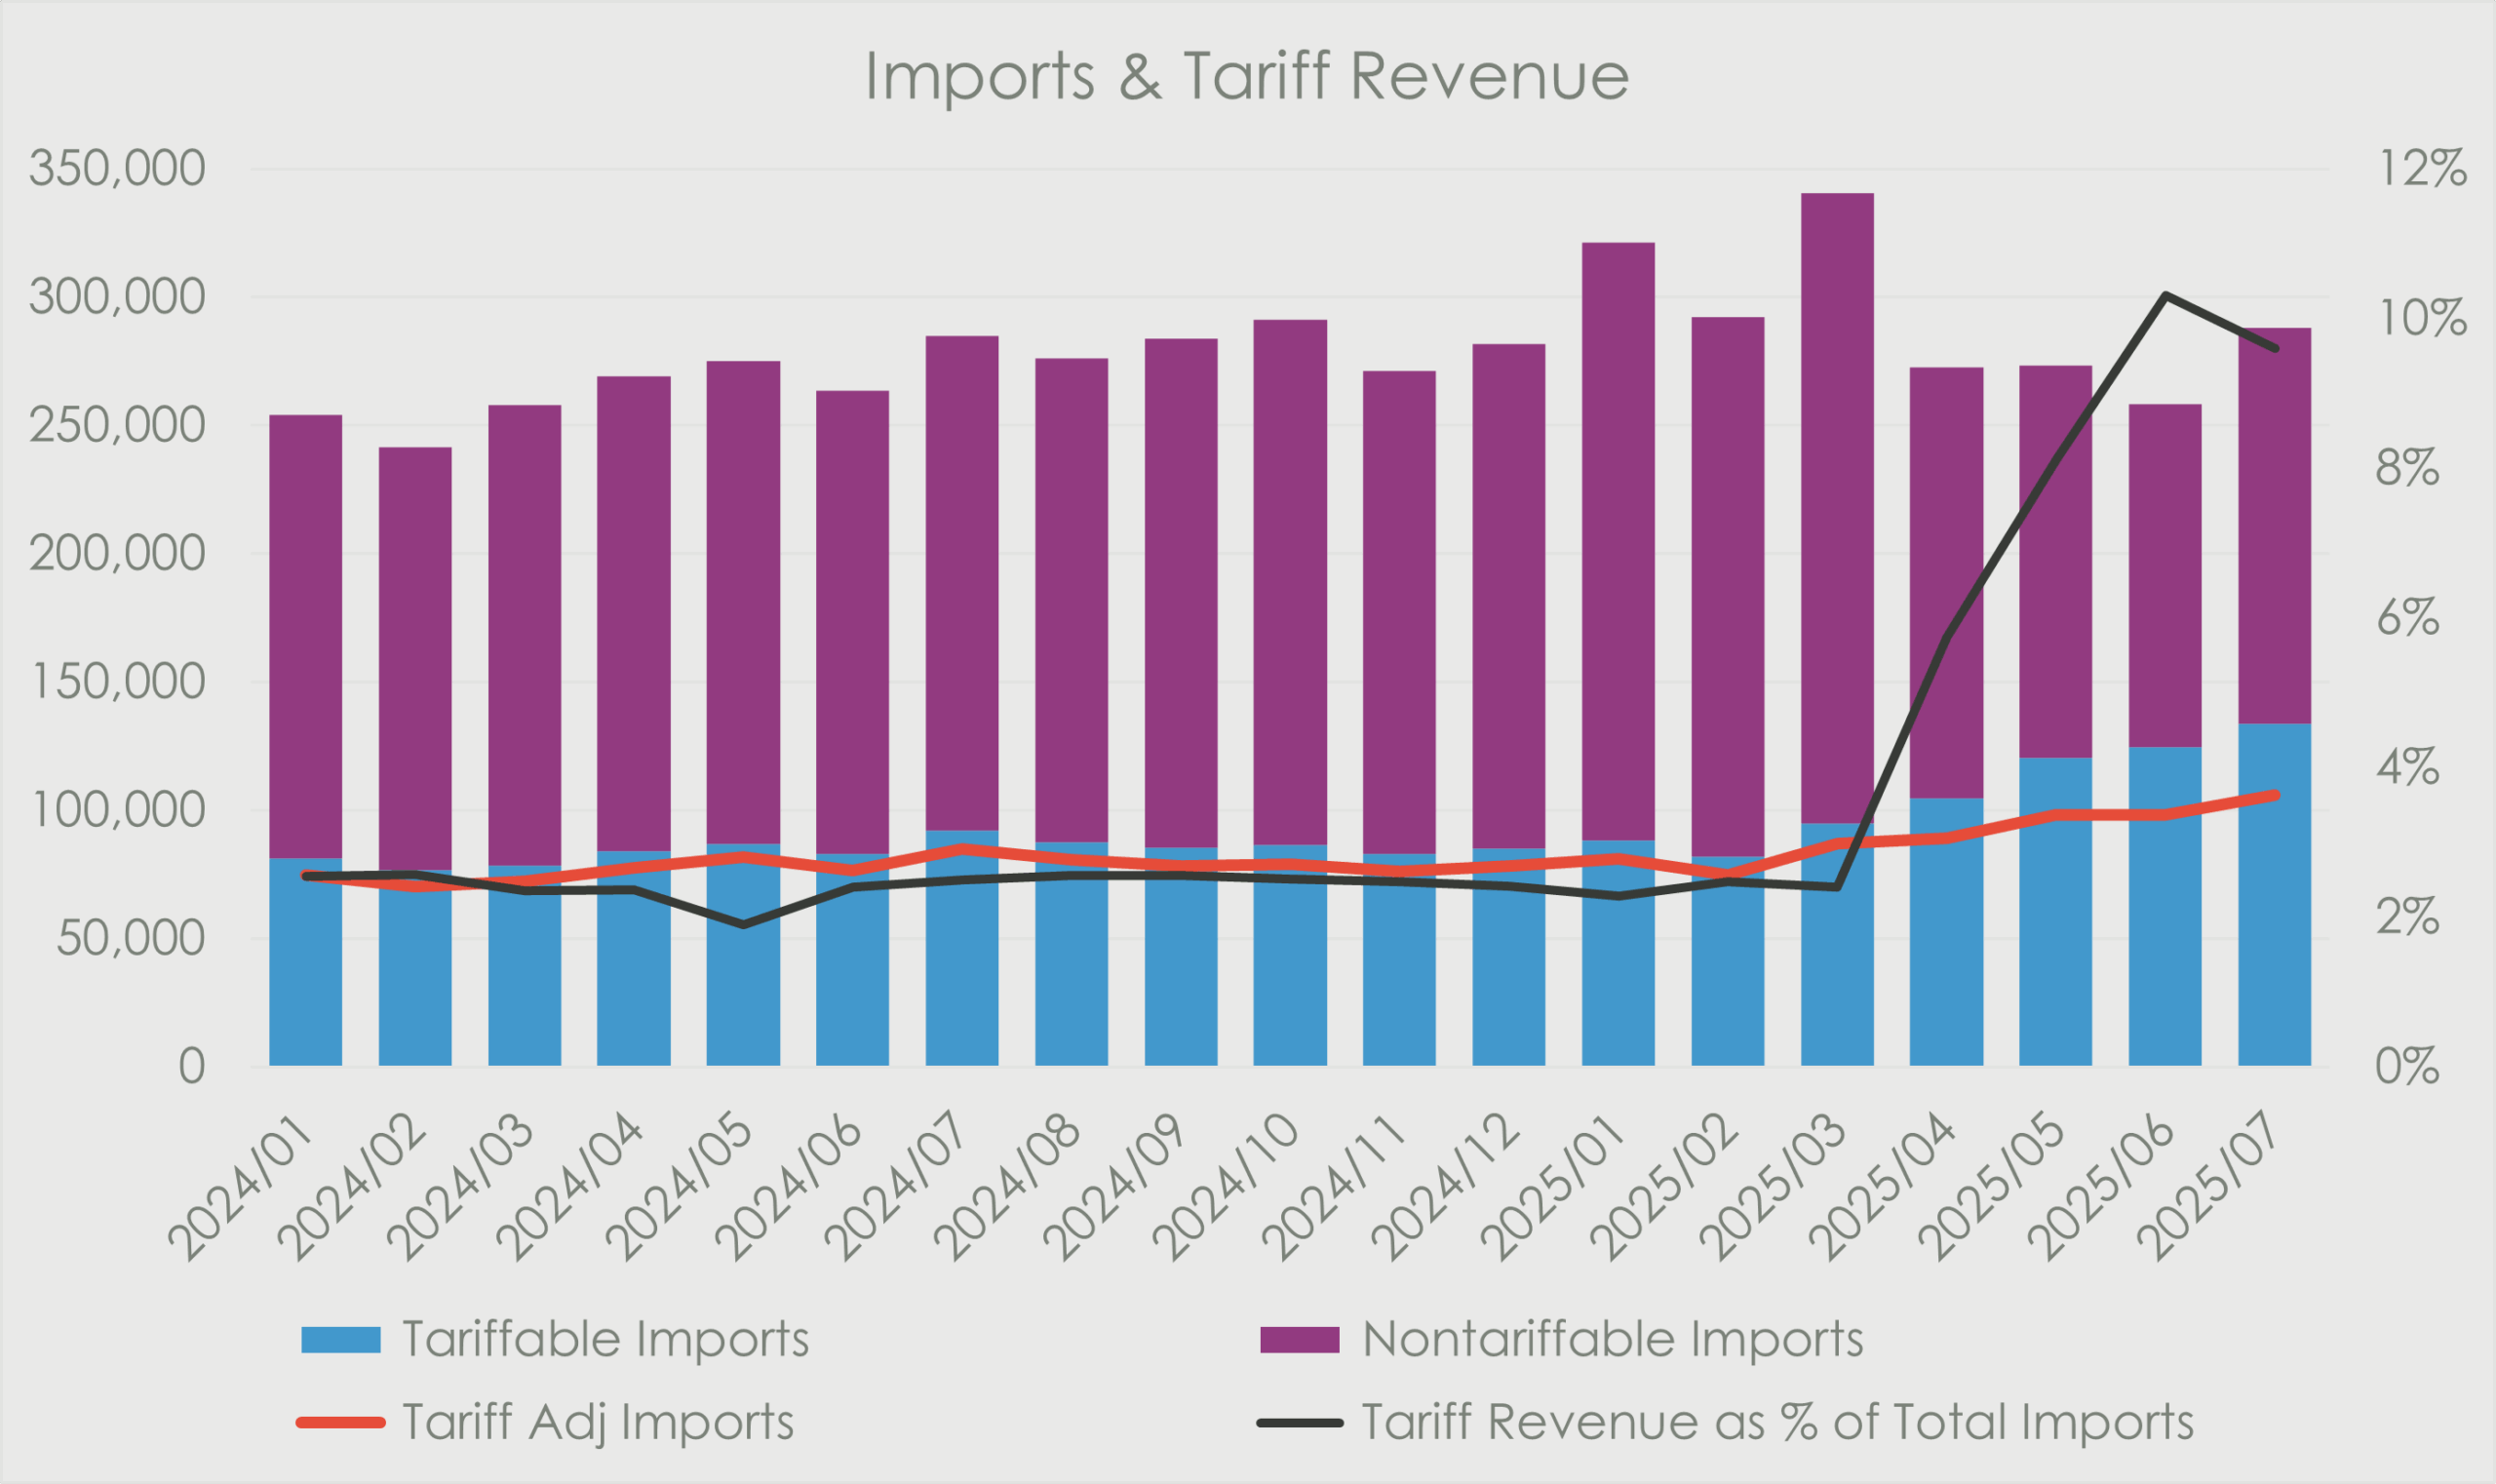
While a large portion of imports are non-tariffed, tariff revenue as a share of total imports has climbed from approximately 2% to around 10%. That points to recurring revenue inflows for the government, which will help offset deficits.
Interestingly, when excluding tariffs from the imported value, you can see that import volumes have held up (as shown in the red line) – showing that there is still volume growth despite higher tariffs and contrary to expectations that imports would drop.
Deregulation: The Next Leg
Before the 2024 November U.S. elections, we looked at 10 potential policies set out by President Trump.
10 Policies if Trump Wins:
- End benefits for undocumented immigrants
- Align U.S. tariff rates with trading partners
- Restore executive order to remove two existing regulations for every one new regulation
- Revoke EV standards
- Lower medication prices through domestic manufacturing
- End the war in Ukraine
- Federal budget cuts
- Transfer education authority to state governments
- Restore Schedule F
- Ban censorship on speech
Deregulation – key to Trump’s agenda – aims to cut the red tape to reduce compliance costs, support capital markets activity such as M&A, allow for quicker approval times for projects, as well as reducing capital requirements for banking industry. Generally, making it easier and less costly for U.S. corporates to do business.
- Banks: simplifying regulation for banks can reduce operational costs, and reduce capital requirements that banks need to hold; freeing capital for shareholder return such as share buybacks or dividends.
- Energy: faster permitting and a pro-traditional energy stance can unlock plans supporting pipelines, LNG infrastructure, and refining; bolstering the U.S. energy sector.
- AI & next-gen technology: a pro-innovation framework will support U.S.-based companies to encourage tech-leadership.
One Big Beautiful Government
In addition to the previous mentioned tailwinds, Trump’s team has shown a willingness to increase its footprint with strategic intervention or direct investment and is worth watching by investors as a signal of priority.
Government investments or minority stakes also entices the government to maintain a favourable or supportive operating environment for those companies.
- Strategic Sectors: Defence, Energy, IT, and Healthcare. For example, the recent deal with critical minerals producer – MP Materials – where the U.S. Department of Defence became the company’s largest shareholder. MP Materials owns the only U.S. rare earth mine, which is critical for defence and advanced manufacturing. This market has been dominated by China, and this move comes at a time where China has tightened control over rare-earth exports.
Bottom Line for Equity Investors
The U.S. economy remains resilient, tariff revenues provide a bridge for funding fiscal policies, and deregulation lowers hurdles for growth across banking, energy, and AI. Adding in government investments, all of these provide possible tailwinds for equity investors.

By the Numbers
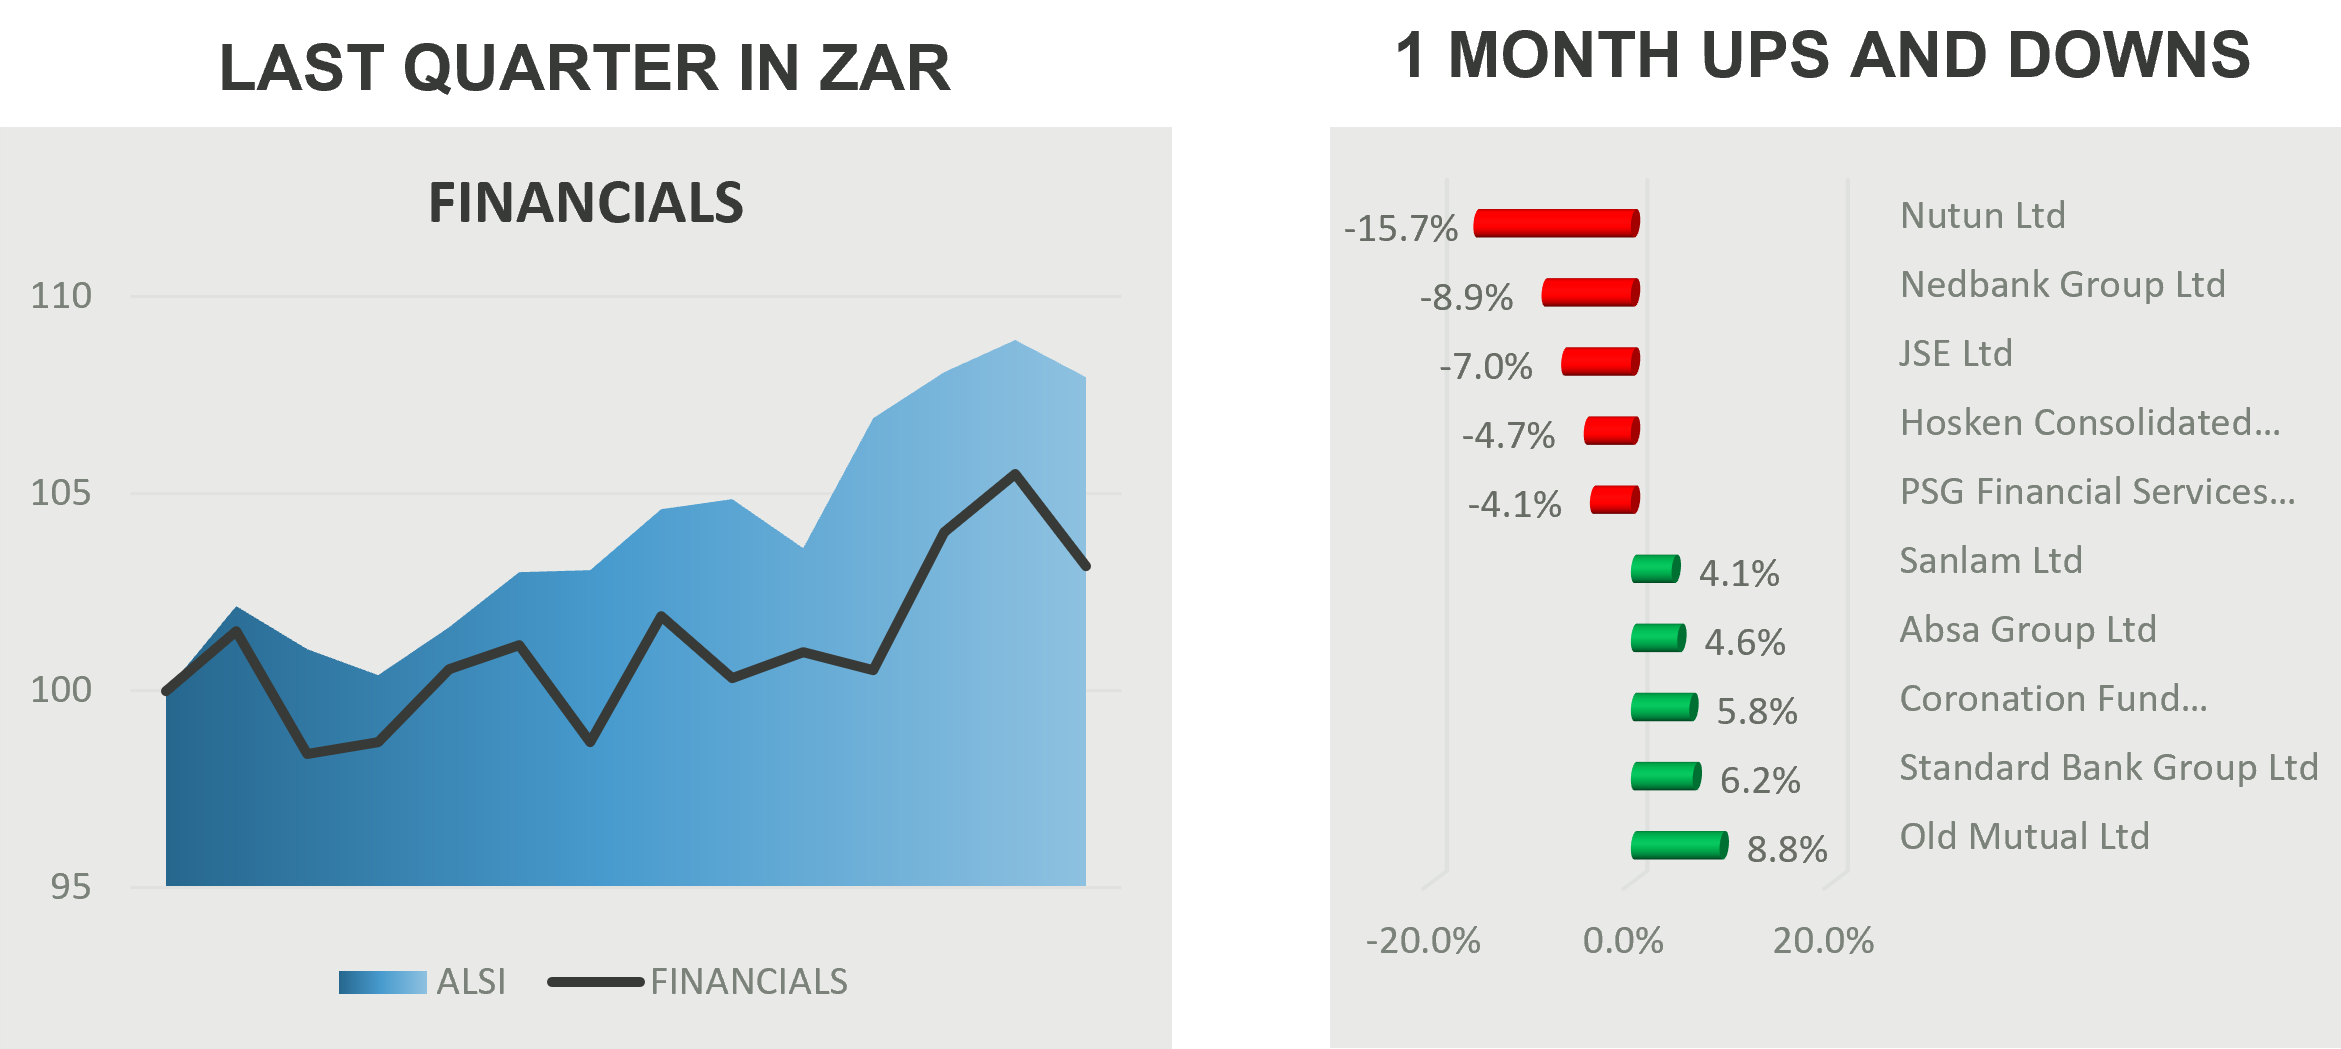
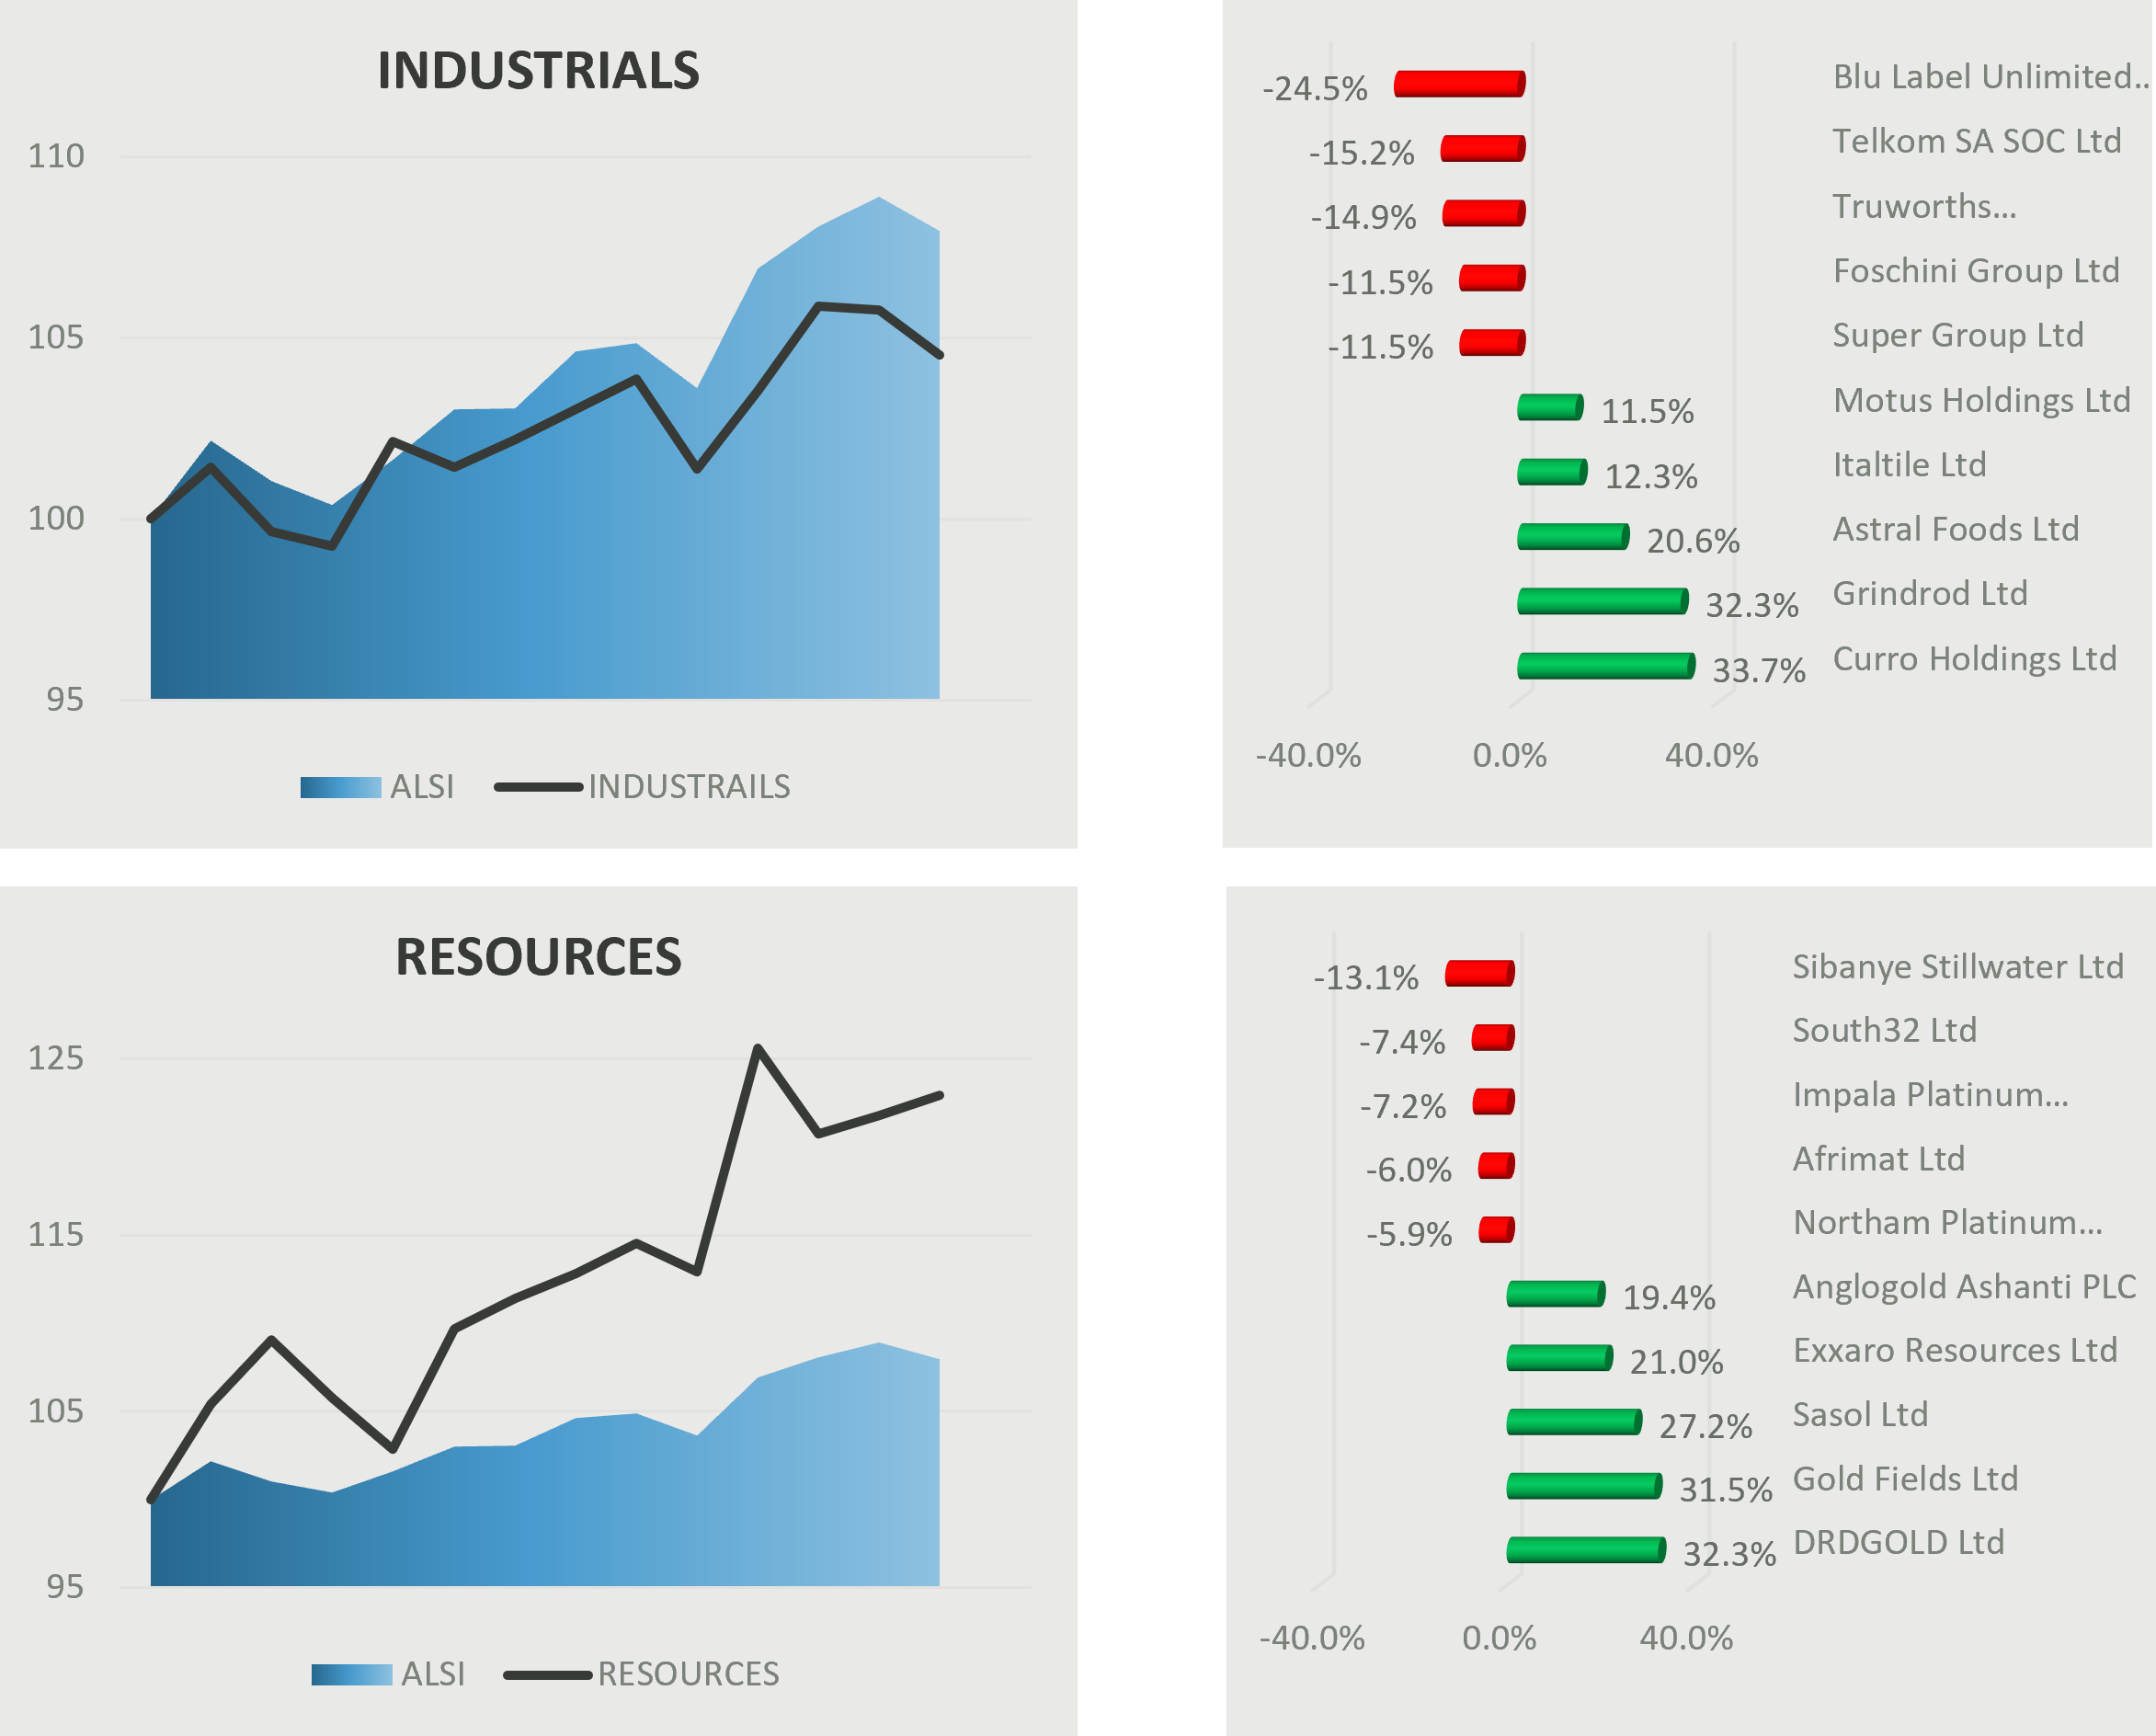
The JSE ALSI gained 3.4% in August, driven by strength in Resources (+11.6%), while Property (+2.8%), Industrials (+1.2%) and Financials (+1.0%) also ended higher. Retailers, however, continued to lag, falling 4.5% for the month.
Resources surged in August, powered by gold and energy. DRDGold (+32.3%) jumped on strong FY25 results, with higher rand gold prices lifting earnings and supporting a 40c/share dividend. Gold Fields (+31.5%) declared a R7/share interim payout as profits more than doubled, while AngloGold (+19.4%) gained on improved production and cost control. Sasol (+27.2%) advanced on results that reinforced its turnaround, and Exxaro (+21.0%) rose on a solid interim print. Platinum and base metals lagged, with Sibanye (–13.1%), South32 (–7.4%) and Impala (–7.2%) were all softer mostly from weaker than expected results.
Property counters ended the month modestly higher, supported by improving fundamentals. Fortress (+6.3%), NEPI Rockcastle (+5.2%) and Redefine (+4.8%) advanced, with NEPI buoyed by a record €8 billion investment property portfolio in H1 2025 and Redefine lifted by a pre-close update flagging continued operational improvements. However, weakness in MAS (-7.7%), Sirius (-4.2%) and Emira (-2.6%) tempered overall gains.
In industrials, Curro (+33.7%) surged after the Jannie Mouton Foundation tabled a premium takeover offer. Grindrod (+32.3%) rallied to nine-month highs after asset sales delivered a R903mn cash boost, driving a 23% YoY rise in HEPS and enabling both an interim and special dividend. Astral Foods (+20.6%) gained on an improved trading update. On the downside, Blue Label (–24.5%) slumped on weak FY25 results and the suspension of its dividend, and Telkom (–15.2%) fell after its Q1 update flagged underperformance at BCX.
Financials were mixed. Old Mutual (+8.8%) led gains, with Standard Bank (+6.2%) and Absa (+4.6%) advancing on solid interim results that highlighted resilient operations and improving credit quality. Coronation (+5.8%) and Sanlam (+4.1%) added support. On the downside, Nutun (–15.7%) extended losses, Nedbank (–8.9%) slipped despite a decent 1H25 print as its near-term outlook softened, and JSE Ltd (–7.0%) remained under pressure on below-expectation results.
Retailers diverged sharply, with strength in home improvement and autos offset by weakness in apparel. Italtile (+12.3%) gained after declaring a special dividend supported by strong cash reserves despite flat profits. Motus (+11.5%) outperformed on robust vehicle sales. By contrast, Truworths (–14.9%) slumped as FY HEPS fell 8% YoY, Foschini (–11.5%) guided to a tough 1H on muted trade, and Pepkor (–7.3%) also weighed on the sector.

State of The Nation: A Temperature Check on GDP Prospects
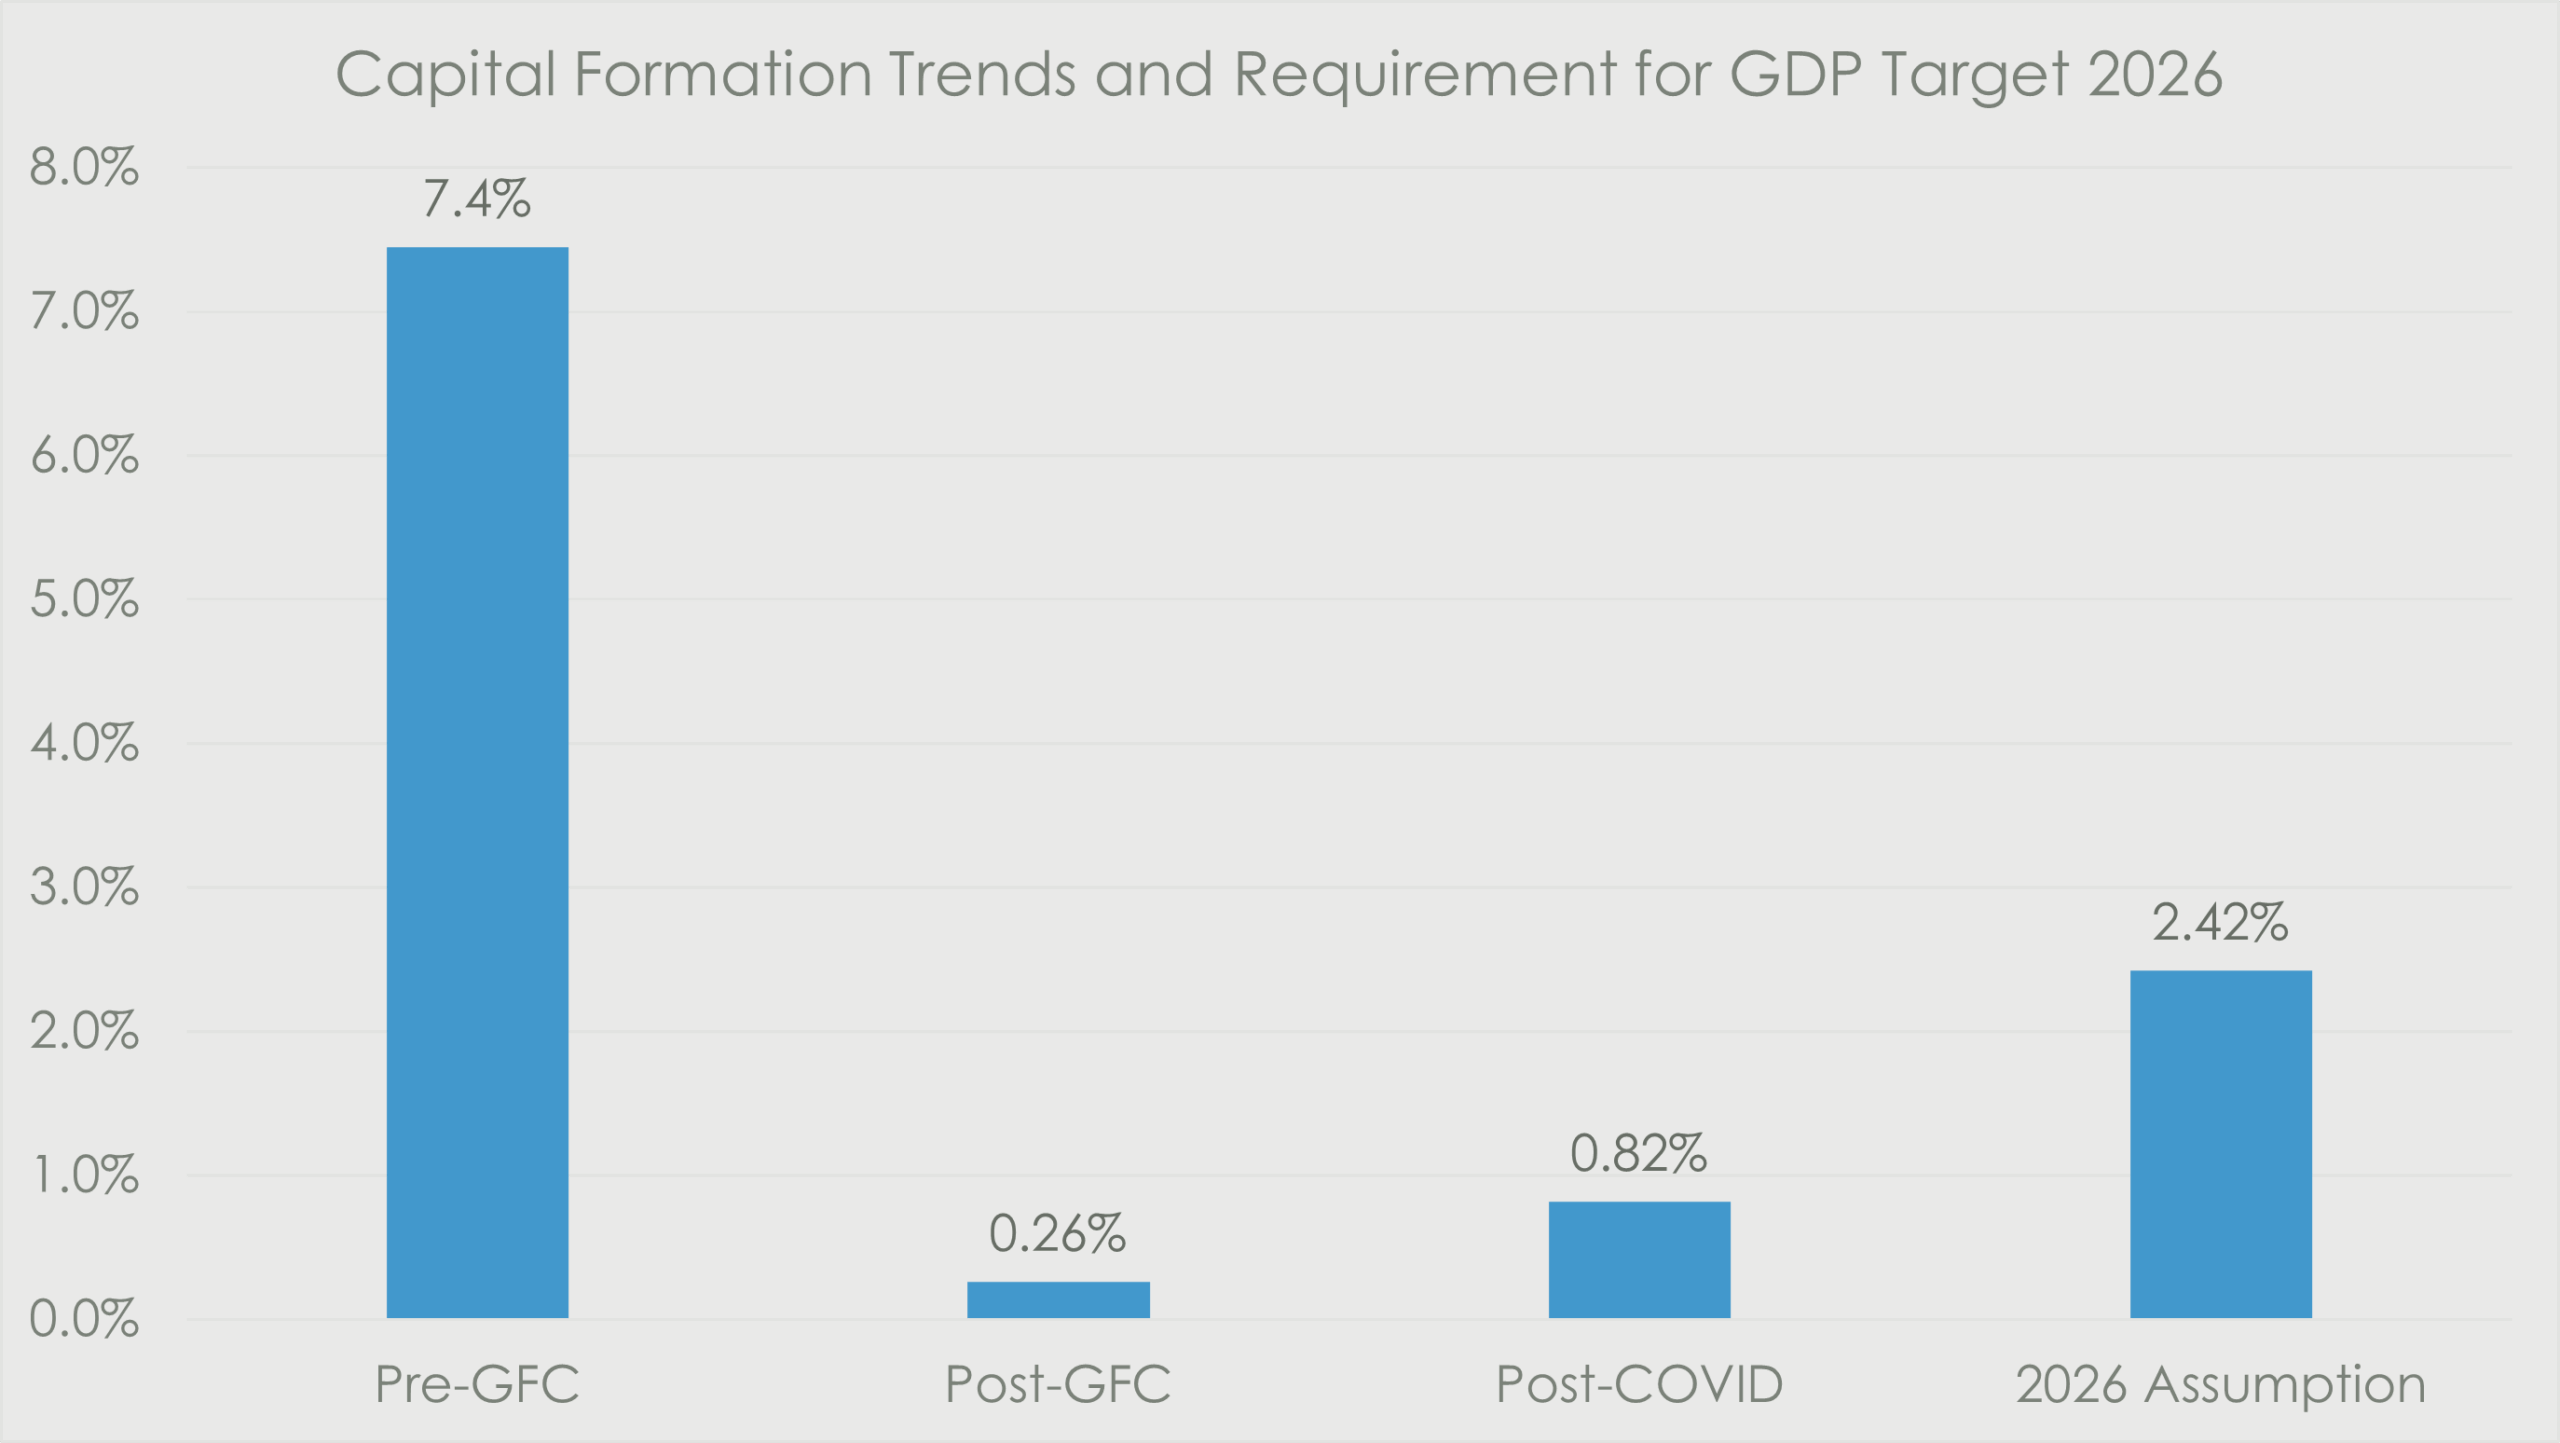
Economic theory would suggest that the best quality growth an emerging economy can attain is focused on capital formation, which is investment in productive assets within an economy by both its private and public sectors. It has been posited by economists that a GDP growth number of 1.5% is the sweet spot to catalyze the virtuous cycle of multiplier effects in the South African economy. We briefly explore how close we are to that number and whether the conditions exist on the ground to make it a reality.
On our numbers, in order for the 2026 GDP number to reach 1.5%, we would need capital formation to grow by 2.5% from Stats SA’s annualized 2025 number based on the first quarter print. Capital formation accounts for about 14% of our R4.7trillion economy in real terms, coming in at R650billion annually. This means that we would need an additional R15billion rand spent on capital producing projects in our economy off the current base.
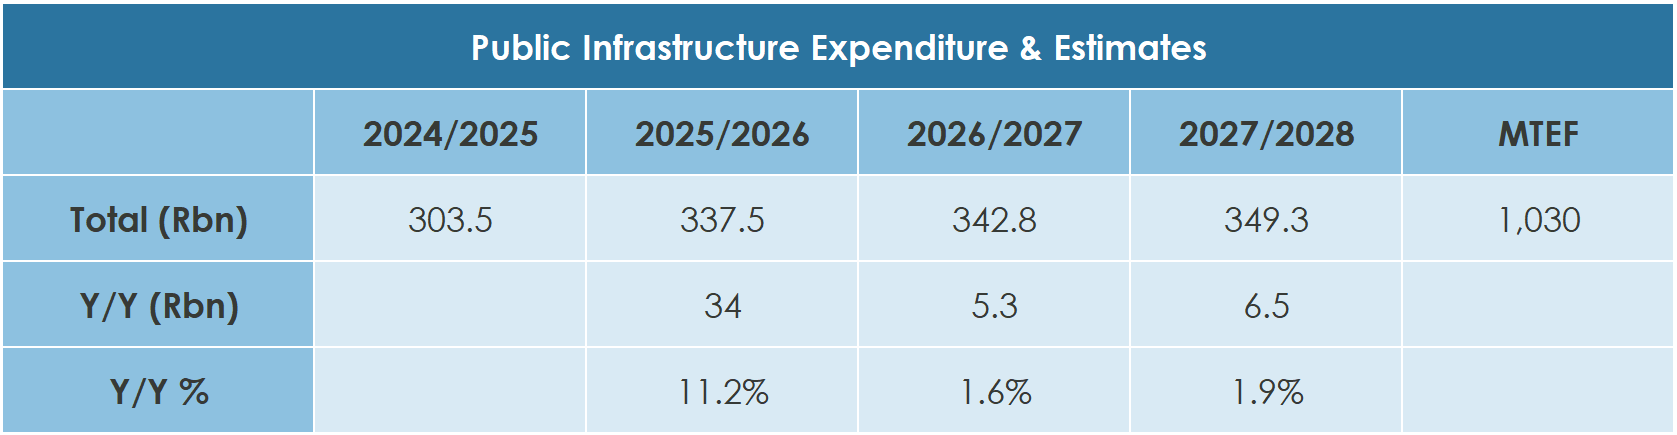
The government has made a raft of announcements centered on public private partnerships in the infrastructure space. They are channeling their efforts across sectors through a Budget Facility for Infrastructure (BFI) and have committed to 67% private funding across all projects. Additionally, the public sector spending plan for infrastructure (per the latest Medium Term Budget Policy Statement) is to be focused on energy, water and logistics and calls for an 11% increase in estimated spending for the applicable financial year. This would equate to an incremental R34billion in capital formation.
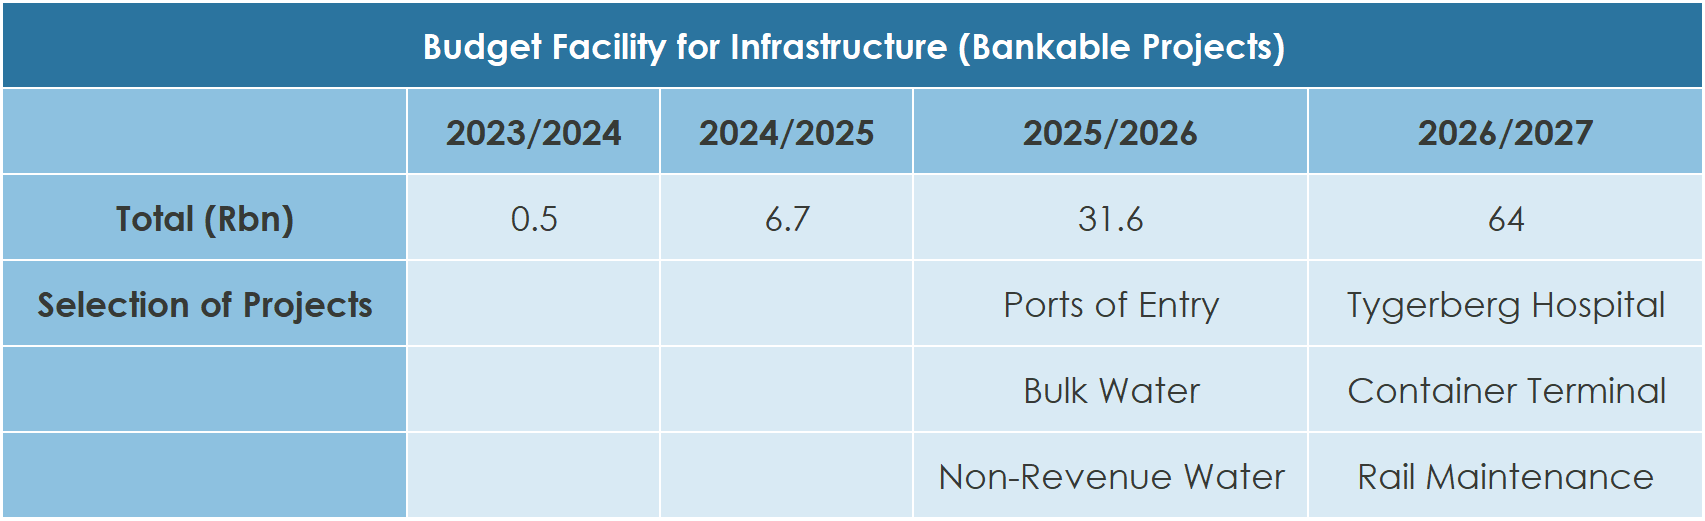
Looking at the BFI’s estimate for bankable projects for the fiscal years ending 2026 and 2027, we see a similar quantum of projects on the slate for the current year.
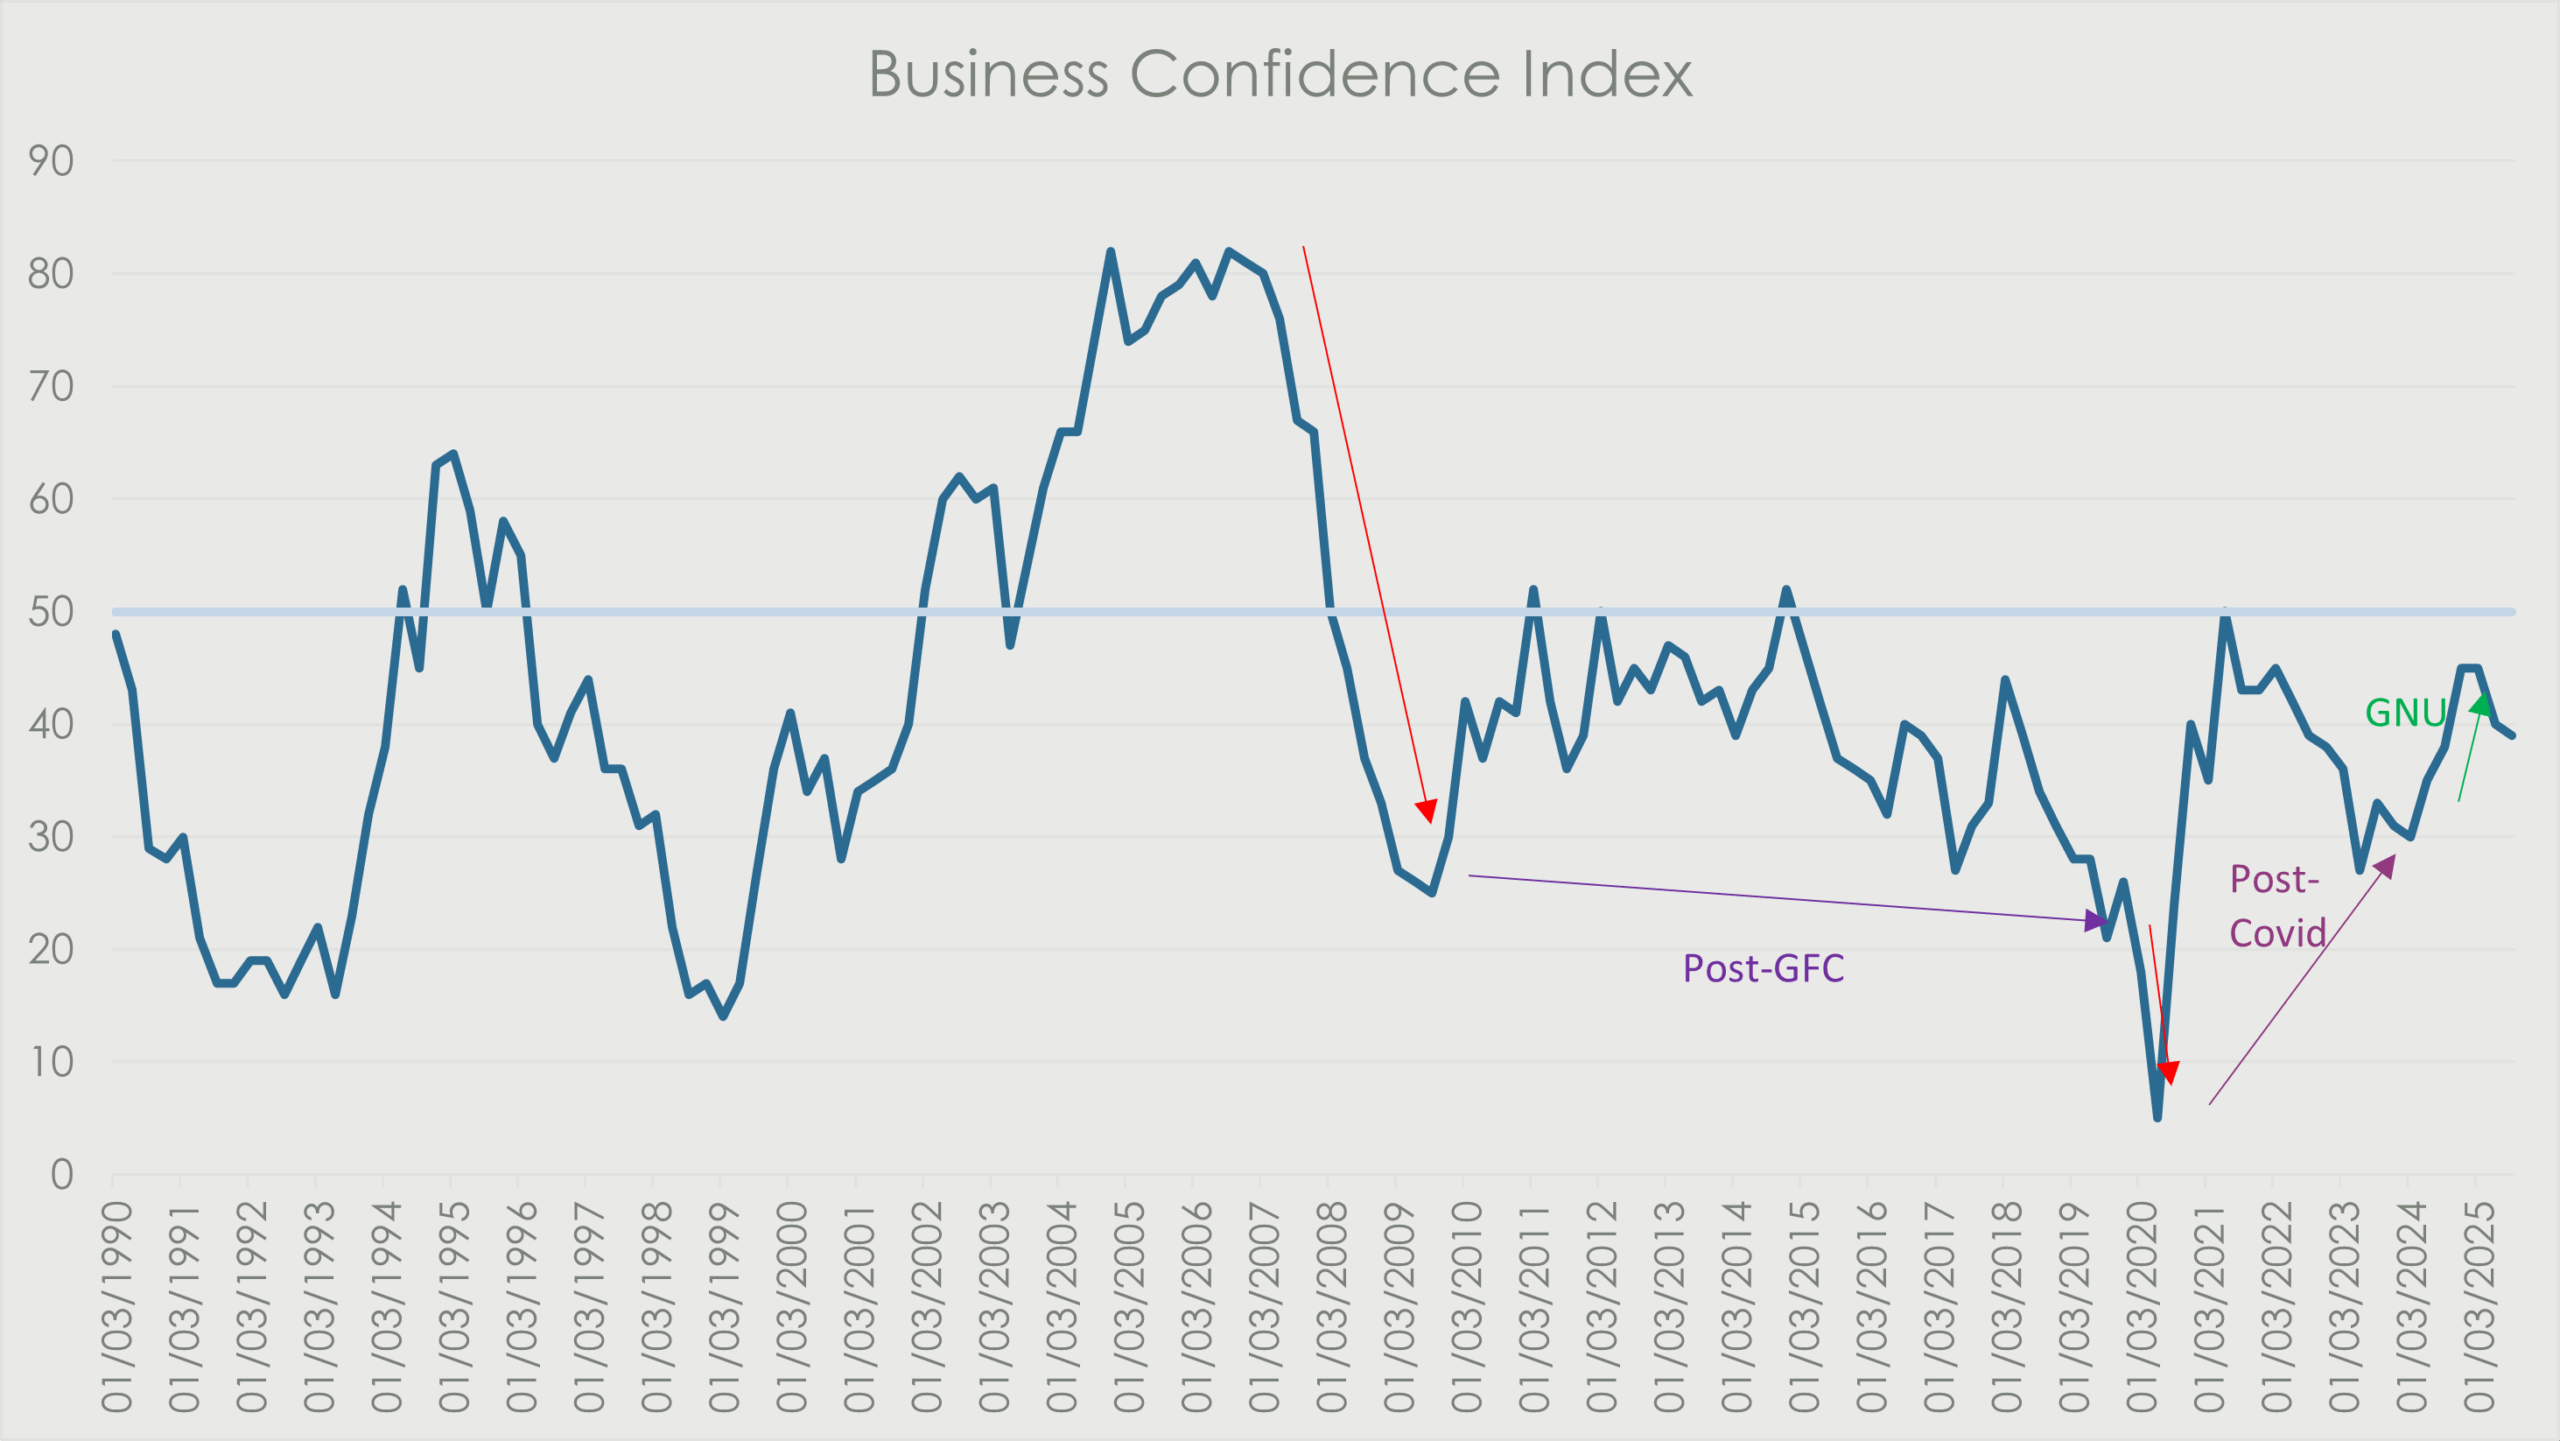
The question becomes whether bankability can be converted into shovels in the ground at a high rate. Traditionally, policy, regulation and corruption have created friction which has kept actual investment levels in negative territory and far lower than investment commitments. For this reason, despite the considerable strides being made by Operation Vulindlela in the presidency on the reform agenda, business confidence remains in contractionary territory. We are seeing positive signs in credit extension to corporates, which suggests that the intention to deploy exists, however that has not yet translated into an elevated investment impulse in our economy. Following years of chronic under-investment into our economy, this would be the springboard needed to inject growth back into our economy.
Recent Portfolio Changes
In the month of August, we undertook a rebalancing of our portfolios focused on our consumer-facing rand hedge names.
Immediately ahead of the release of their first half 2025 print, we took profits from our British American Tobacco holdings. The share has delivered a 42.5% price increase from the beginning of the year to the day of their earnings release. This price performance lifted the valuation to a frothy 11x consensus forward earnings, relative to the five-year average of 7.8x. Consequently, on our numbers, the share looked to be extremely optimistically priced relative to its fundamentals, considering that management had preemptively guided a slowdown in earnings momentum and consensus expectations had been downwardly revised by analysts.
We used this cash to shore up our holdings of AB Inbev and Richemont in instances where we were a little light.
AB Inbev had sold off heavily in the aftermath of what we thought was a decent set of numbers. They delivered better than consensus earnings growth, driven by pricing power and cost control, though the market focused on soft volumes and a delayed buyback announcement and punished the stock on the day. With valuations at undemanding levels, we topped up our holdings. At the time of writing, the share is priced at a forward PE of 14.7x, relative to an 18x, post-SAB merger average.
Richemont, experienced a 30% derating from recent highs. Analysts’ earnings expectations had been revised downward (-10% year-to-date), in concert with the global luxury sector in totality (basket peer group -14.5%). Though not screening extremely cheap, in our view the pullback presented us with an opportune time to return portfolios to equal weight. The group’s prospects continue to be underpinned by a strong jewellery business and fortress balance sheet. It remains a core holding in our growth focused portfolios.
SASOL: Renewed Chemistry with The Markets?
In the lead up to the Sasol Capital Markets Day in May of this year, market confidence in the name was decidedly negative. Certain sections of the market had become fearful of the announcement of a rights issue, on account of significant balance sheet pressure. This would have been severely detrimental to an already weak share price.
Operationally, the South African business had been under pressure, due to falling coal quality, which was affecting production volumes as well as the lack of a credible plan to curb carbon emissions from the Secunda and Sasolburg plant. In the international business, chemicals prices remained subdued, driven by what appears to be a structural change in end-user demand, which necessitated a review of that part of the business
Our sense is that the initial bounce in the aftermath of that Capital Markets Day is down to the fact that management successfully allayed fears over balance sheet weakness. We have subsequently heard from management on three occasions, and the market has responded positively to what has amounted to a 58% increase in 2025 earnings from management guidance in the production report back in July to the actual reported number in August.
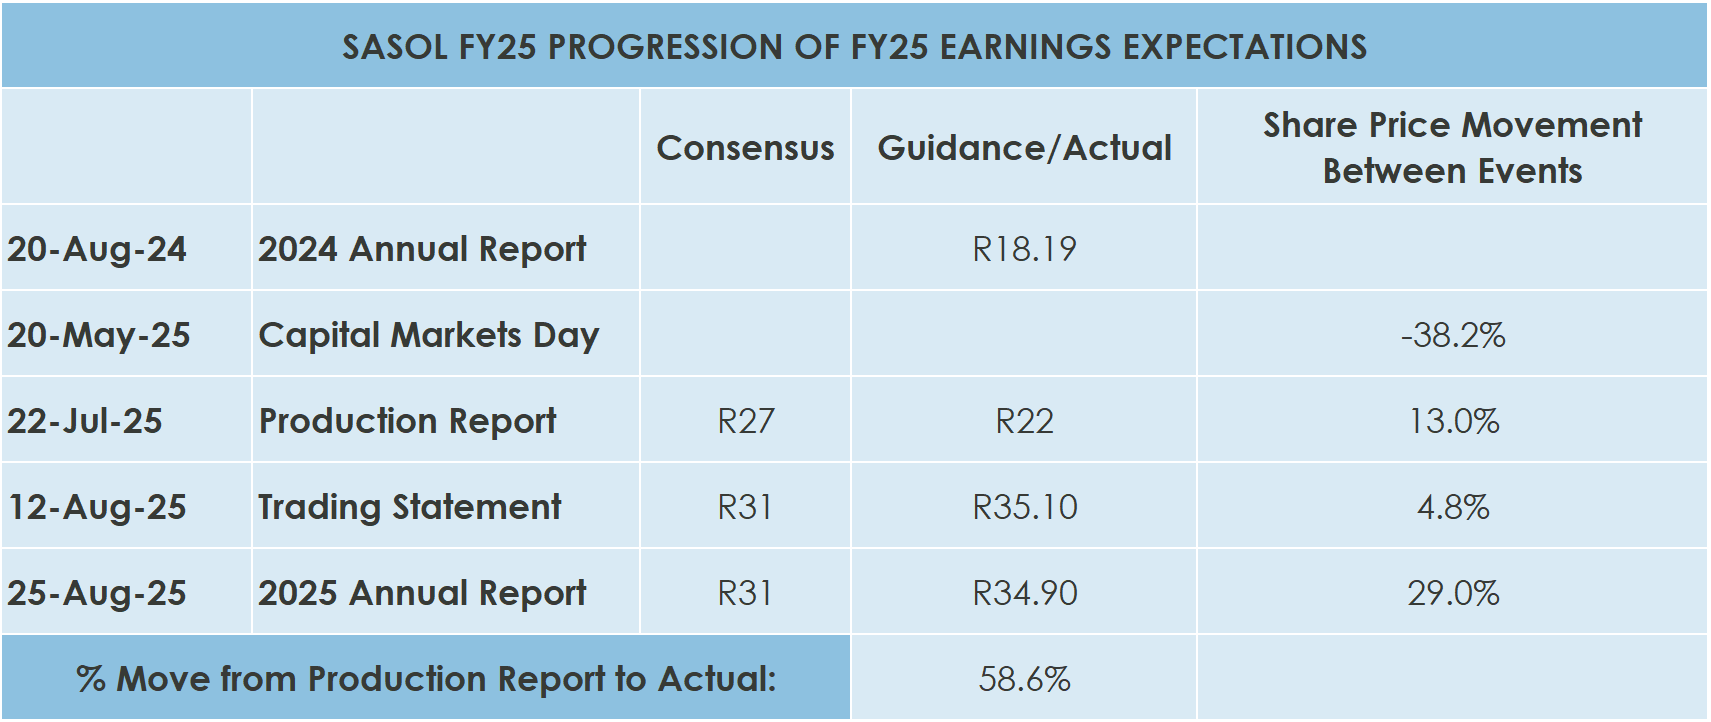
The bottom-line beat was driven by the following:
- An increase in the chemicals basket price by 5%, which was accretive to EBITDA margin.
- A significant improvement in impairment charges.
- Favourable settlement in a dispute with Transnet.
In general, volumes across the business were lower, though margins higher, leading to a better quality of earnings.
Now that rights issue fears have been put to rest, it is important to note that there is still much for management to do to earn back the market’s trust. Execution risk is still high in this name and we will continue to watch select areas and mark progress to their 2028 targets. We will be tracking the name on a host of operational and financial targets as set out by management at the Capital Markets Day, some of which are outlined below;
- Improvements to Secunda production yields above 7mt in FY26 and approaching 7.4mt in 2028, driven by increasing yields and coal quality.
- From $59/bbl currently, oil breakeven approaching $50/bbl by 2028.
- Chemicals volumes falling and the basket price rising, as more emphasis is placed on higher margin specialty chemicals.
- International Chemicals EBITDA margin approaching 15%, from high single digit in FY25.
The key message from management has been their commitment to self-help and not relying on an improvement in macro conditions to bail them out. This is a new management team that has inherited the unfortunate reputation of past teams. They will have to work hard to convince the market that they can affect a turnaround at Sasol. This will continue to be a “show me” story in the near term, though the 4x forward PE multiple could rerate quickly if market confidence in this management and the story is restored.