

AI FIRMLY IN THE DRIVING SEAT
July brought some volatility to global equity markets. The month began with confidence being tested by geopolitical shocks, rising oil prices, technology-sector deleveraging and widening macro divergence. By early August, markets had regained some composure as oil eased, technology earnings improved and expectations for a September Federal Reserve rate hike were reduced after a weak US jobs report.
In early July, geopolitical tension became visible once again, as US-Iran tensions lifted the risk premiums, Red Sea disruptions and renewed supply-chain stress pushed Brent above $100 before settling in the $90s, reinforcing the inflation challenge facing central banks. New US tariffs added another layer of uncertainty to the trading system.
Meanwhile, the AI build-out became a fixed-income story as well as an equity story: large technology companies’ capital expenditure plans increased demand for debt funding, contributing to higher long-term yields. Alphabet launched a massive $20-$25bln US bond offering while Amazon, Meta and Oracle were also active in the market issuing corporate bonds. All this coming shortly after SpaceX’s record $85bln capital raise through its IPO.
The AI funding concerns coupled with technical selling triggered by leveraged single stock ETFs, leading to margins calls, created a virtuous downward spiral for tech stocks. Many of the year’s top Tech performers pulled back more than 20% in July. This sell off in the Tech space was exemplified by the 39% pull back in the Tech heavy South Korean KOSPI.
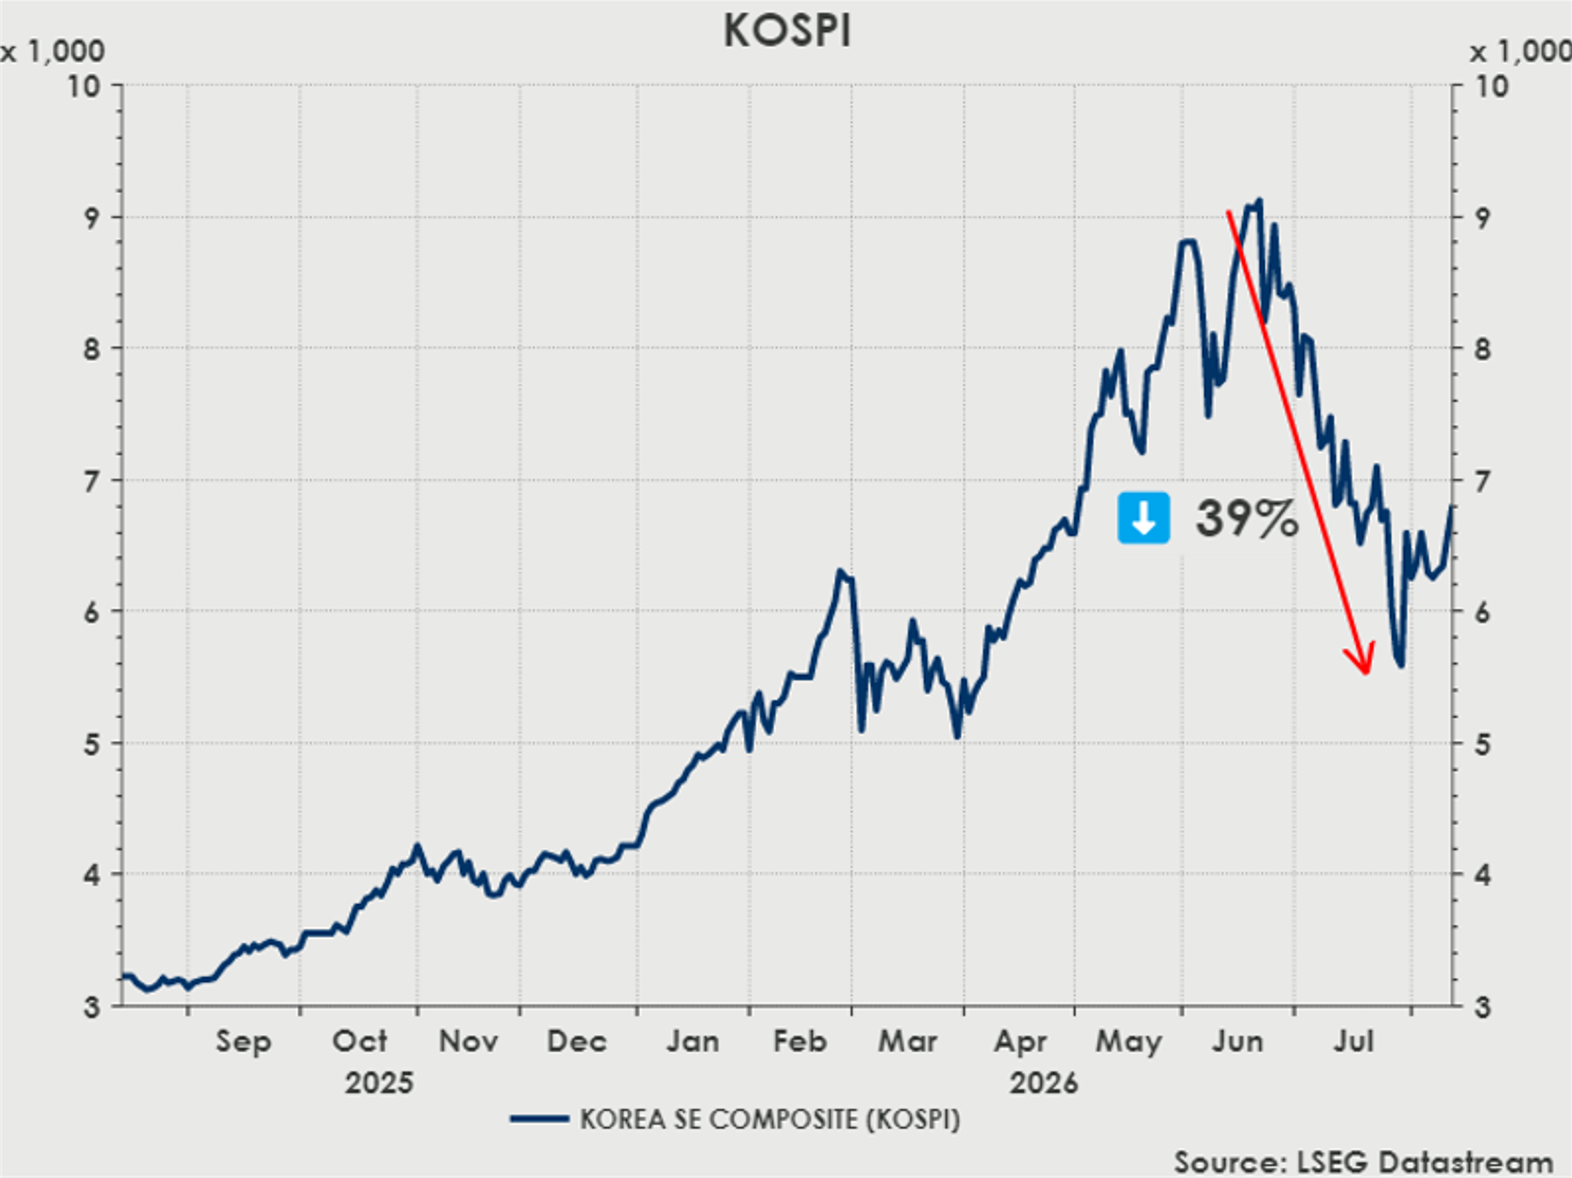
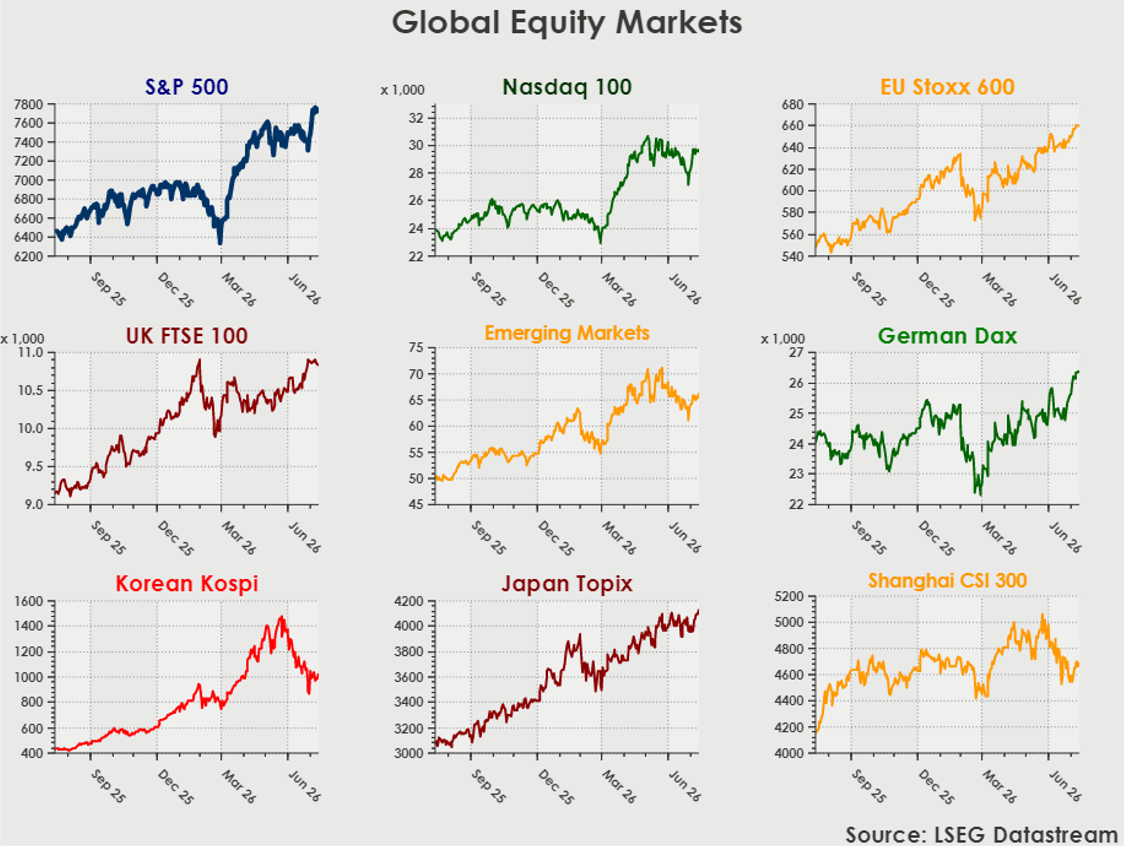
Equities struggled under the combined weight of Tech selling, higher oil prices and higher yields, with the Nasdaq lagging.
As we headed into August, we saw markets rebound as 2Q earnings continued to shoot the lights out while an unexpected decline in July payrolls prompted financial markets to pare back the implied probability of a September Fed rate hike from nearly 60% on Thursday to roughly 40%.
Most developed market equity indices broke through to new highs by the second week in August.
2Q EARNINGS: TO INFINITY AND BEYOND
If investors doubted the resiliency of the US and Global economies, surely that has been put to bed during a remarkable 2Q earnings season.
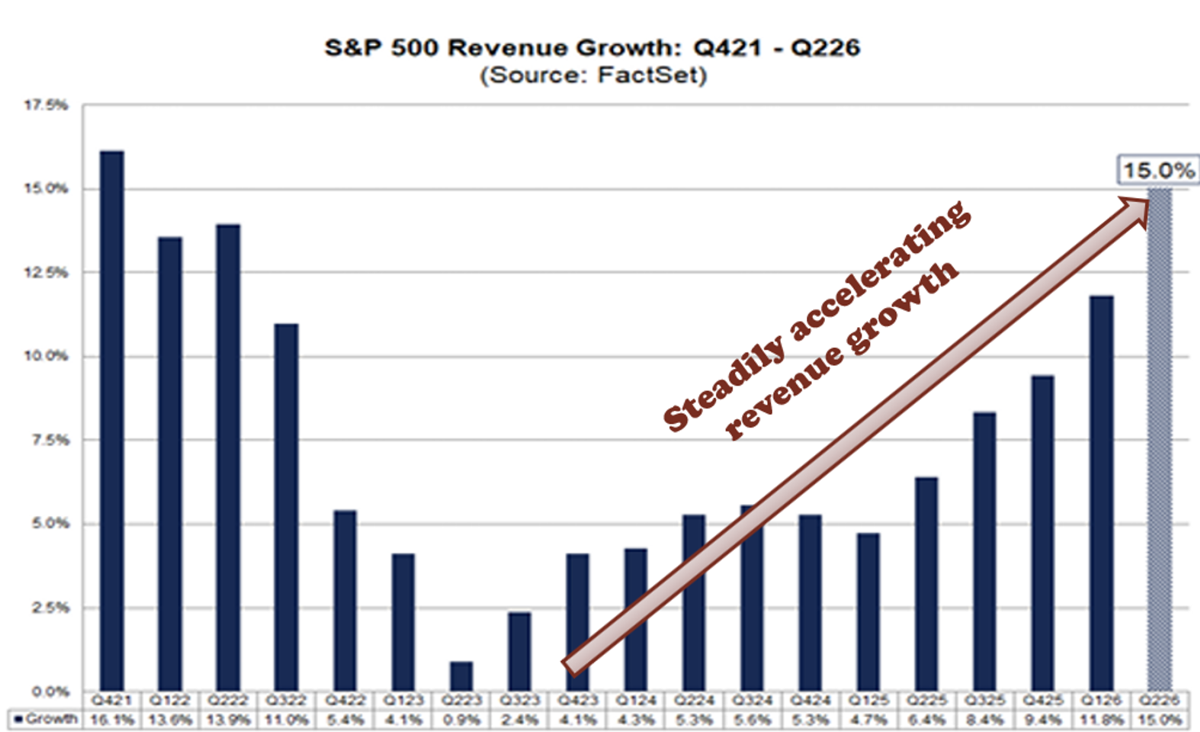
The second quarter earnings season has delivered in spades. With over 88% of companies having reported, as of writing, we are seeing an extremely strong operating environment. 2Q revenue growth rate is 15% Y/Y, with all sectors showing growth and more the half of the sectors showing double digit growth. 15% Y/Y growth represents the strongest growth since 4Q21; we have seen a steady acceleration in revenue growth since the beginning of 2025.
Earnings growth has shot the lights out, recording the strongest growth on record at 50.4% Y/Y, truly remarkable. Companies have completely blown away analyst expectations with the average company beating expectations by 29 percentage points.
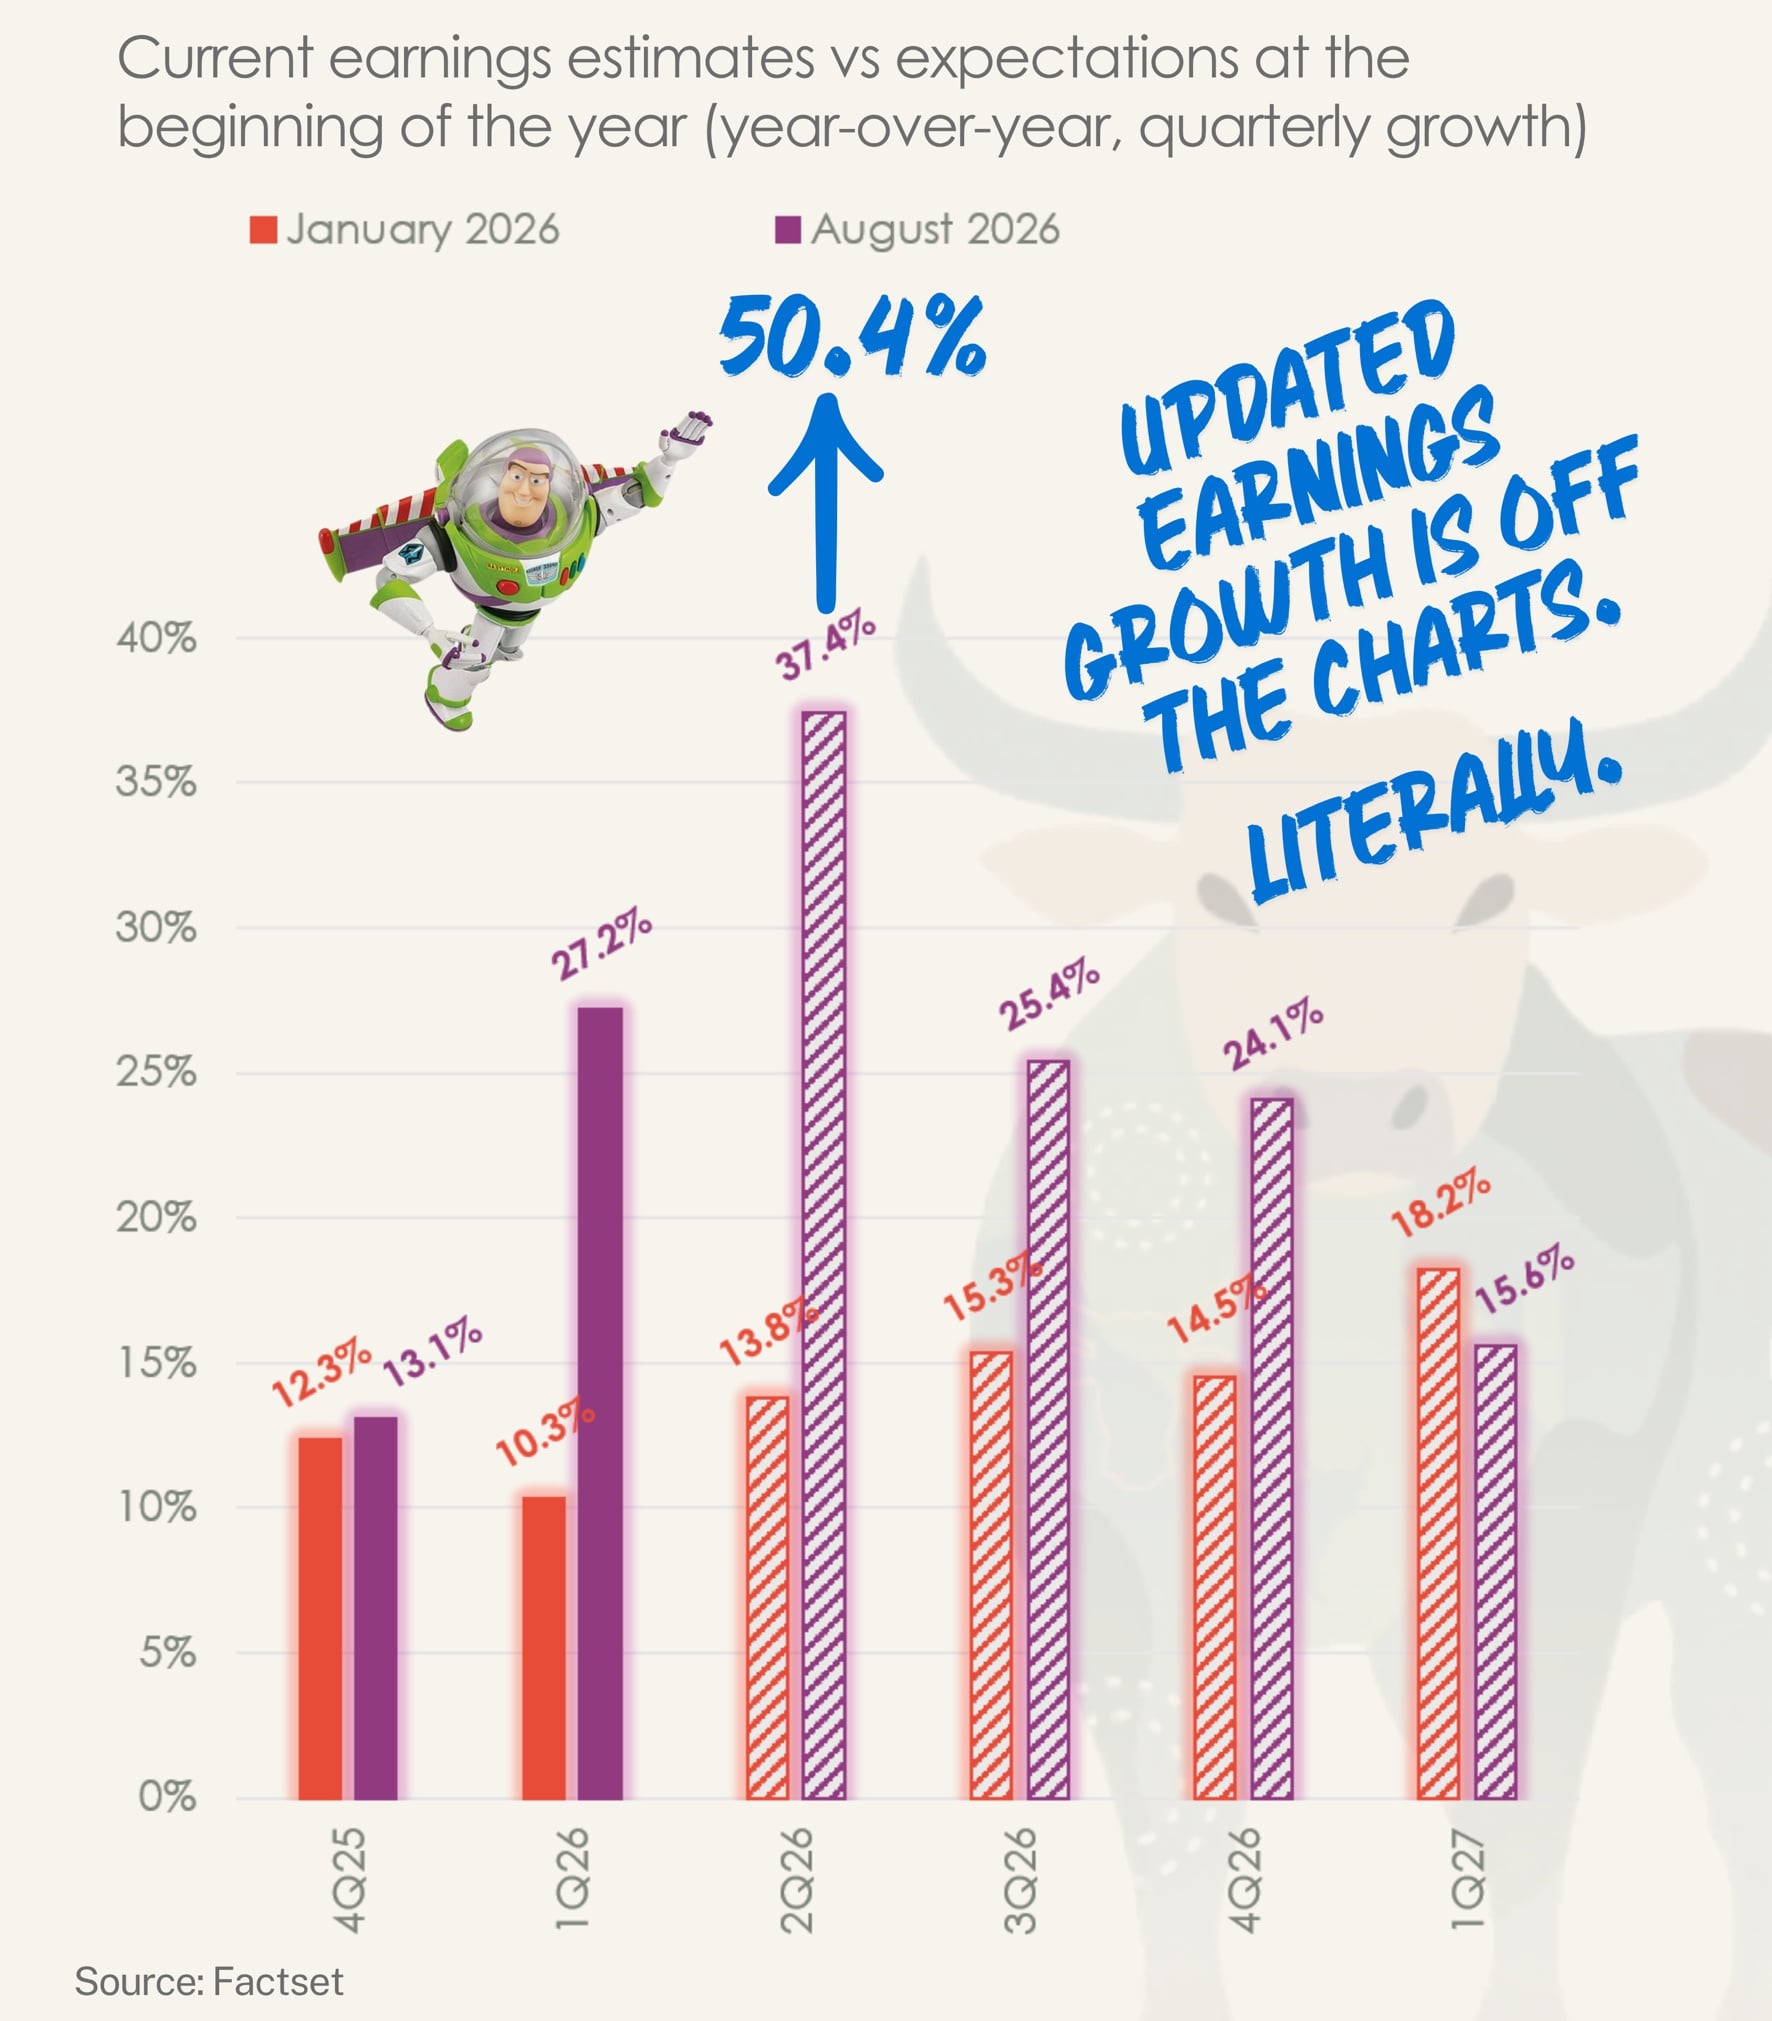
As we have expressed on multiple occasions, there is no doubt that AI investment has been driving a lot of the earnings growth, however the ripple effect is spreading across the whole of the economy. All but 2 sectors are currently experiencing double digit earnings growth.
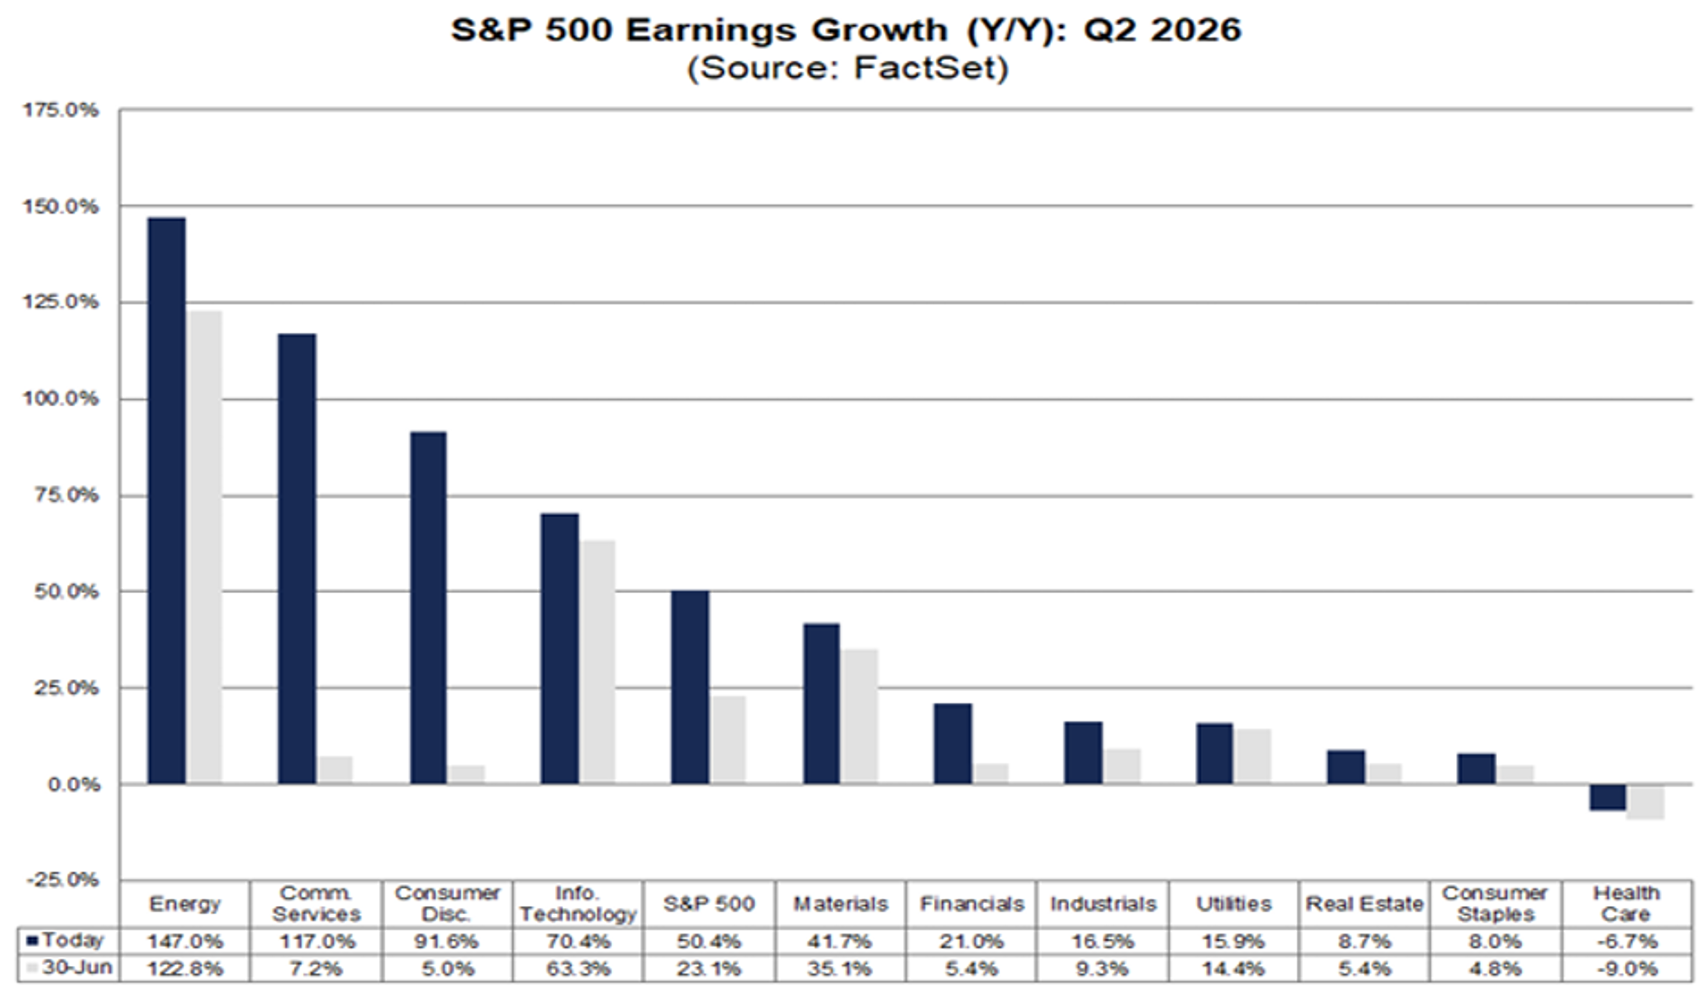
This strong earnings growth has been solely responsible for driving equity markets higher. In fact, we have seen the S&P 500 PE multiple pull back to 19x while the index hits new highs.
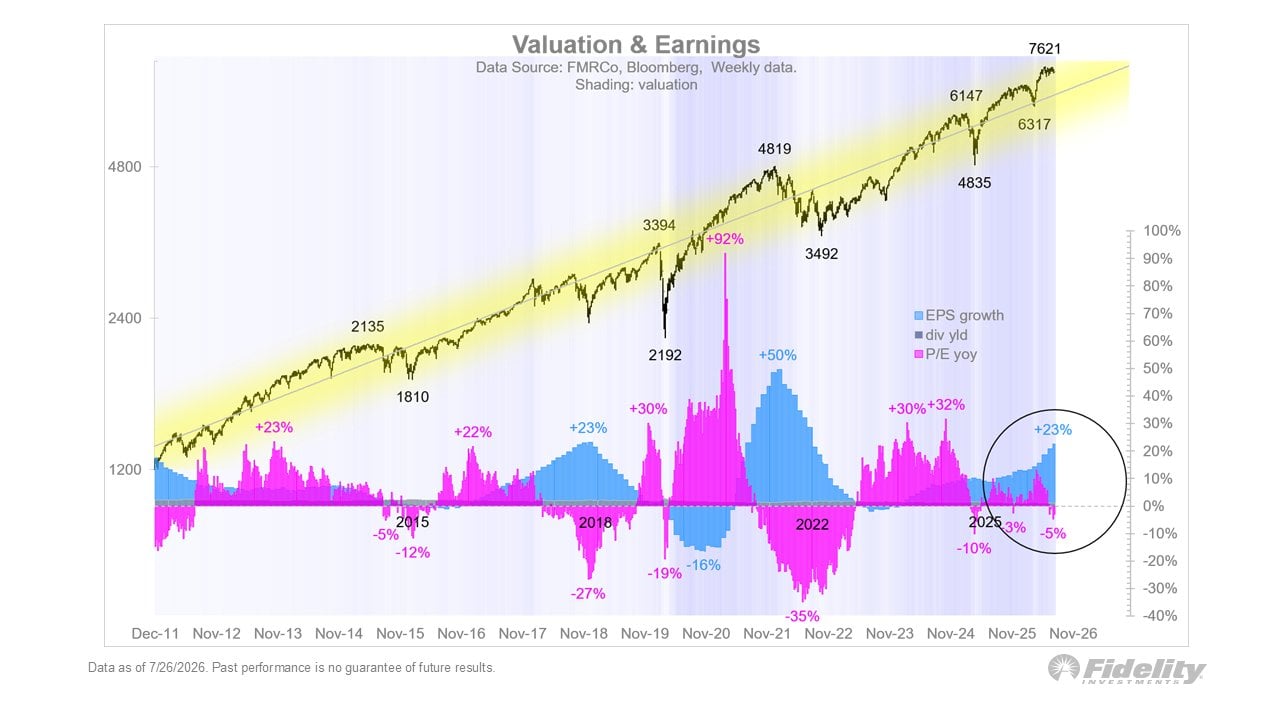
As we progress toward the end of year several themes will continue to dictate the direction of equity markets:
- AI Infrastructure Buildout – How will it be funded and what are the returns on investment?
- Geopolitics – The impact on energy costs and what a resolution to the Strait of Hormuz looks like
- Fed Regime Change – New Fed Chair, Kevin Warsh, is instituting a fundamental shift at the Fed. How will the Fed respond to diverging factors of persistent inflation and soften labour market dynamics?
- Earnings Growth Momentum – How long can these supernormal growth rates last?
In this month’s Wood for the Trees, Liza takes a deep dive into the most recent takeaways within the AI Capex vs Return on Investment debate. She remains firm that the Hyperscalers are seeing the demand that justified the enormous capex spend beginning to come through.
Anda recently returned from the Investec Consumer Finance Conference in Cape Town, walks as through his key takeaways. In general, consumers remain resilient, lending books stable, and the informal sector continues to offer untapped growth potential.
Locally, global geopolitical volatility continues to cloud the earnings outlook for South African equities. The resulting deterioration in sentiment has decelerated investment and spending trends across the economy. Beneath the surface, however, supply-side reforms and fiscal consolidation continue to gain traction, strengthening the long-term investment case for South African assets and creating the potential for outperformance as uncertainty recedes.
We continue to believe that global markets continue to offer attractive return opportunities; however, the premium is on investment discipline and careful stock selection.

By the Numbers
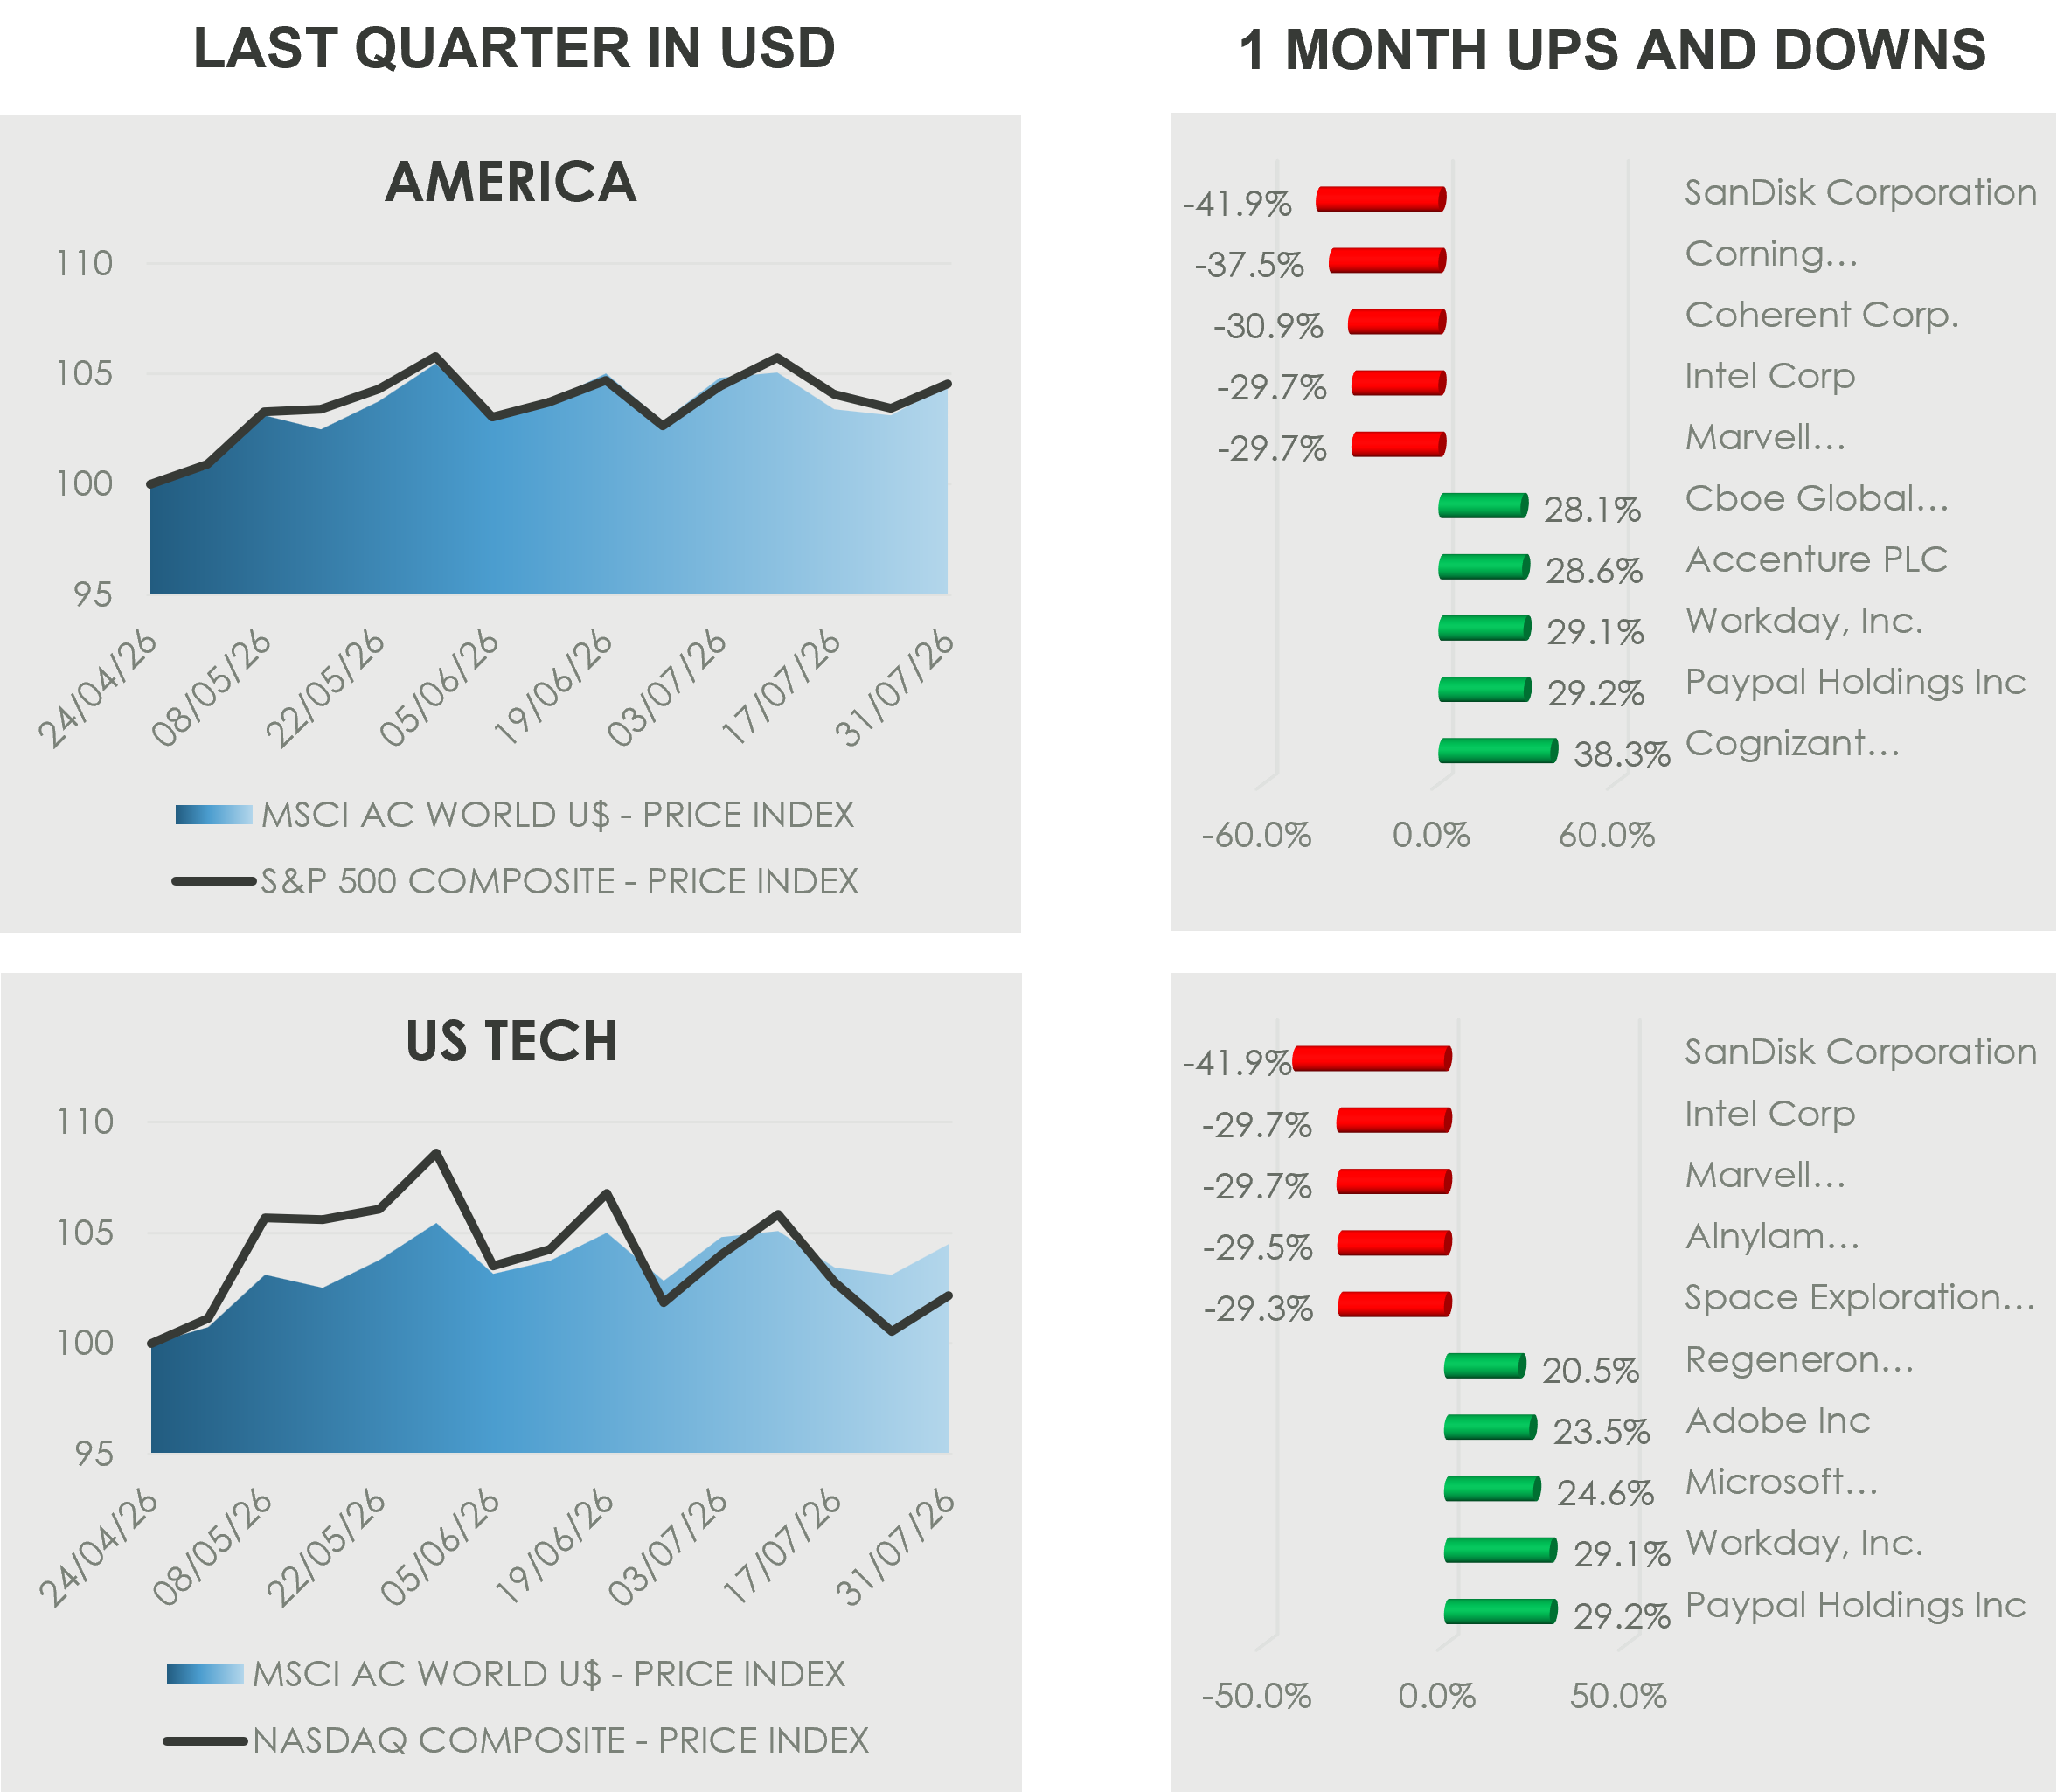
Global equities were mixed in July, as a late-month rebound in technology shares was not enough to offset weakness earlier in the month. Second-quarter earnings season has been positive, with the majority of companies reporting significantly better-than-expected results. Geopolitical tensions in the Middle East escalated, briefly pushing oil prices above $100 a barrel.
In the U.S., IT services and software led gains, with Cognizant (+38.3%), PayPal (+29.2%), Workday (+29.1%), Accenture (+28.6%) and Cboe Global Markets (+28.1%) all advanced following strong quarterly earnings and improved outlooks. Microsoft (+24.6%) and Adobe (+23.5%) also benefitted from resilient enterprise software demand and continued AI adoption, while Regeneron (+20.5%) gained after positive clinical trial data and solid quarterly results. By contrast, semiconductor and hardware names weakened, with Marvell (-29.7%), Intel (-29.7%), Coherent (-30.9%), Corning (-37.5%) and SanDisk (-41.9%) all falling after missing lofty expectations.
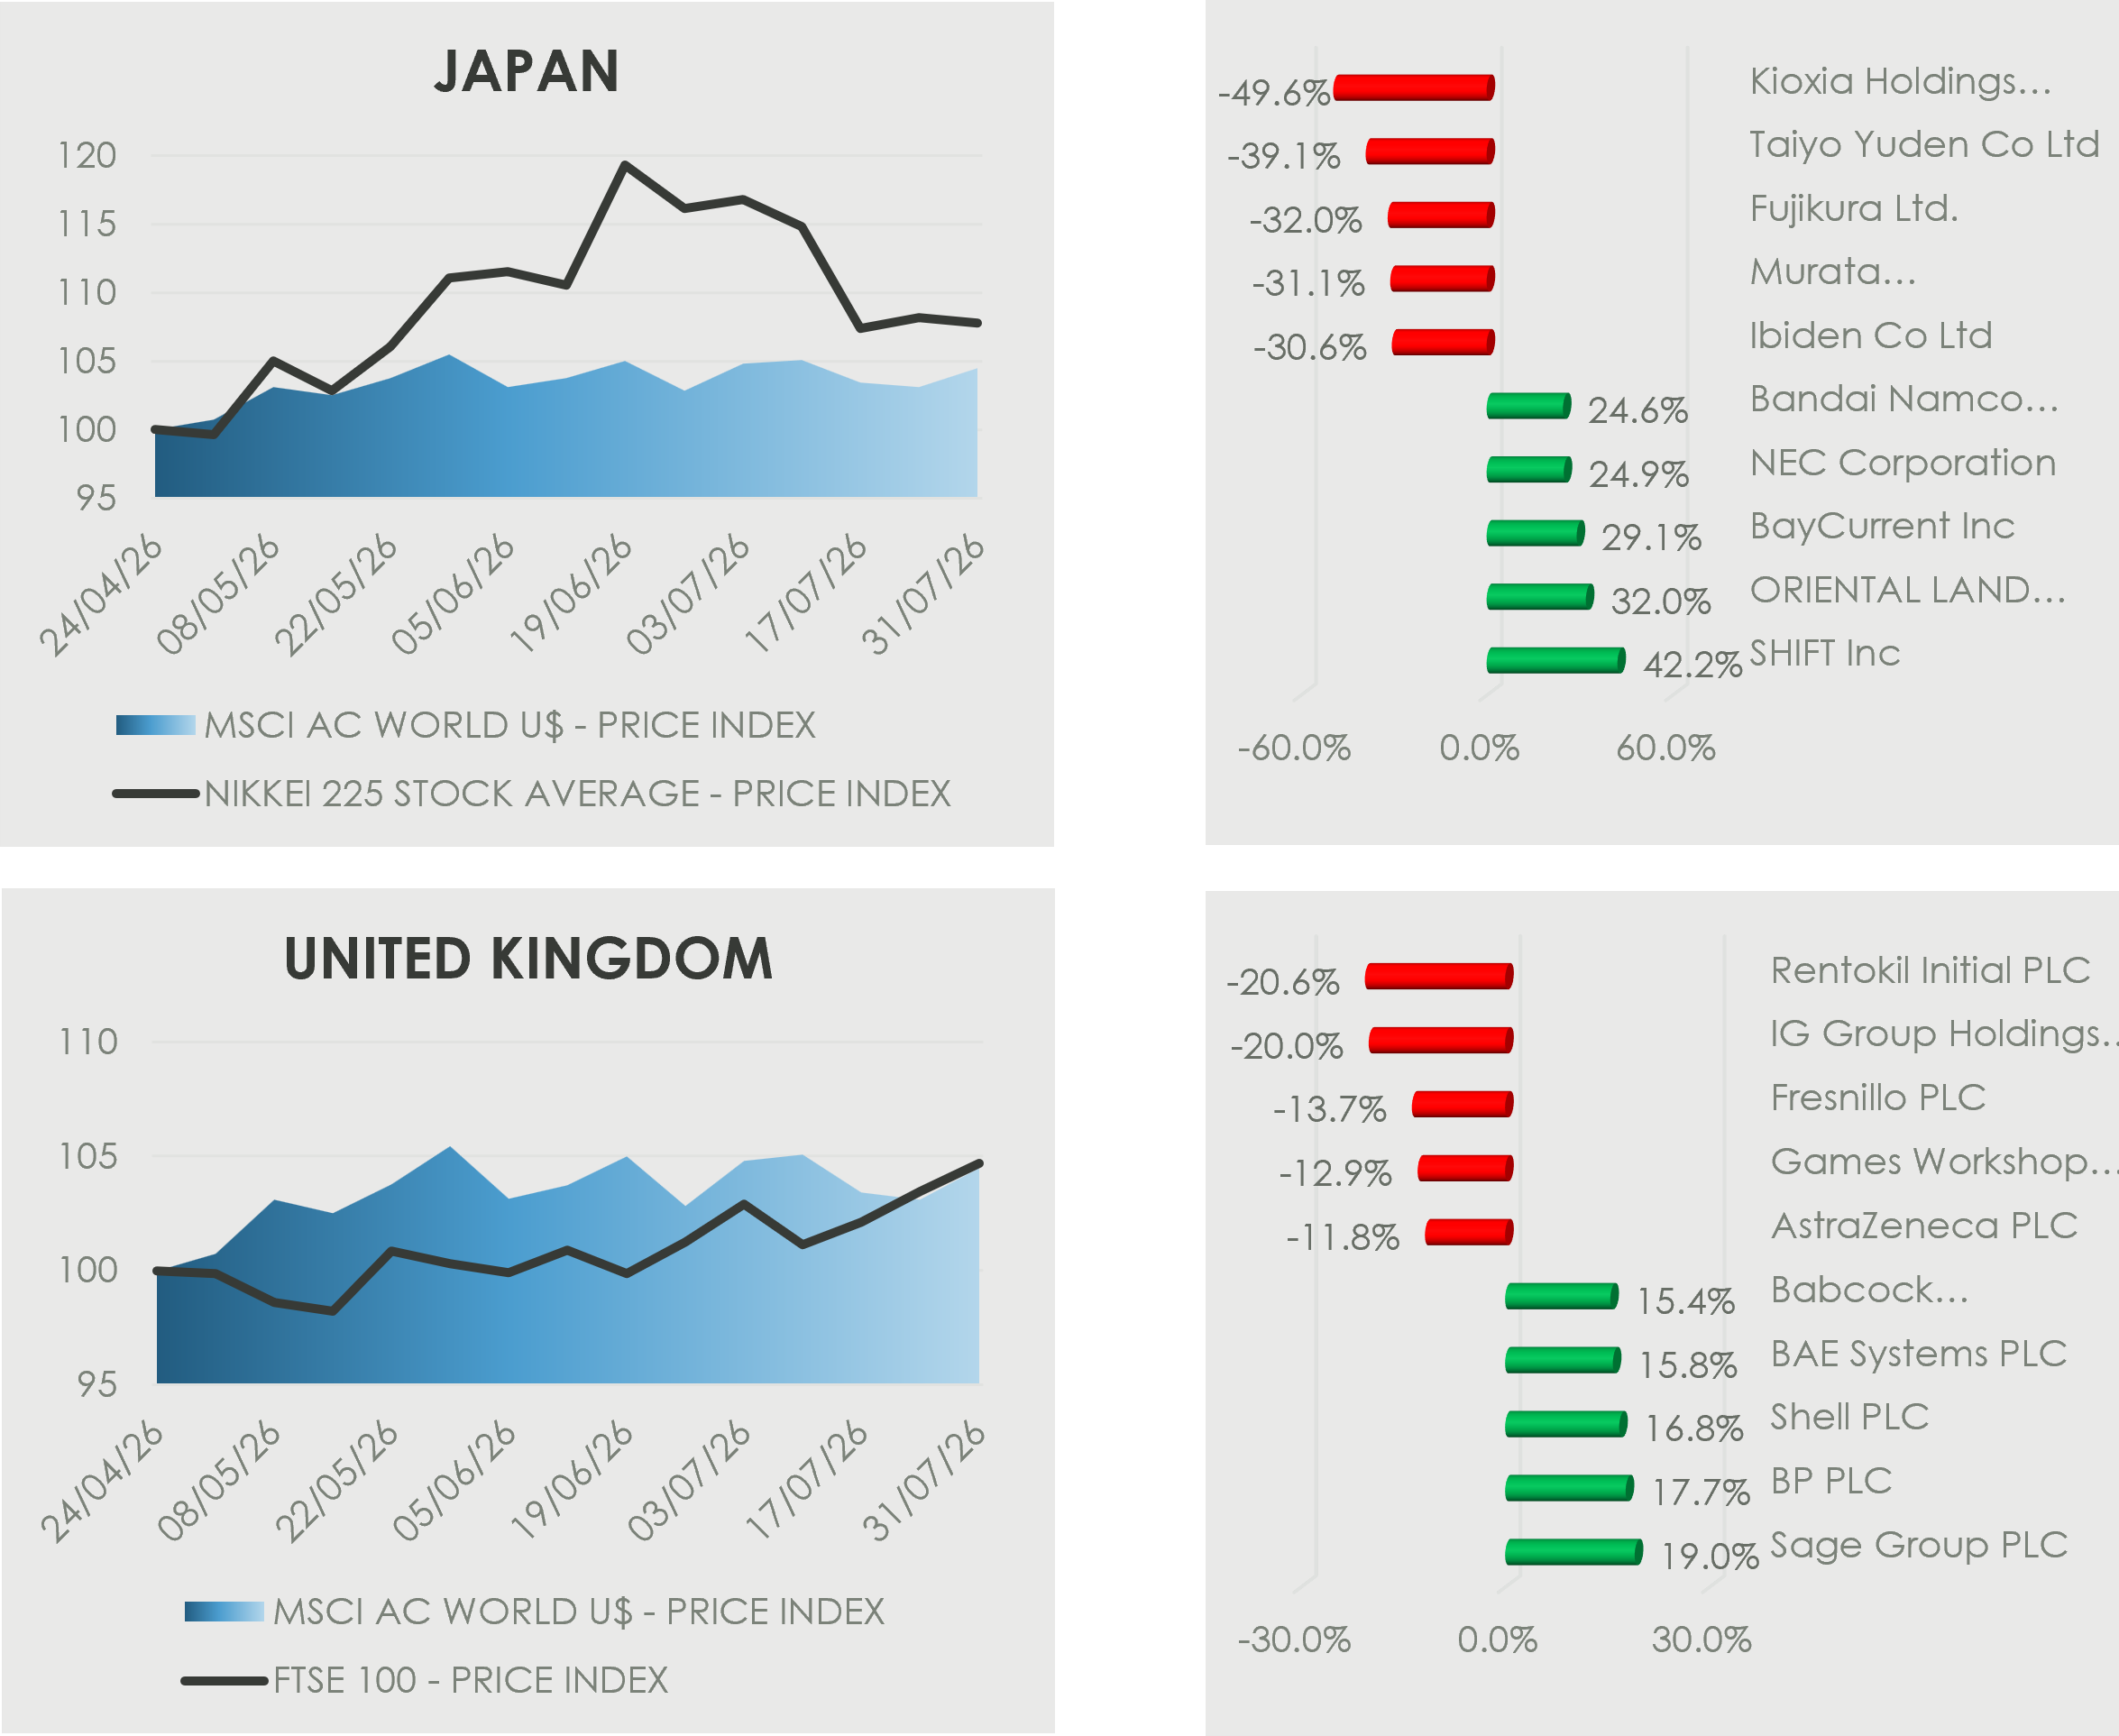
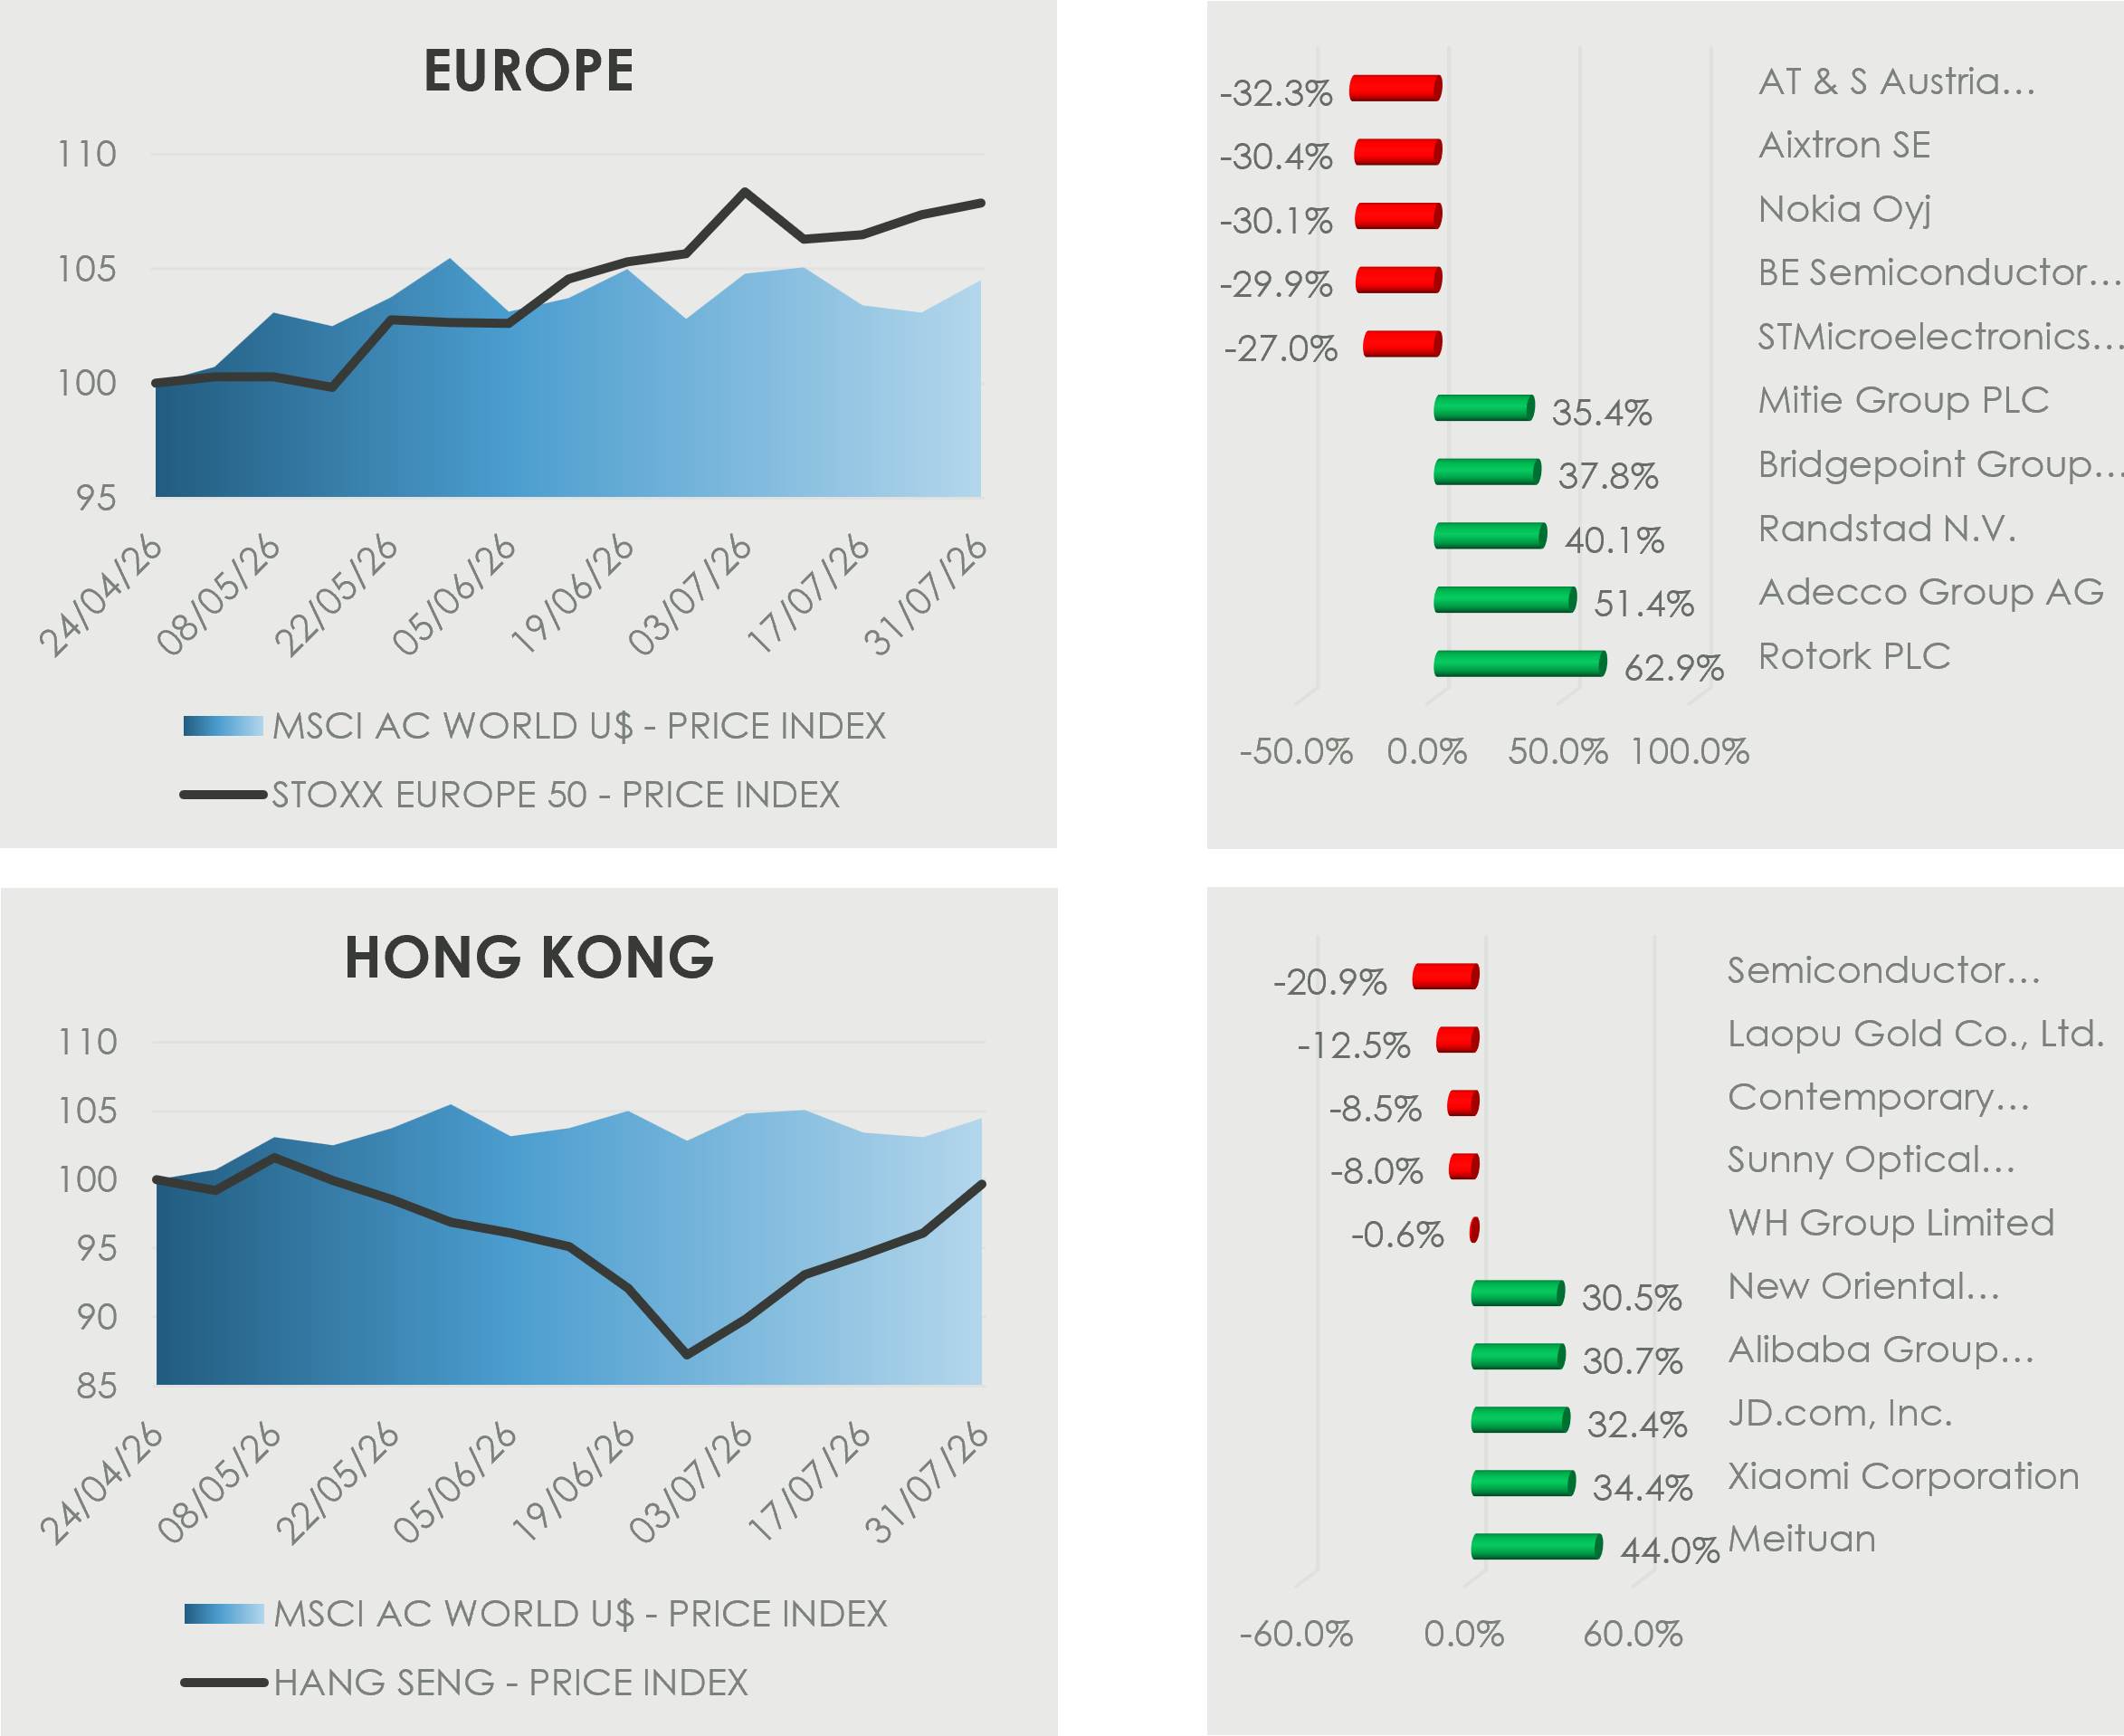
In the UK and Europe, Rotork (+62.9%), Adecco (+51.4%), Randstad (+40.1%), Bridgepoint (+37.8%) and Mitie (+35.4%) all rallied following strong earnings updates and improving corporate spending trends. Energy majors BP (+17.7%) and Shell (+16.8%) advanced alongside firmer oil prices, while defence contractors BAE Systems (+15.8%) and Babcock (+15.4%) continued to benefit from elevated defence spending. Semiconductor equipment manufacturers lagged; AT&S (-32.3%), Aixtron (-30.4%), Nokia (-30.1%), BE Semiconductor (-29.9%) and STMicroelectronics (-27.0%) all weaker as sentiment toward chipmakers softened.
Japanese equities were driven by technology services and consumer discretionary stocks. SHIFT (+42.2%), Oriental Land (+32.0%), BayCurrent (+29.1%), NEC (+24.9%) and Bandai Namco (+24.6%) all posted strong gains on solid earnings and upbeat guidance. In contrast, semiconductor component manufacturers underperformed, with Kioxia (-49.6%), Taiyo Yuden (-39.1%), Fujikura (-32.0%), Murata (-31.1%) and Ibiden (-30.6%) all retreating as investors rotated out of chip-related names following their strong performance in previous months.
Hong Kong equities were led by technology and internet platforms. Meituan (+44.0%), Xiaomi (+34.4%), JD.com (+32.4%), Alibaba (+30.7%) and New Oriental Education (+30.5%) all rallied on stronger-than-expected earnings and improving sentiment toward China’s tech sector.
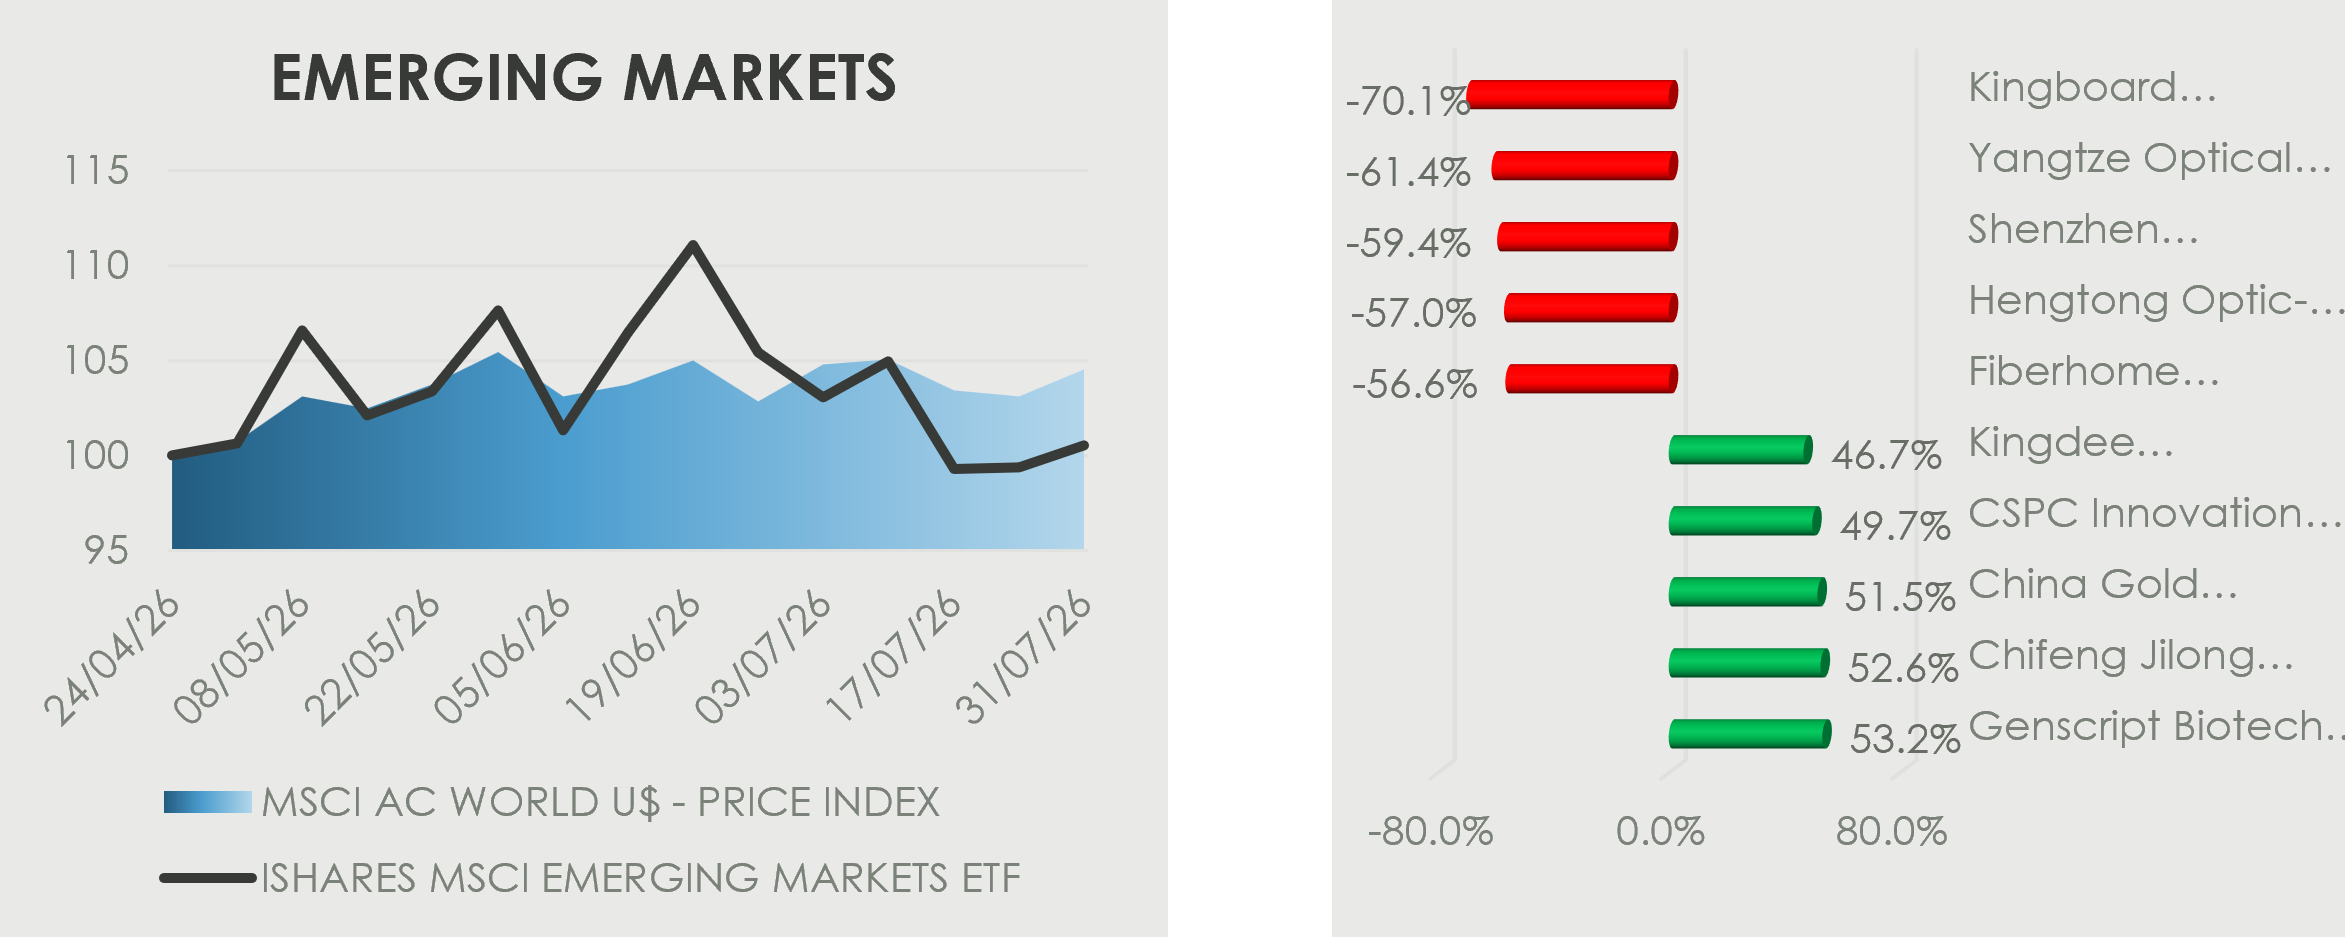
Emerging markets were supported by healthcare, gold mining and software companies. GenScript Biotech (+53.2%), Chifeng Jilong Gold (+52.6%), China Gold International (+51.5%), CSPC Innovation Pharmaceutical (+49.7%) and Kingdee (+46.7%) all delivered strong gains, supported by improving commodity prices and continued investment in healthcare and enterprise software. Conversely, weakness was concentrated in Chinese telecommunications and optical networking companies, with Kingboard Laminates (-70.1%), Yangtze Optical Fibre (-61.4%), Shenzhen Techwinsemi (-59.4%), Hengtong Optic-Electric (-57.0%) and Fiberhome (-56.6%) all declining sharply following weaker demand expectations for communications infrastructure.
Stellar results this quarter strengthen our conviction that the massive investments made in Cloud and AI infrastructure are beginning to translate into accelerating revenue growth, rapidly expanding backlogs, and stronger profitability. Consequently, we remain bullish on the major hyperscalers and believe we are still in the early stages of AI monetization.
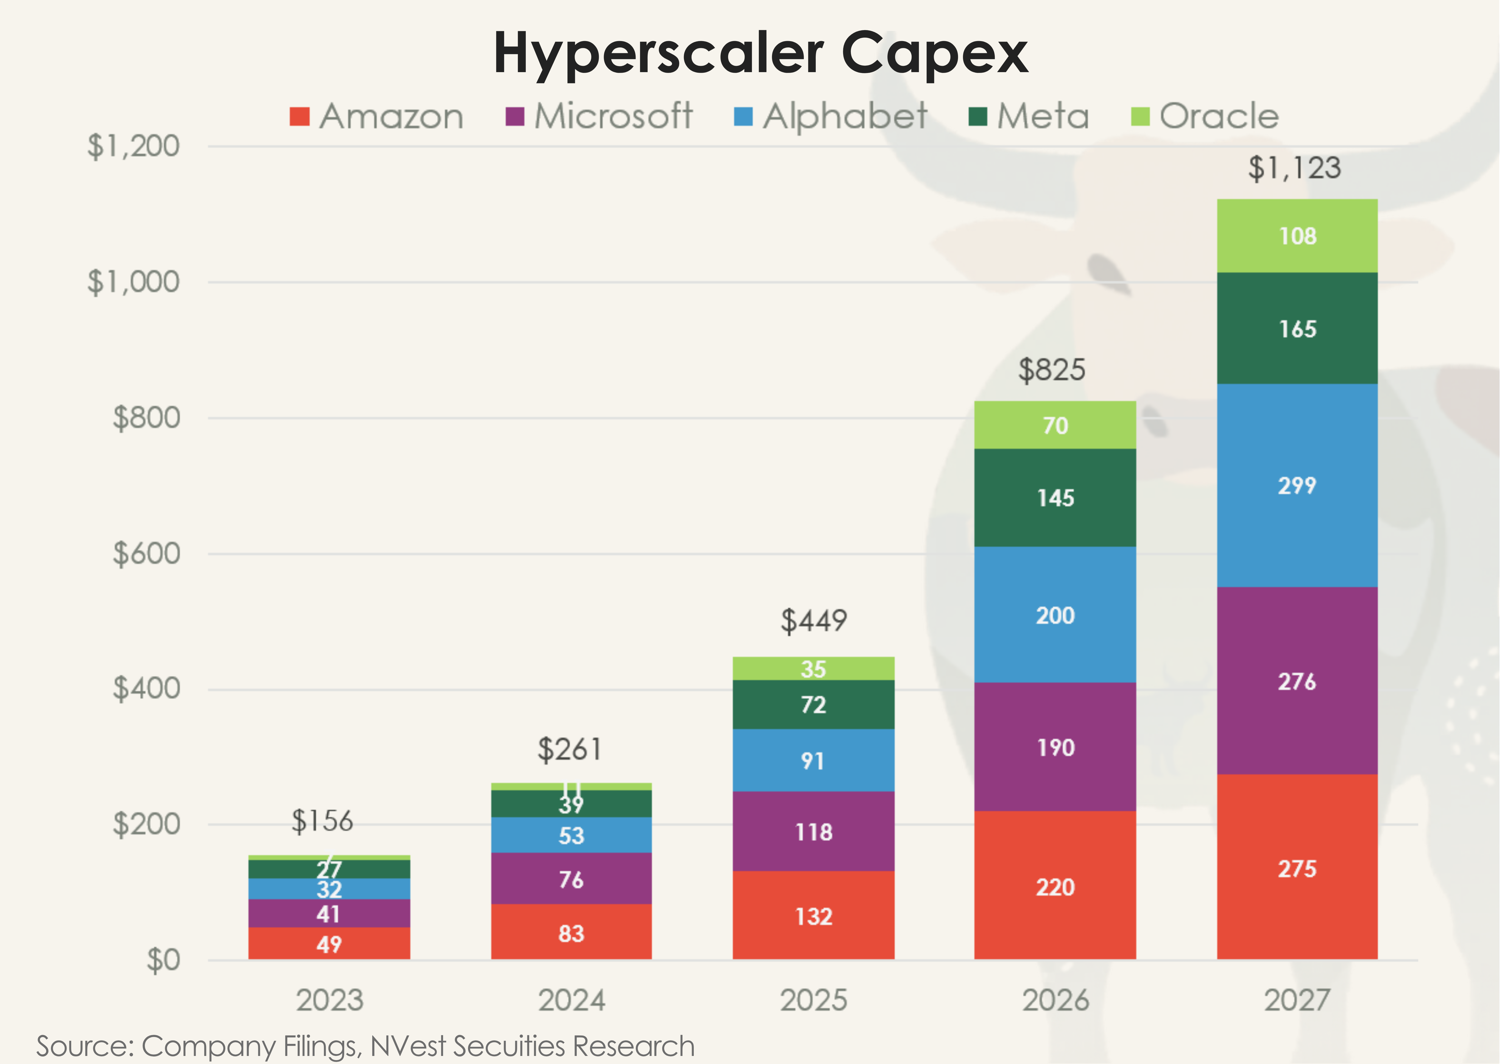
Q2 earnings season saw major hyperscalers raise capex guidance yet again; reiterating that demand continues to outpace available capacity. Combined capex from Amazon, Microsoft, Alphabet, Meta and Oracle is estimated to reach an eye-watering $1.1 trillion in 2027.
Capex Continues to Climb
Capex build-out shows no sign of slow down, as the continued upward revisions suggest that the demand for capacity remains greater than previously anticipated.
-
-
- Amazon raised its FY26 capex guidance to approximately $220 billion (71% year-over-year (Y/Y)). Management continues to expect capacity constraints through 2027 and remains confident in the long-term returns available from AI investment.
- Alphabet increased its capex guidance to $195–205 billion, reflecting continued AI demand in excess of available supply. Expectations for 2027 have also moved materially higher.
- Microsoft’s reported capex expectation has moved from approximately $190 billion to $175 billion, but reflects the reclassification of certain data-centre leases from finance leases to operating leases and not a reduction in infrastructure investment. AI infrastructure remains the priority, with management noting that customers are screaming for more supply.
-
Cloud Monetization Is Accelerating
Results showed broad-based acceleration across the major Cloud platforms, as monetization steps up. Amazon Web Services (AWS) grew 37% Y/Y, Microsoft Azure grew 43% and Google Cloud accelerated to 82%.
What is particularly encouraging is that these growth rates are being achieved despite being constrained – constrained by limited capacity in data centers, insufficient power supply, shortages in qualified labour such as electricians and plumbers to get the data centers up and running, as well as shortages in advanced semiconductor chips.
As these constraints resolve additional capacity from coming online, backlog keeps growing.
Backlog Provides Evidence that AI Demand Has a Long Runway
Combined order backlog across the big four hyperscalers reached $2.33 trillion this quarter, up from $809 billion a year ago (+188.3%). Amazon recorded the largest sequential increase, adding $132 billion of backlog during the quarter; representing growth of 154% Y/Y and 36% Q/Q.
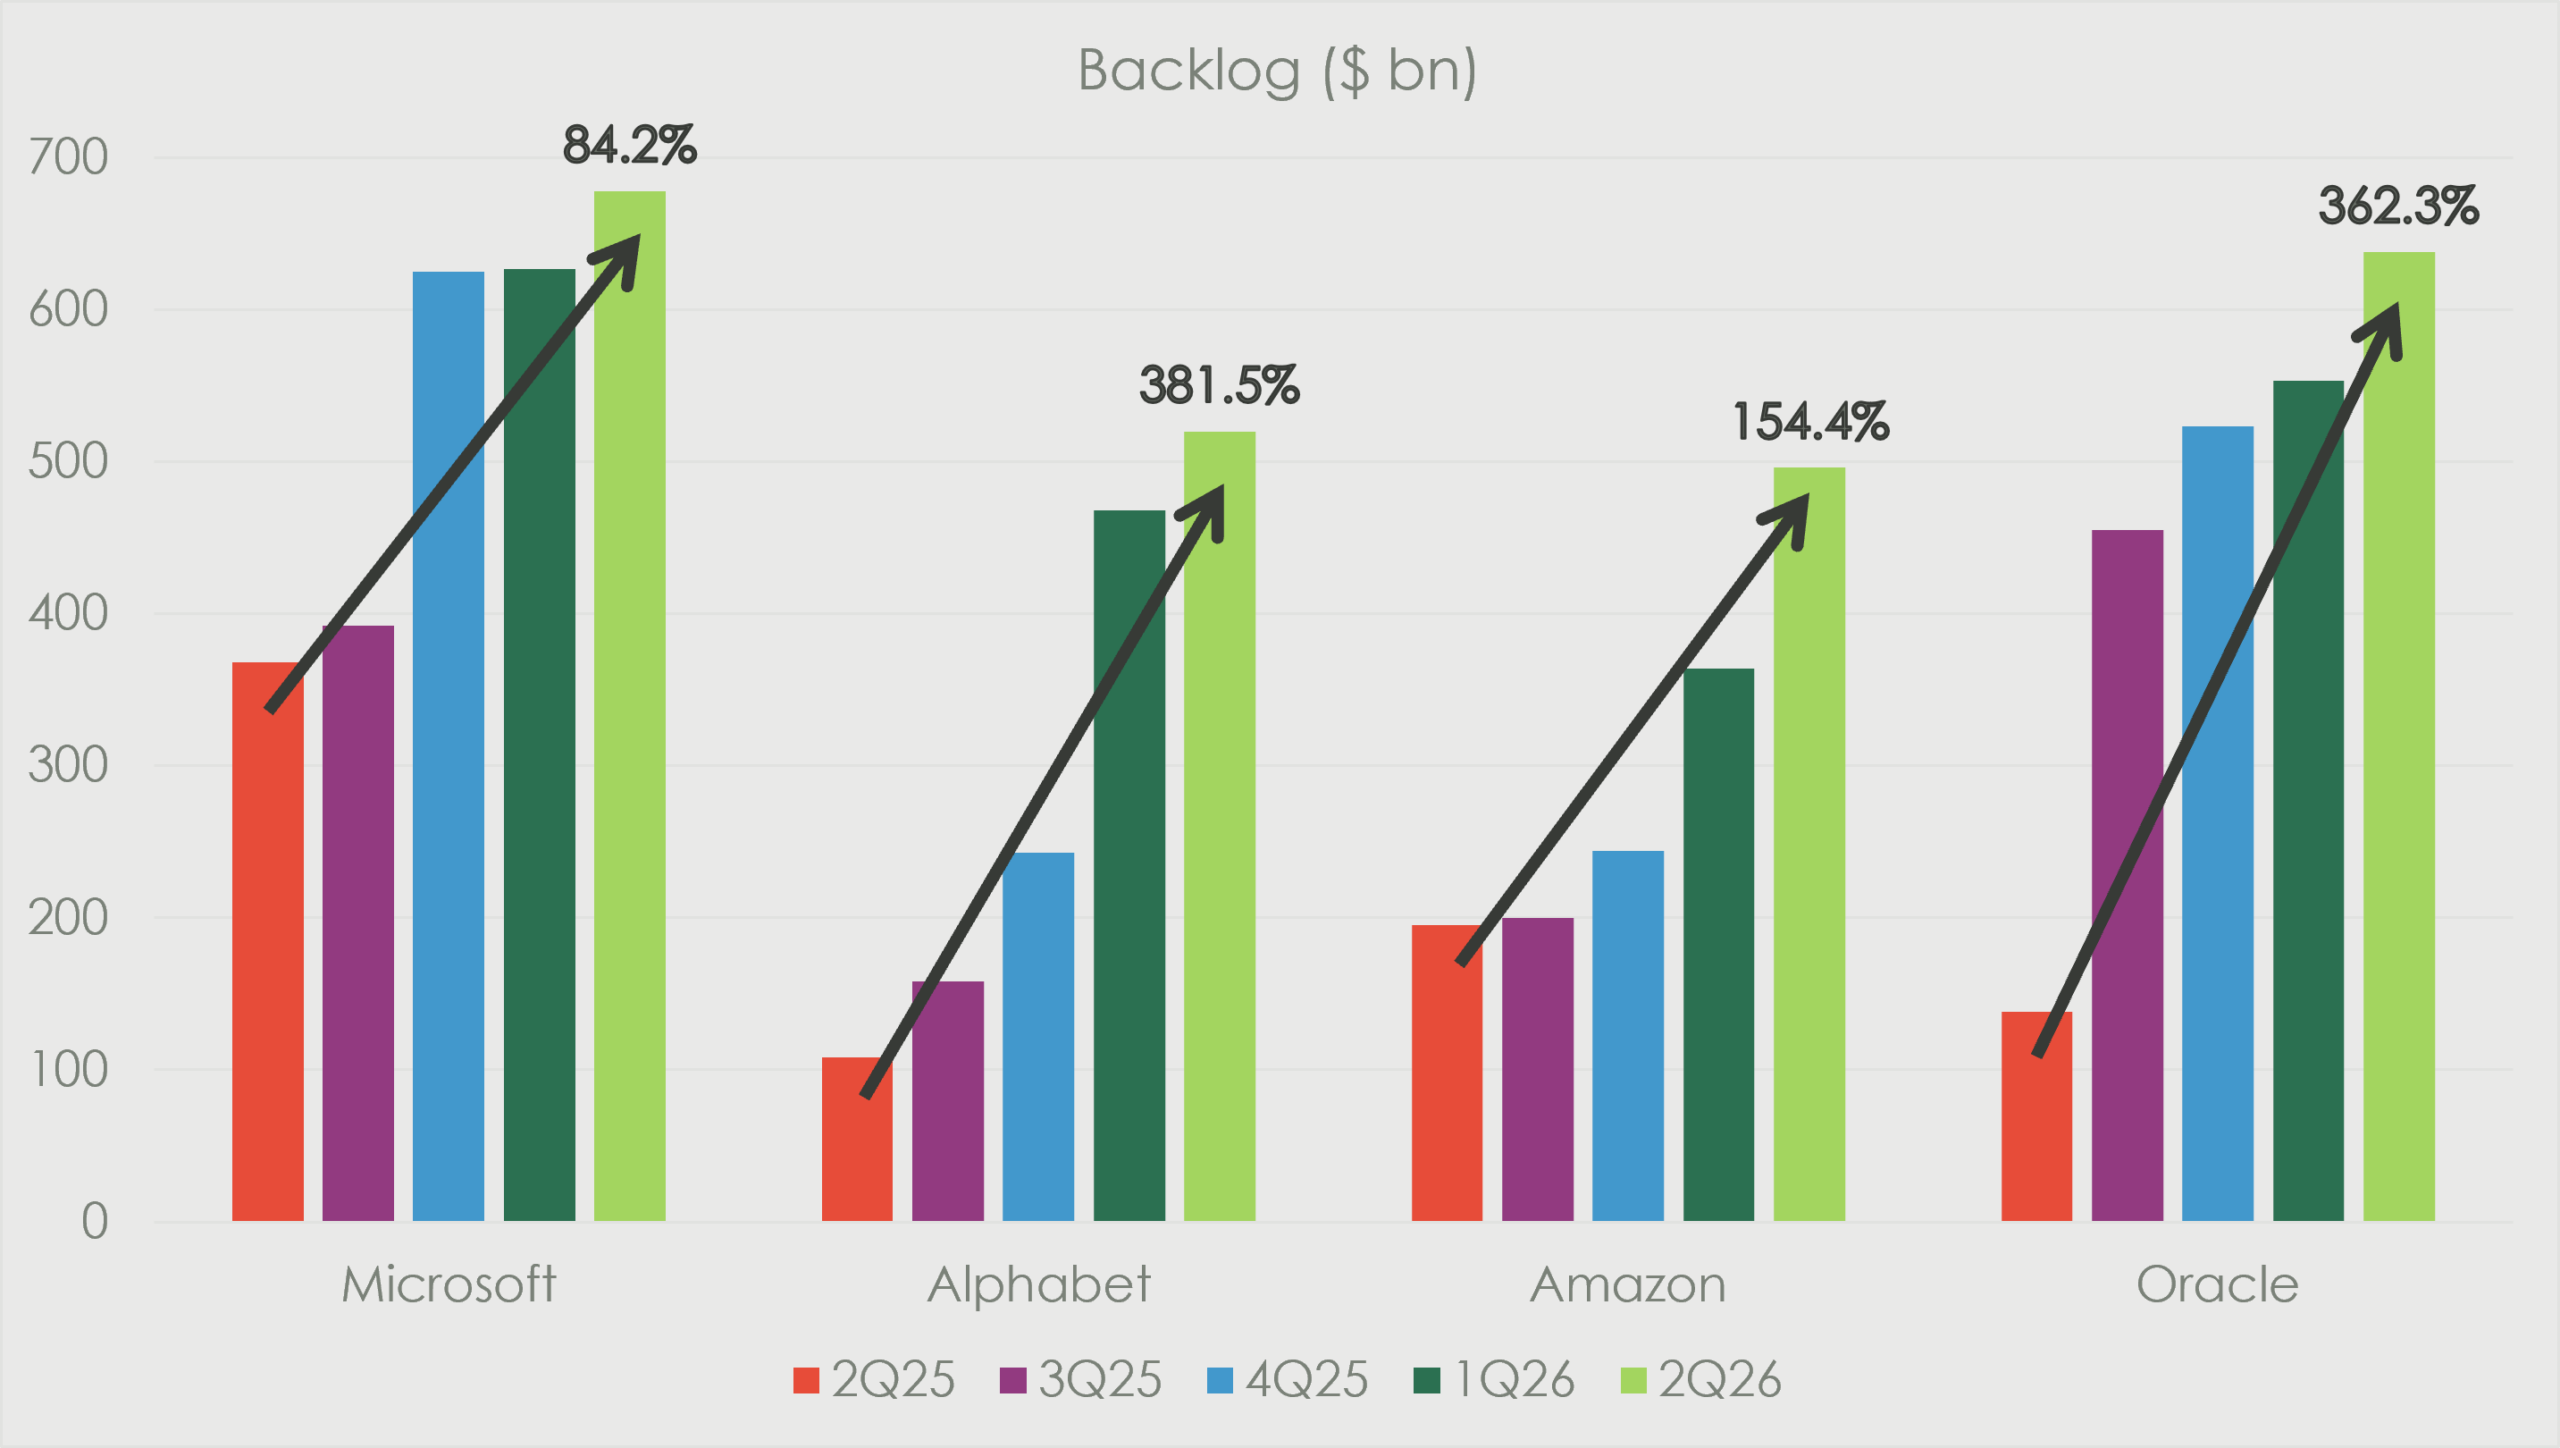
Backlog growth shows the depth of demand and is an indicator of future revenues. Customers continue to commit to significantly more capacity, and backlog is expanding rapidly – outpacing the increase in infrastructure spending.

Profitability Expands Despite the Heavy AI Investment
This is no longer a story about increasing capex, but also about the returns on those investments. As new capacity comes online and is quickly absorbed, the major Cloud platforms are becoming more efficient at utilising that capacity and converting it into revenue and profit growth.
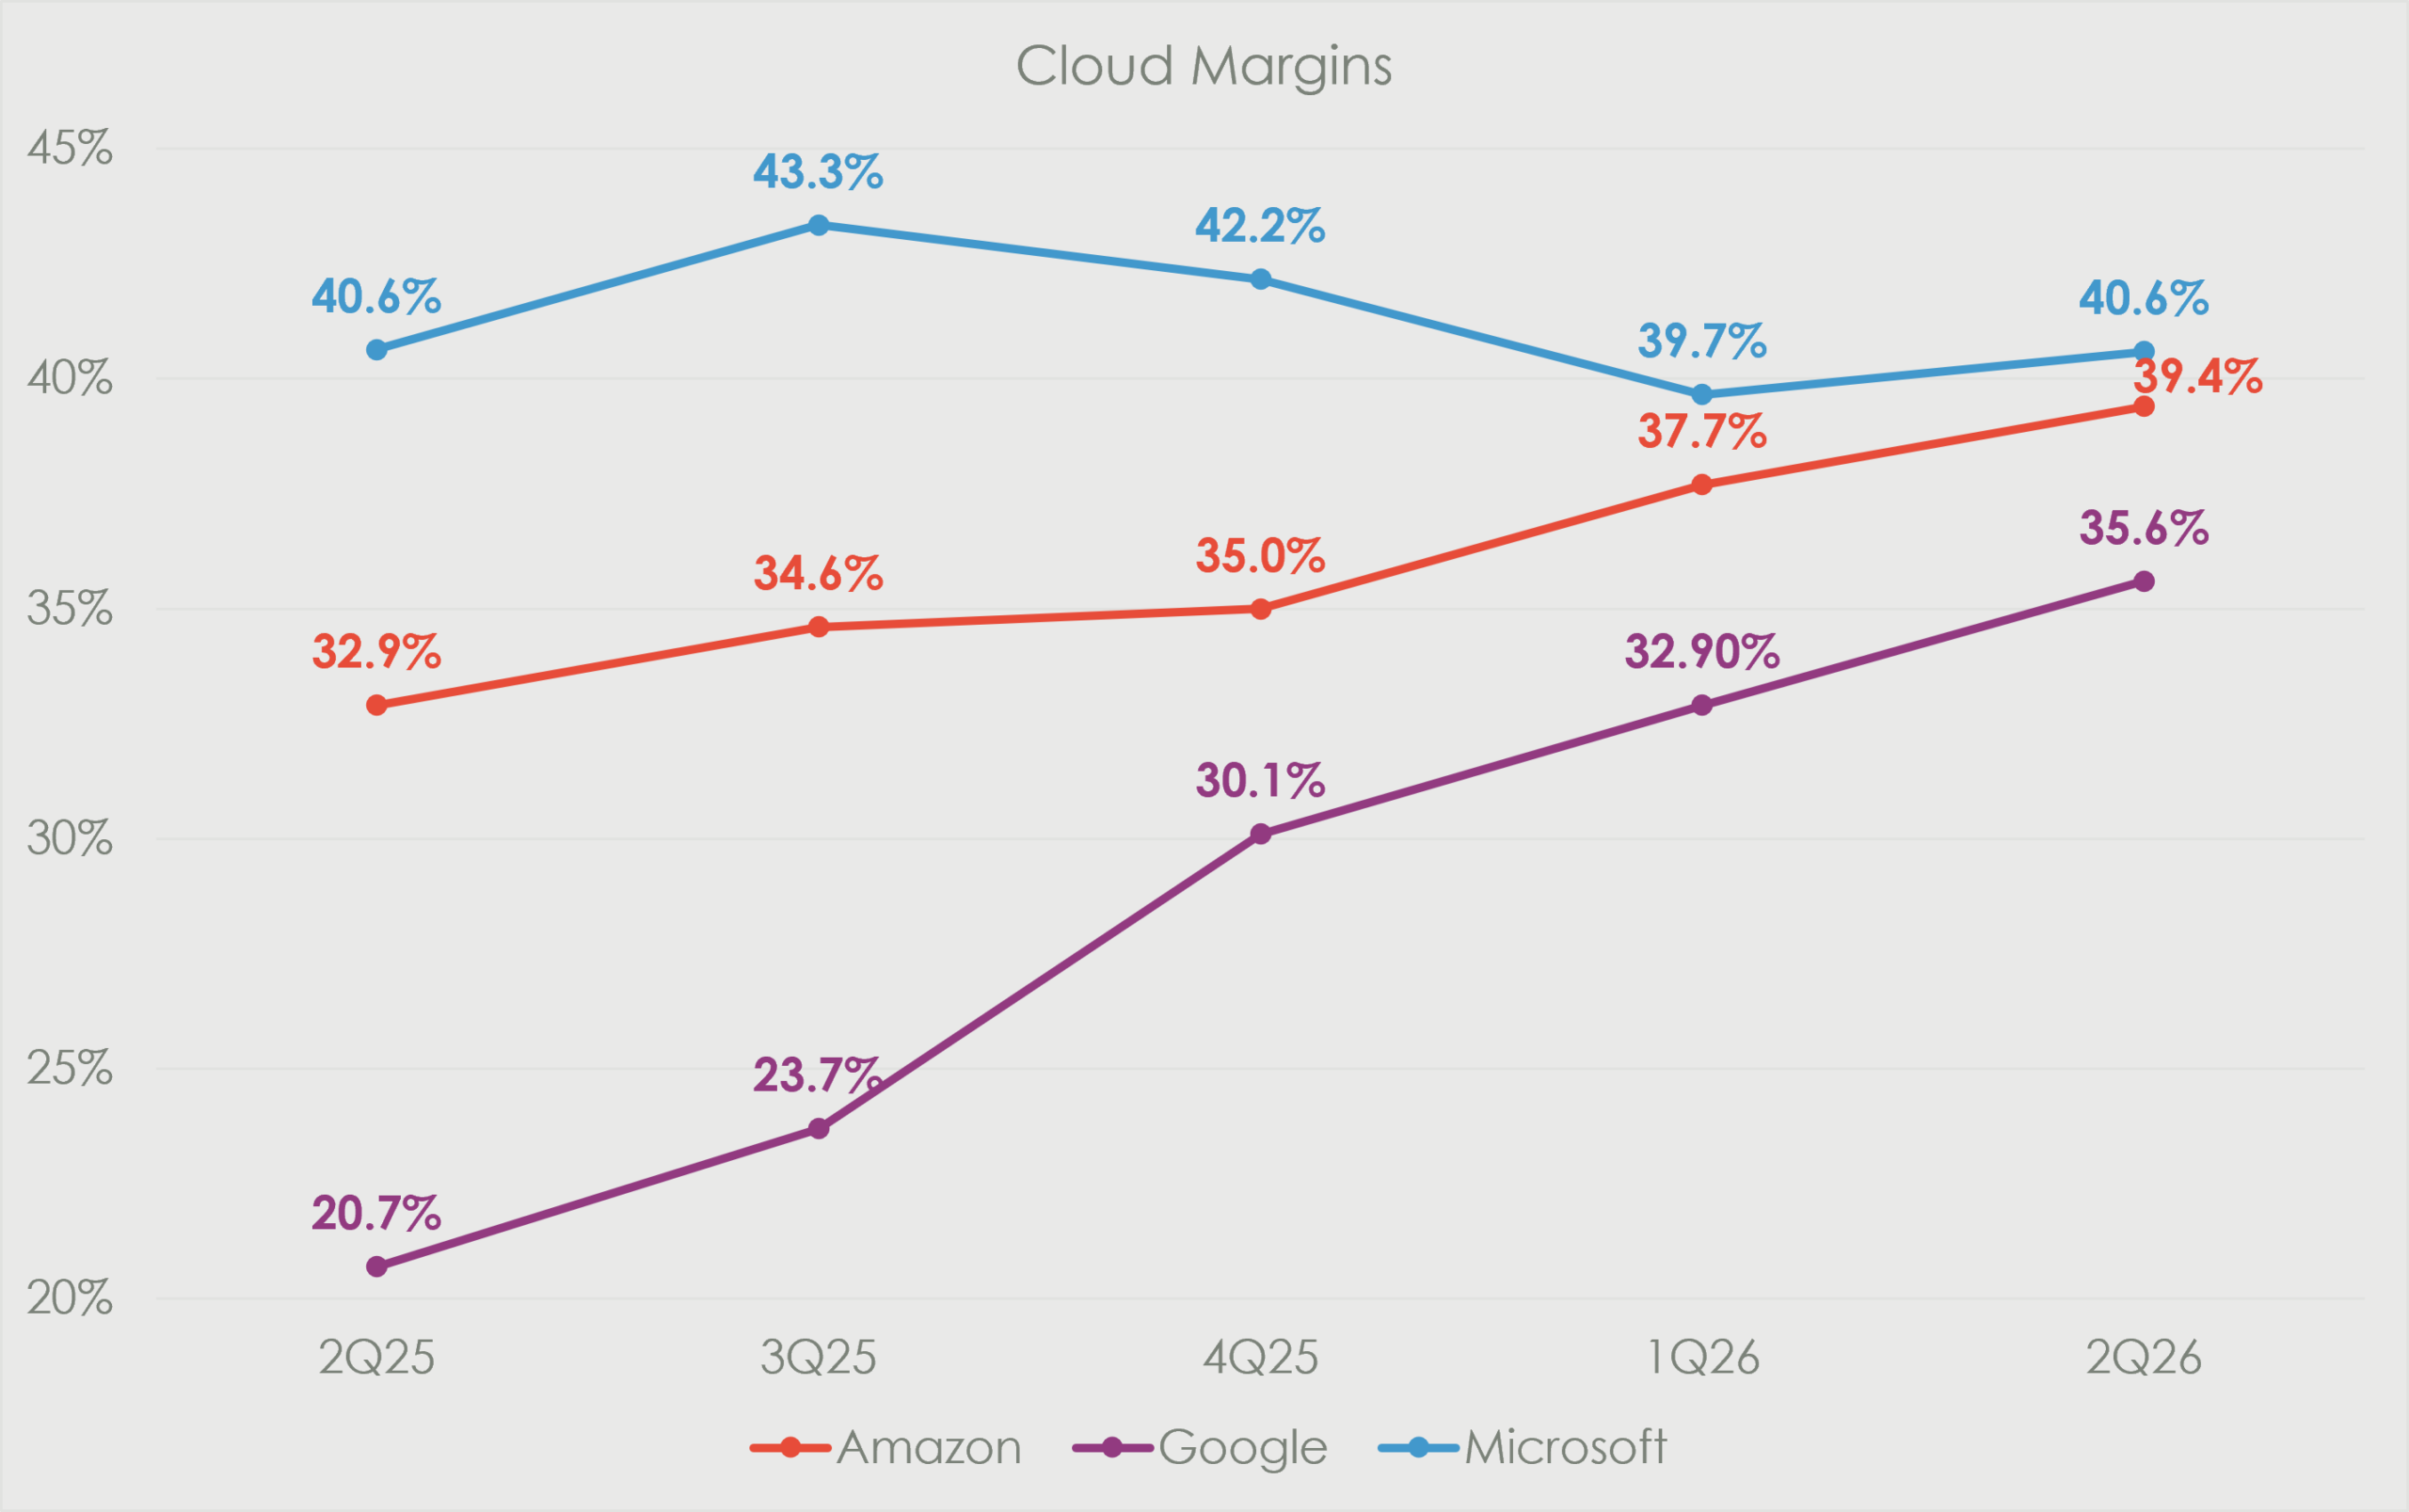
Portfolio Positioning
Microsoft, Alphabet and Amazon are particularly well positioned for the next phase of AI and all three have a distinct advantage. Microsoft has an entrenched presence across the enterprise space; Alphabet combines its AI models with an enormous consumer, data and distribution ecosystem; and Amazon operates the largest individual hyperscale Cloud platform, giving AWS a substantial installed customer base to deploy AI services.
We already hold both Microsoft and Alphabet in the portfolio, and recently added Amazon ahead of the company’s second-quarter earnings release.
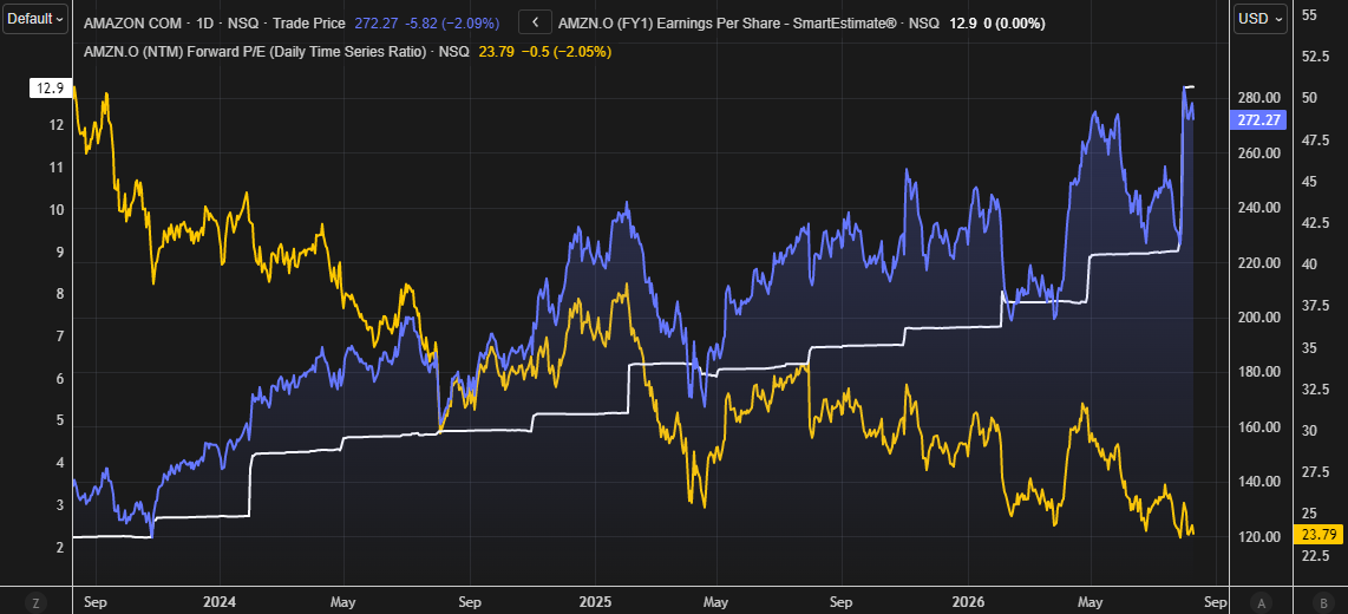
Shares rallied 15% after results showed material earnings acceleration in AWS, with growth accelerating to 37%, and backlog increasing by $132 billion sequentially – the largest backlog increase among the major hyperscalers. The average contract also extended to 6.4 years, providing greater visibility into future revenue. Amazon continues to invest aggressively, with capacity expected to roughly double between 2025 and 2027 – from 3.9GW to an estimated 7.8GW.
From a valuation perspective, Amazon is trading at the lower end of its historical range, at approximately 23.8x earnings, despite expectations for double-digit earnings growth. We believe Amazon is well positioned to convert its substantial investment in Cloud and AI infrastructure into accelerating revenue and earnings growth.
Conclusion
The latest results reinforce our view that AI monetization remains in its early stages. Accelerating Cloud growth, expanding backlogs, and improving profitability support our bullish outlook on Microsoft, Alphabet and Amazon.

By the Numbers
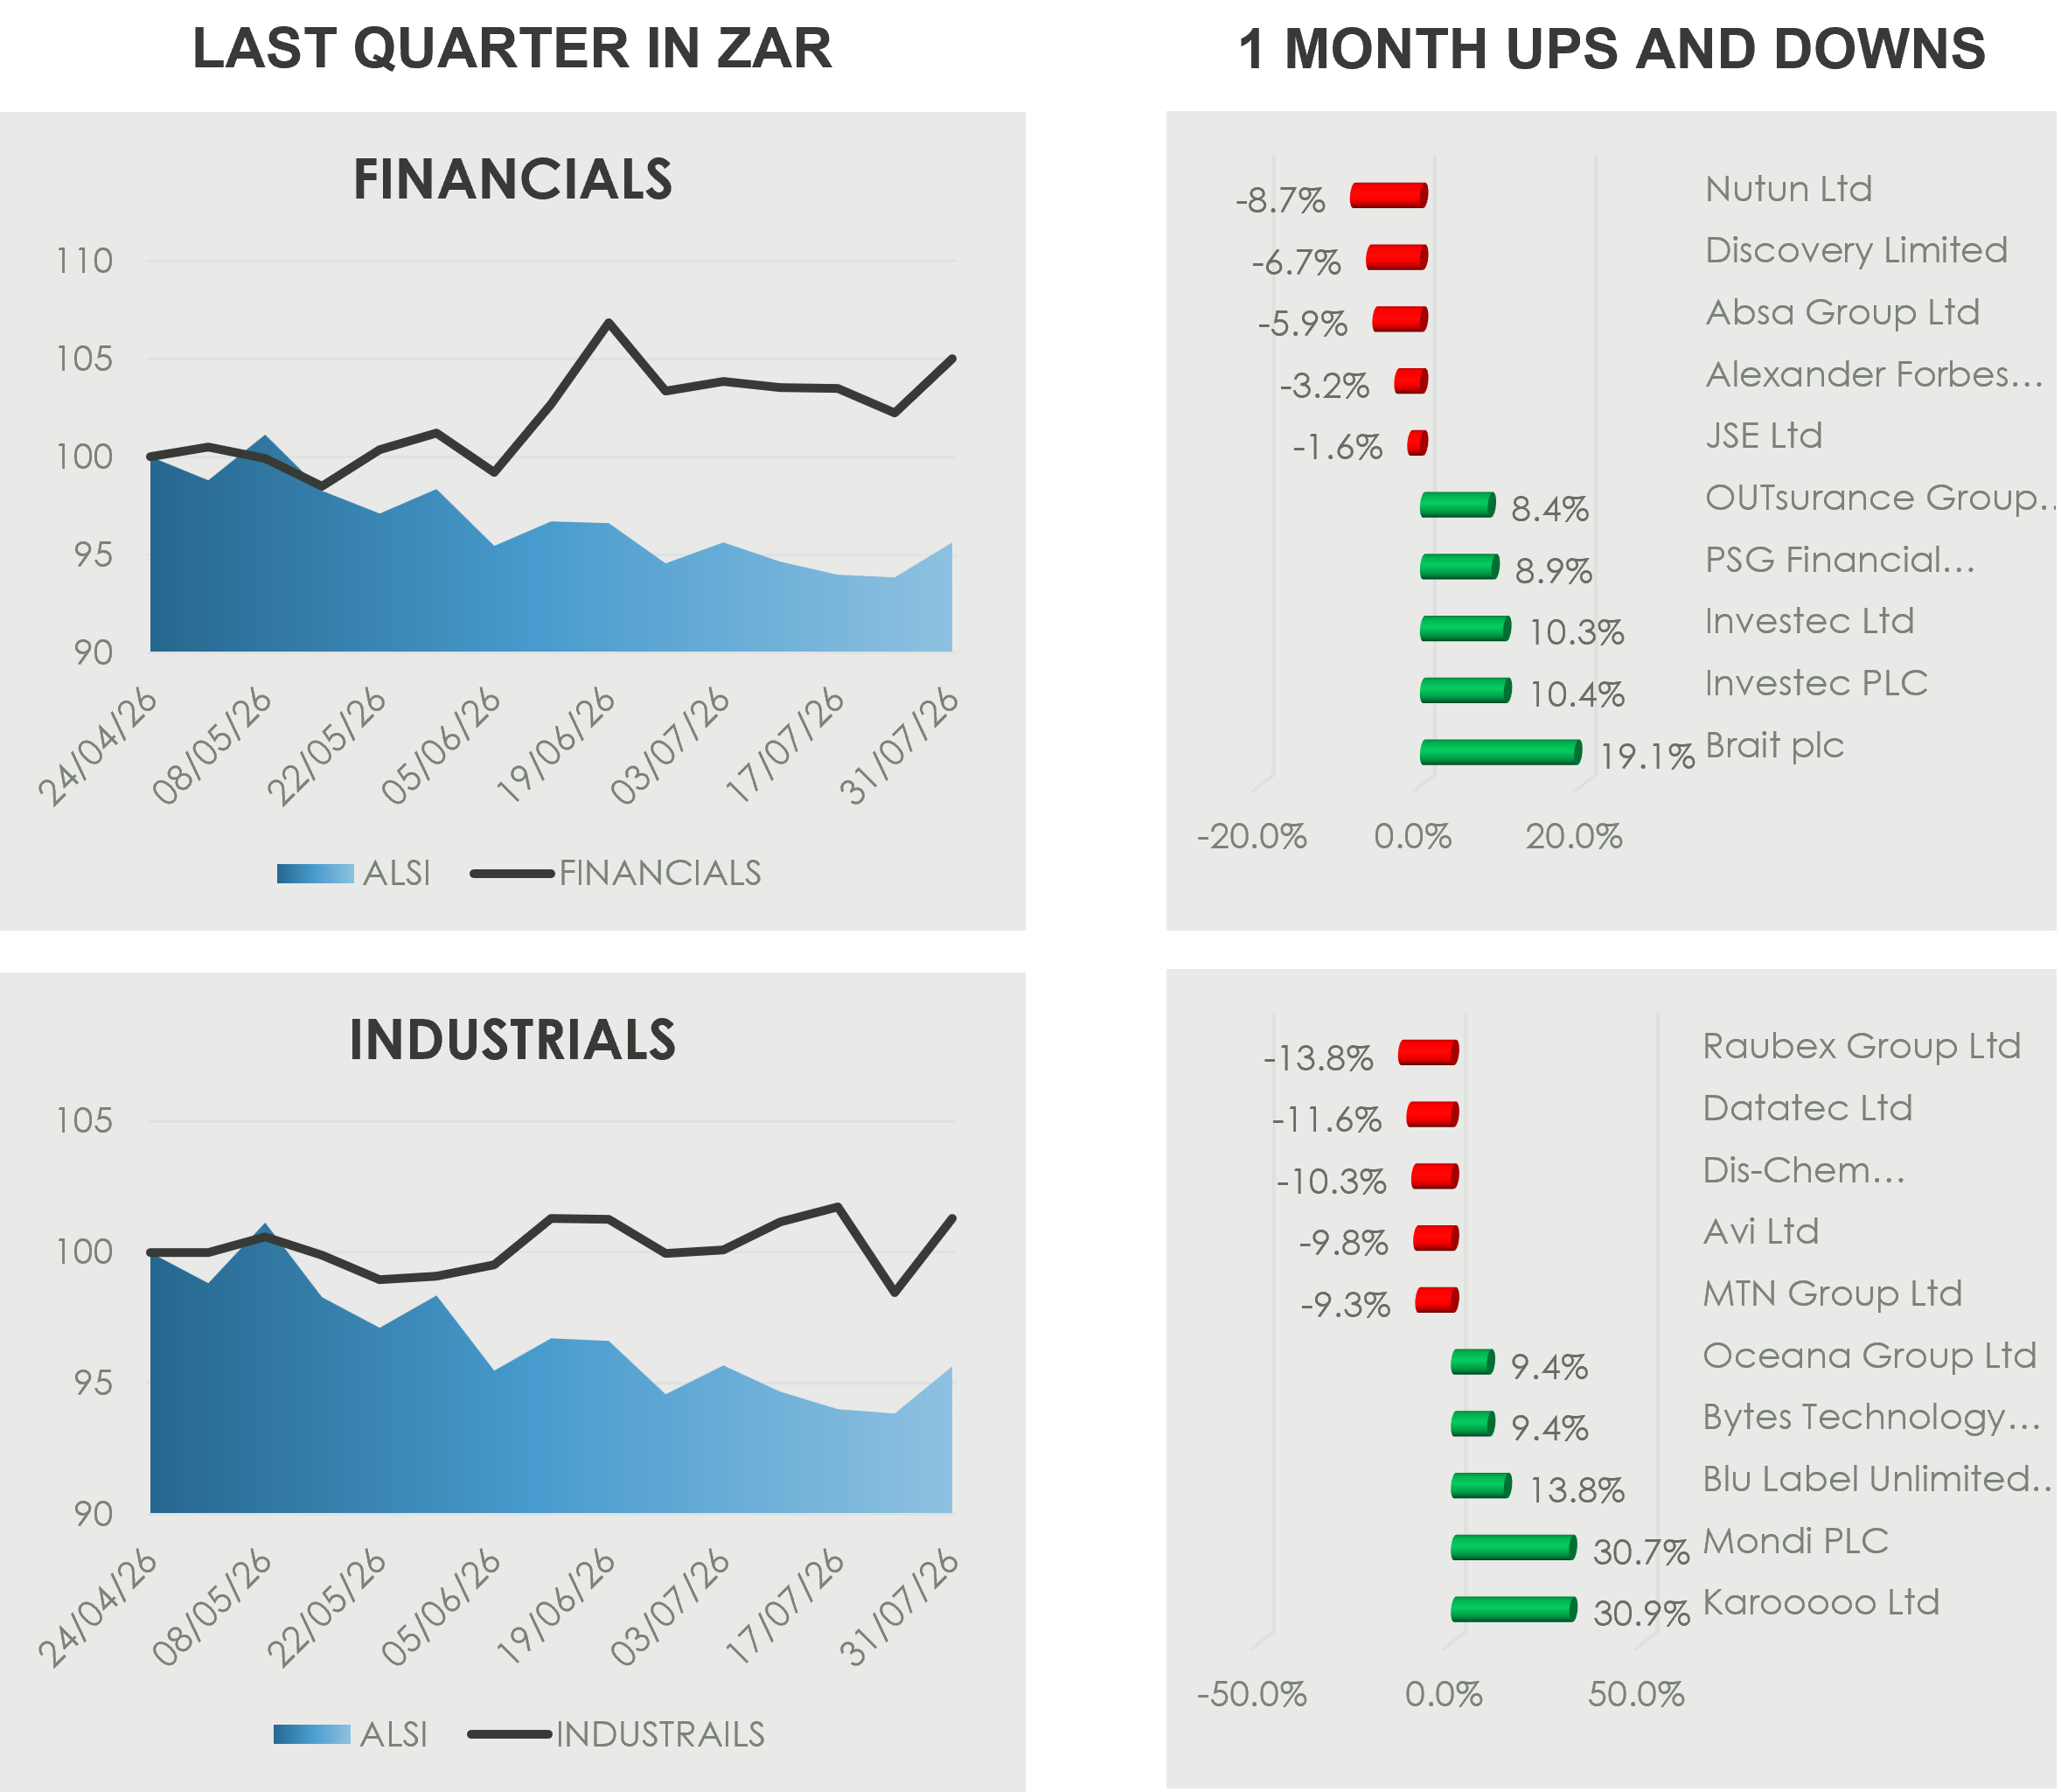
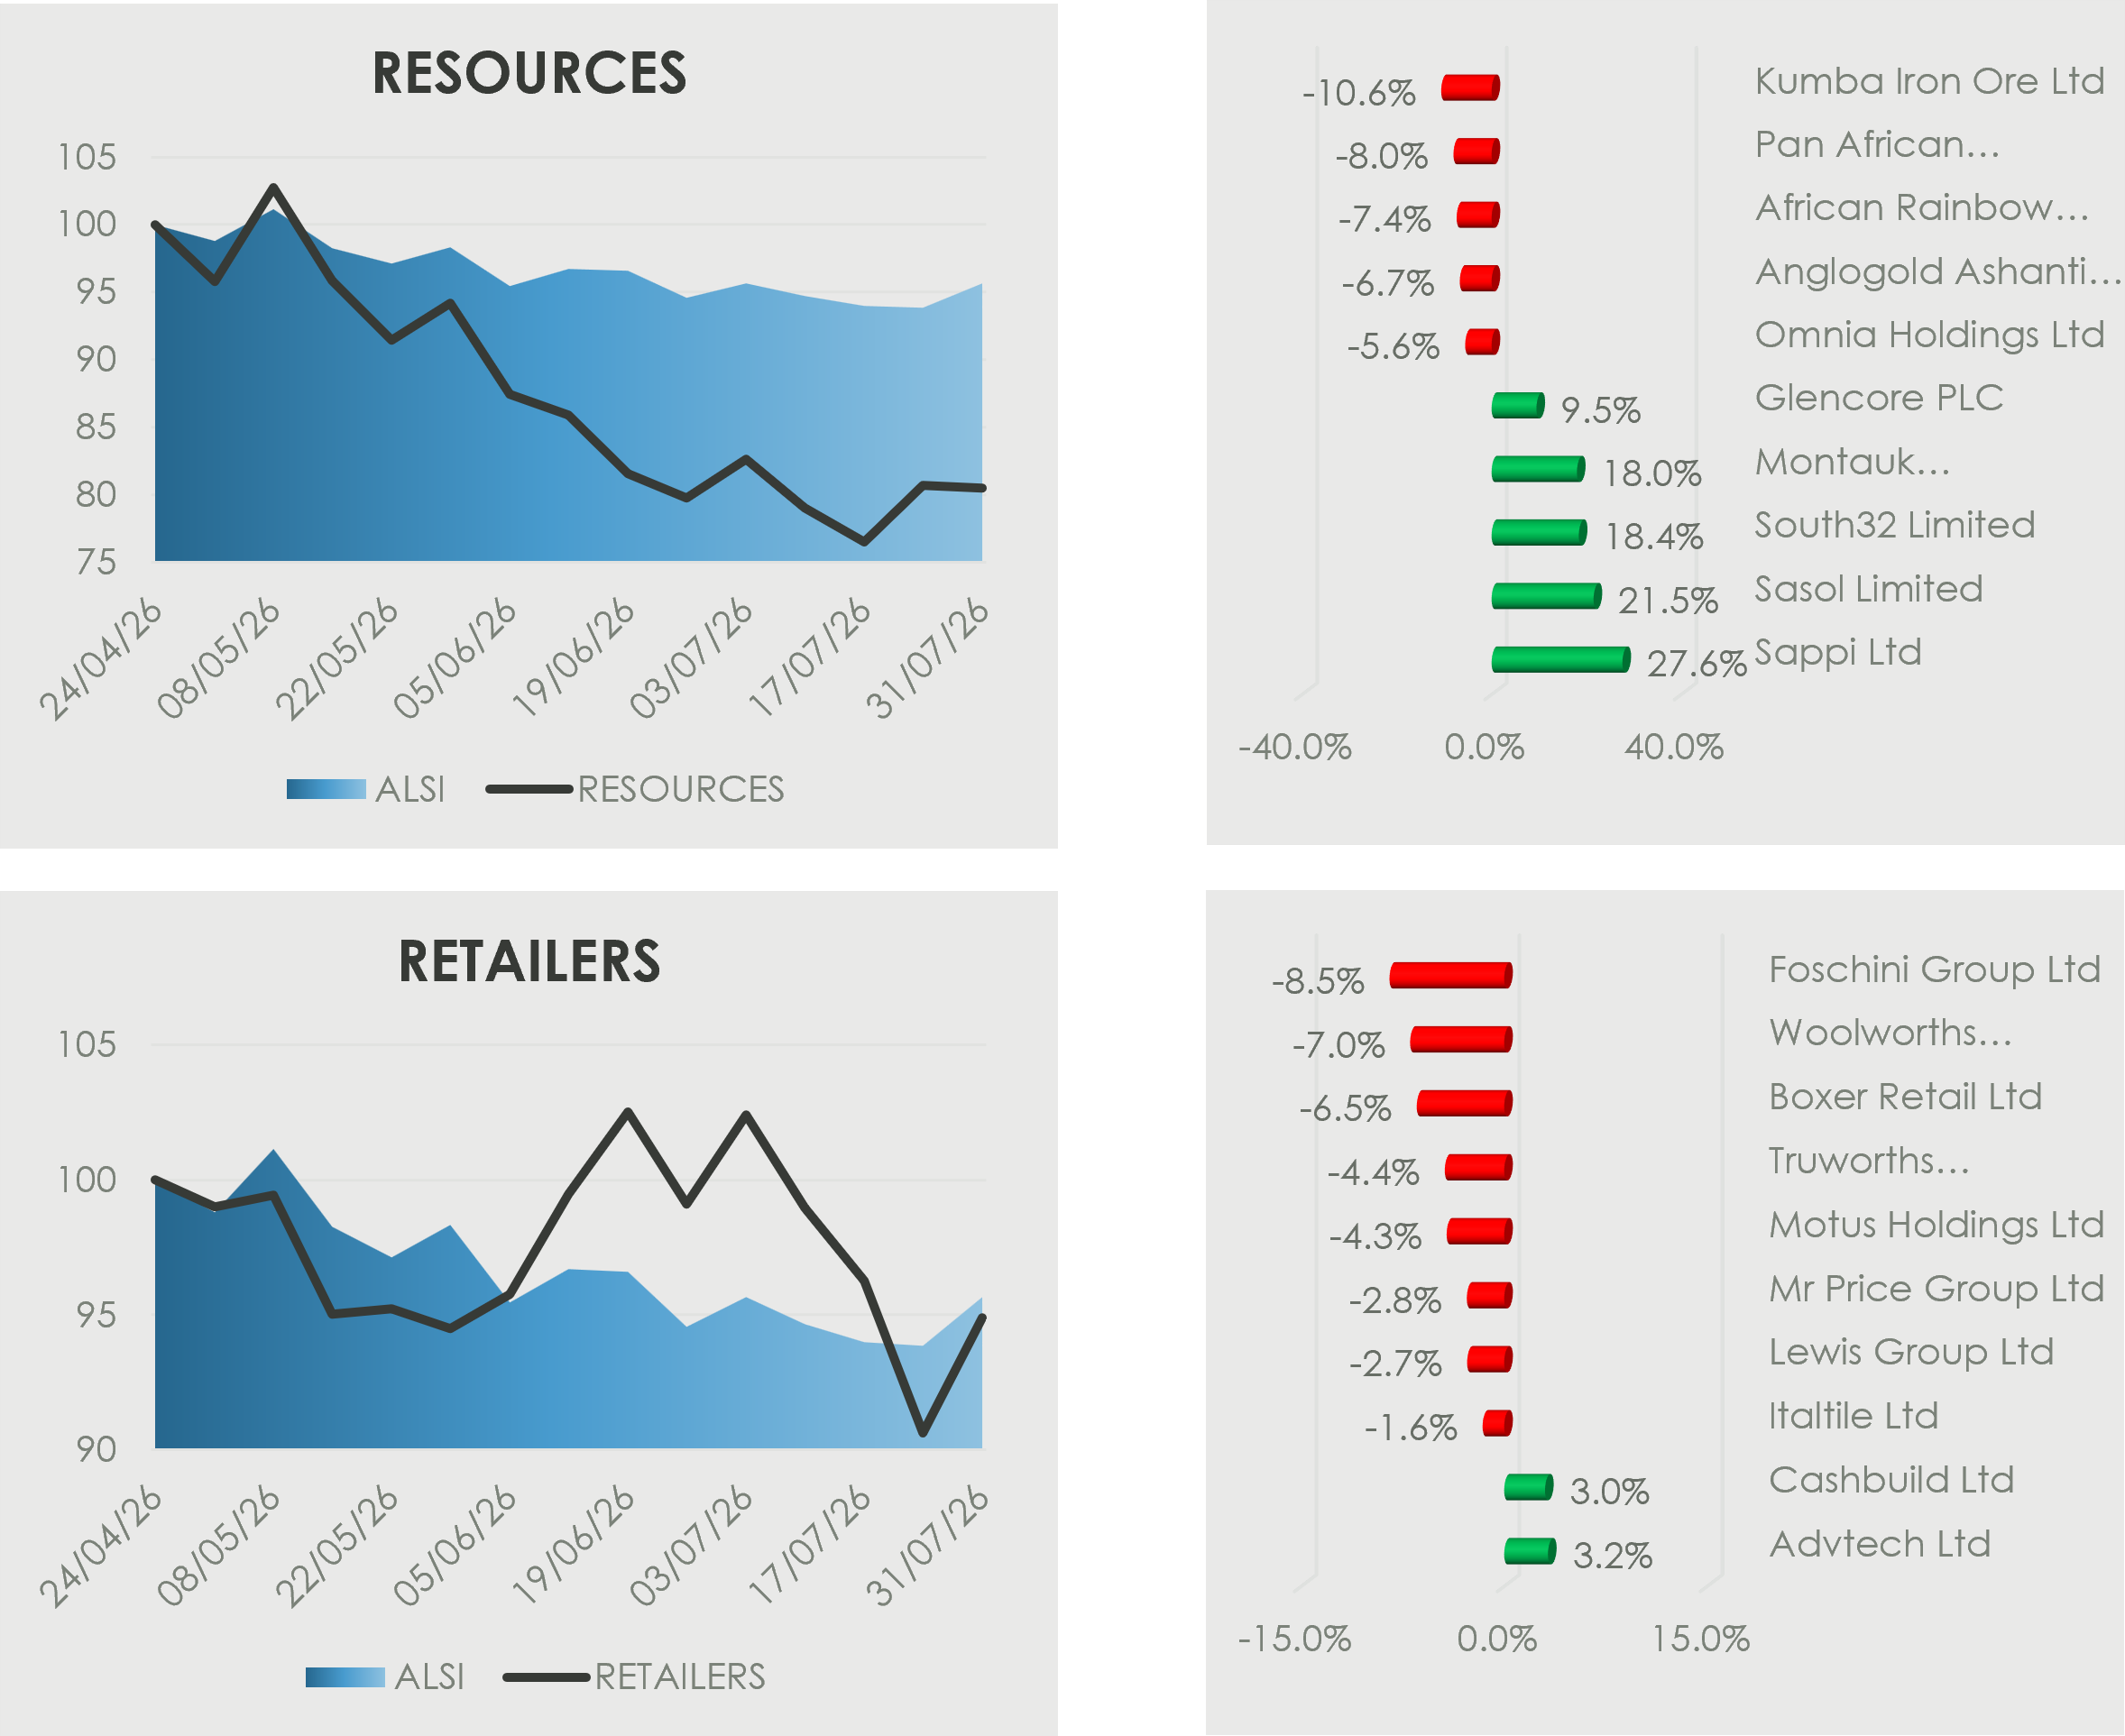
The JSE ALSI returned to positive territory in July, gaining 1.1% after two consecutive monthly declines. Resources led with a 2.2% gain, followed by listed property (+1.9%), financials (+1.2%) and industrials (+0.3%), while retailers remained under pressure. The South African Reserve Bank’s decision to leave the repo rate unchanged surprised the market, despite inflation reaching a two-year high.
Resources benefited from higher energy prices and strength in diversified miners. Sappi (+27.6%), Sasol (+21.5%), South32 (+18.4%), Montauk Renewables (+18.0%) and Glencore (+9.5%) advanced, with Montauk supported by better-than-expected first-quarter revenue. Sasol tracked a 24% rise in Brent crude amid escalating US–Iran tensions, while Glencore, BHP and Anglo American gained 8.0%, 4.0% and 3.5%, respectively. Kumba Iron Ore (-10.6%), Pan African Resources (-8.0%), African Rainbow Minerals (-7.4%) and AngloGold Ashanti (-6.7%) declined.
Precious-metals shares diverged. Platinum miners gained approximately 7% as the platinum price rose 6%, while gold miners fell around 3% despite a 1% increase in bullion. Harmony (+0.8%) was the only gold counter to advance; Gold Fields (-2.5%), DRDGOLD (-4.7%), AngloGold Ashanti (-6.7%) and Pan African Resources (-8.0%) retreated.
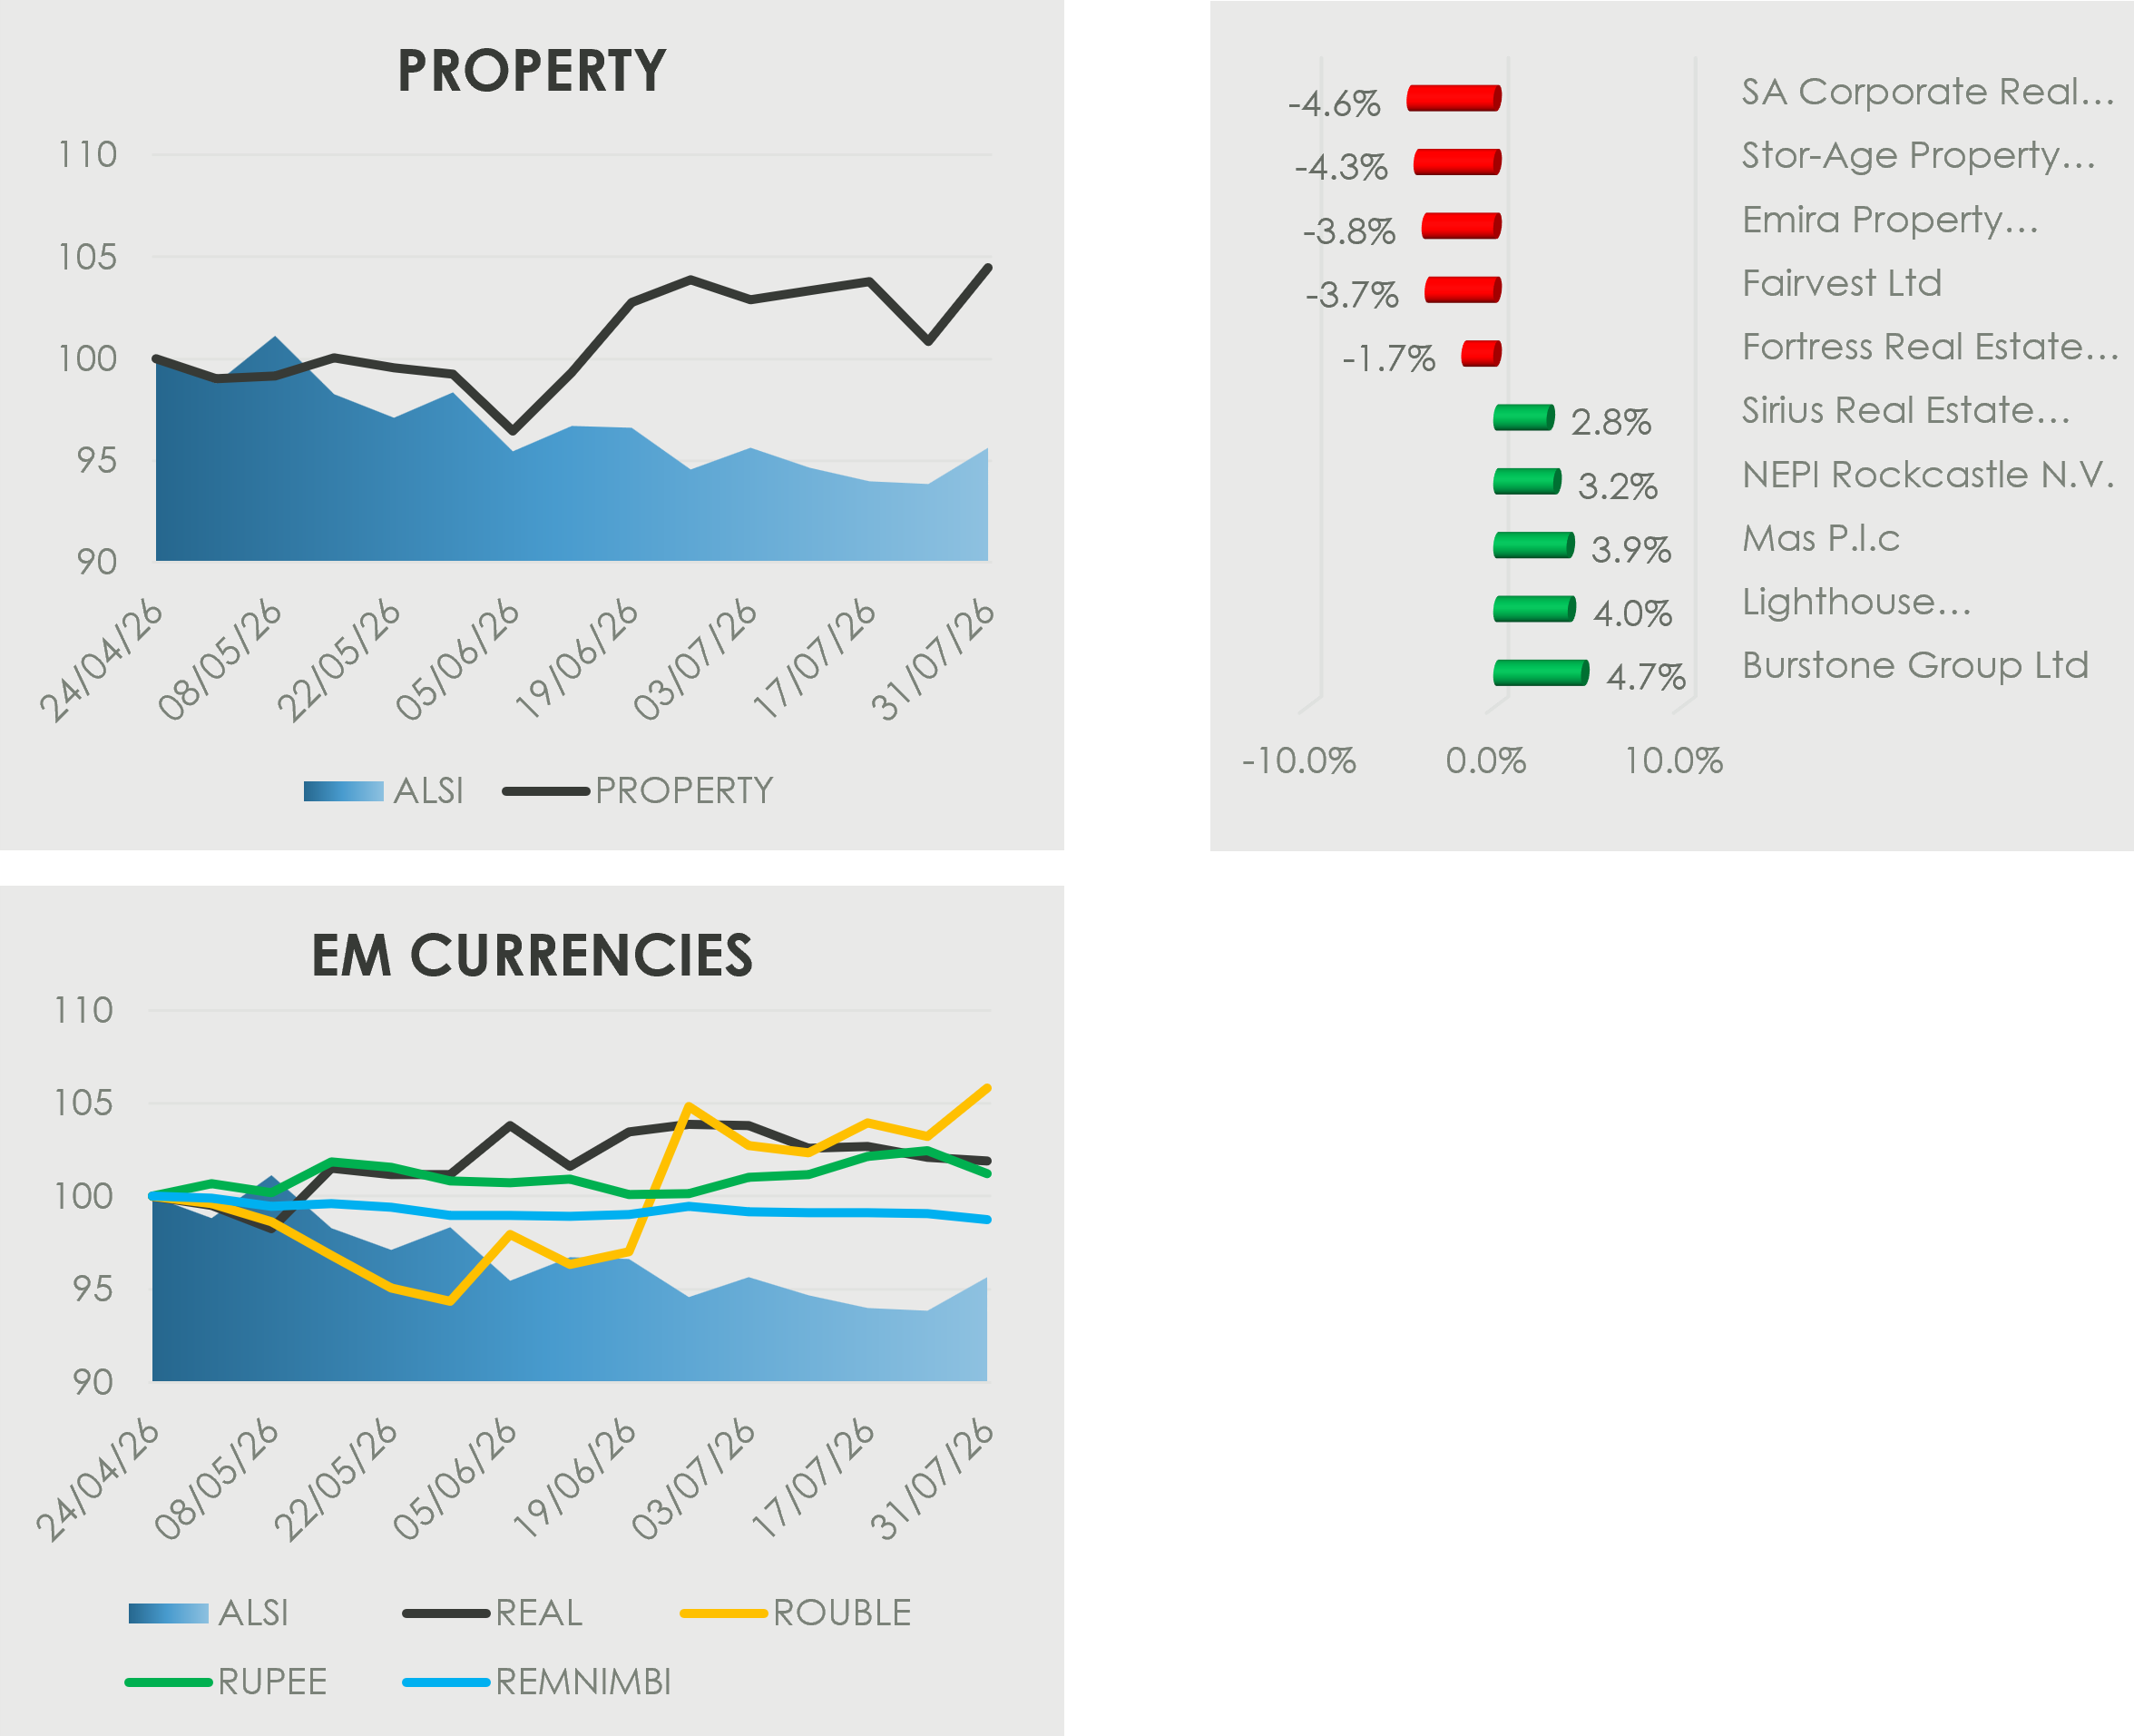
Listed property posted a mixed performance. Burstone (+4.7%), Lighthouse (+4.0%), MAS (+3.9%), NEPI Rockcastle (+3.2%) and Sirius Real Estate (+2.8%) advanced, while SA Corporate (-4.6%), Stor-Age (-4.3%), Emira (-3.8%) and Fairvest (-3.7%) declined. Higher bond yields following the South African Reserve Bank’s decision to hold rates unchanged limited broader sector gains.
Financials were mixed. Brait (+19.1%), Investec PLC (+10.4%), Investec Ltd (+10.3%), PSG Financial Services (+8.9%) and OUTsurance (+8.4%) led the gains. Absa (-5.9%), Discovery (-6.7%) and Nutun (-8.7%) declined, with Nutun remaining under pressure amid ongoing recovery challenges. The unchanged repo rate provided some support to domestic sentiment, although elevated inflation and the risk of future rate increases remained headwinds.
Industrials recorded several notable gains. Karooooo (+30.9%) rallied on strong first-quarter results, while Mondi (+30.7%) benefited from a positive first-half trading update highlighting improved momentum. Blue Label (+13.8%), Bytes Technology (+9.4%) and Oceana (+9.4%) also advanced. Prosus (+8.0%) and Naspers (+6.0%) were supported by an 11% rebound in Tencent as Chinese equities responded to state-backed support and further monetary easing. MTN (-9.3%) declined on signs of slower momentum in Nigeria and ongoing litigation in Ghana, while AVI (-9.8%), Dis-Chem (-10.3%), Datatec (-11.6%) and Raubex (-13.8%) also ended lower.
Retailers remained under pressure amid continued caution towards consumer-facing shares. ADvTECH (+3.2%) and Cashbuild (+3.0%) were the only notable gainers, while Woolworths (-7.0%), Boxer (-6.5%) and Foschini (-8.5%) were among the weakest performers.
As we enter the final quarter of the year, the conflict involving Iran continues to weigh on markets. Volatile news flow from the region has kept investors cautious and prevented South African risk assets from finding a firm footing.
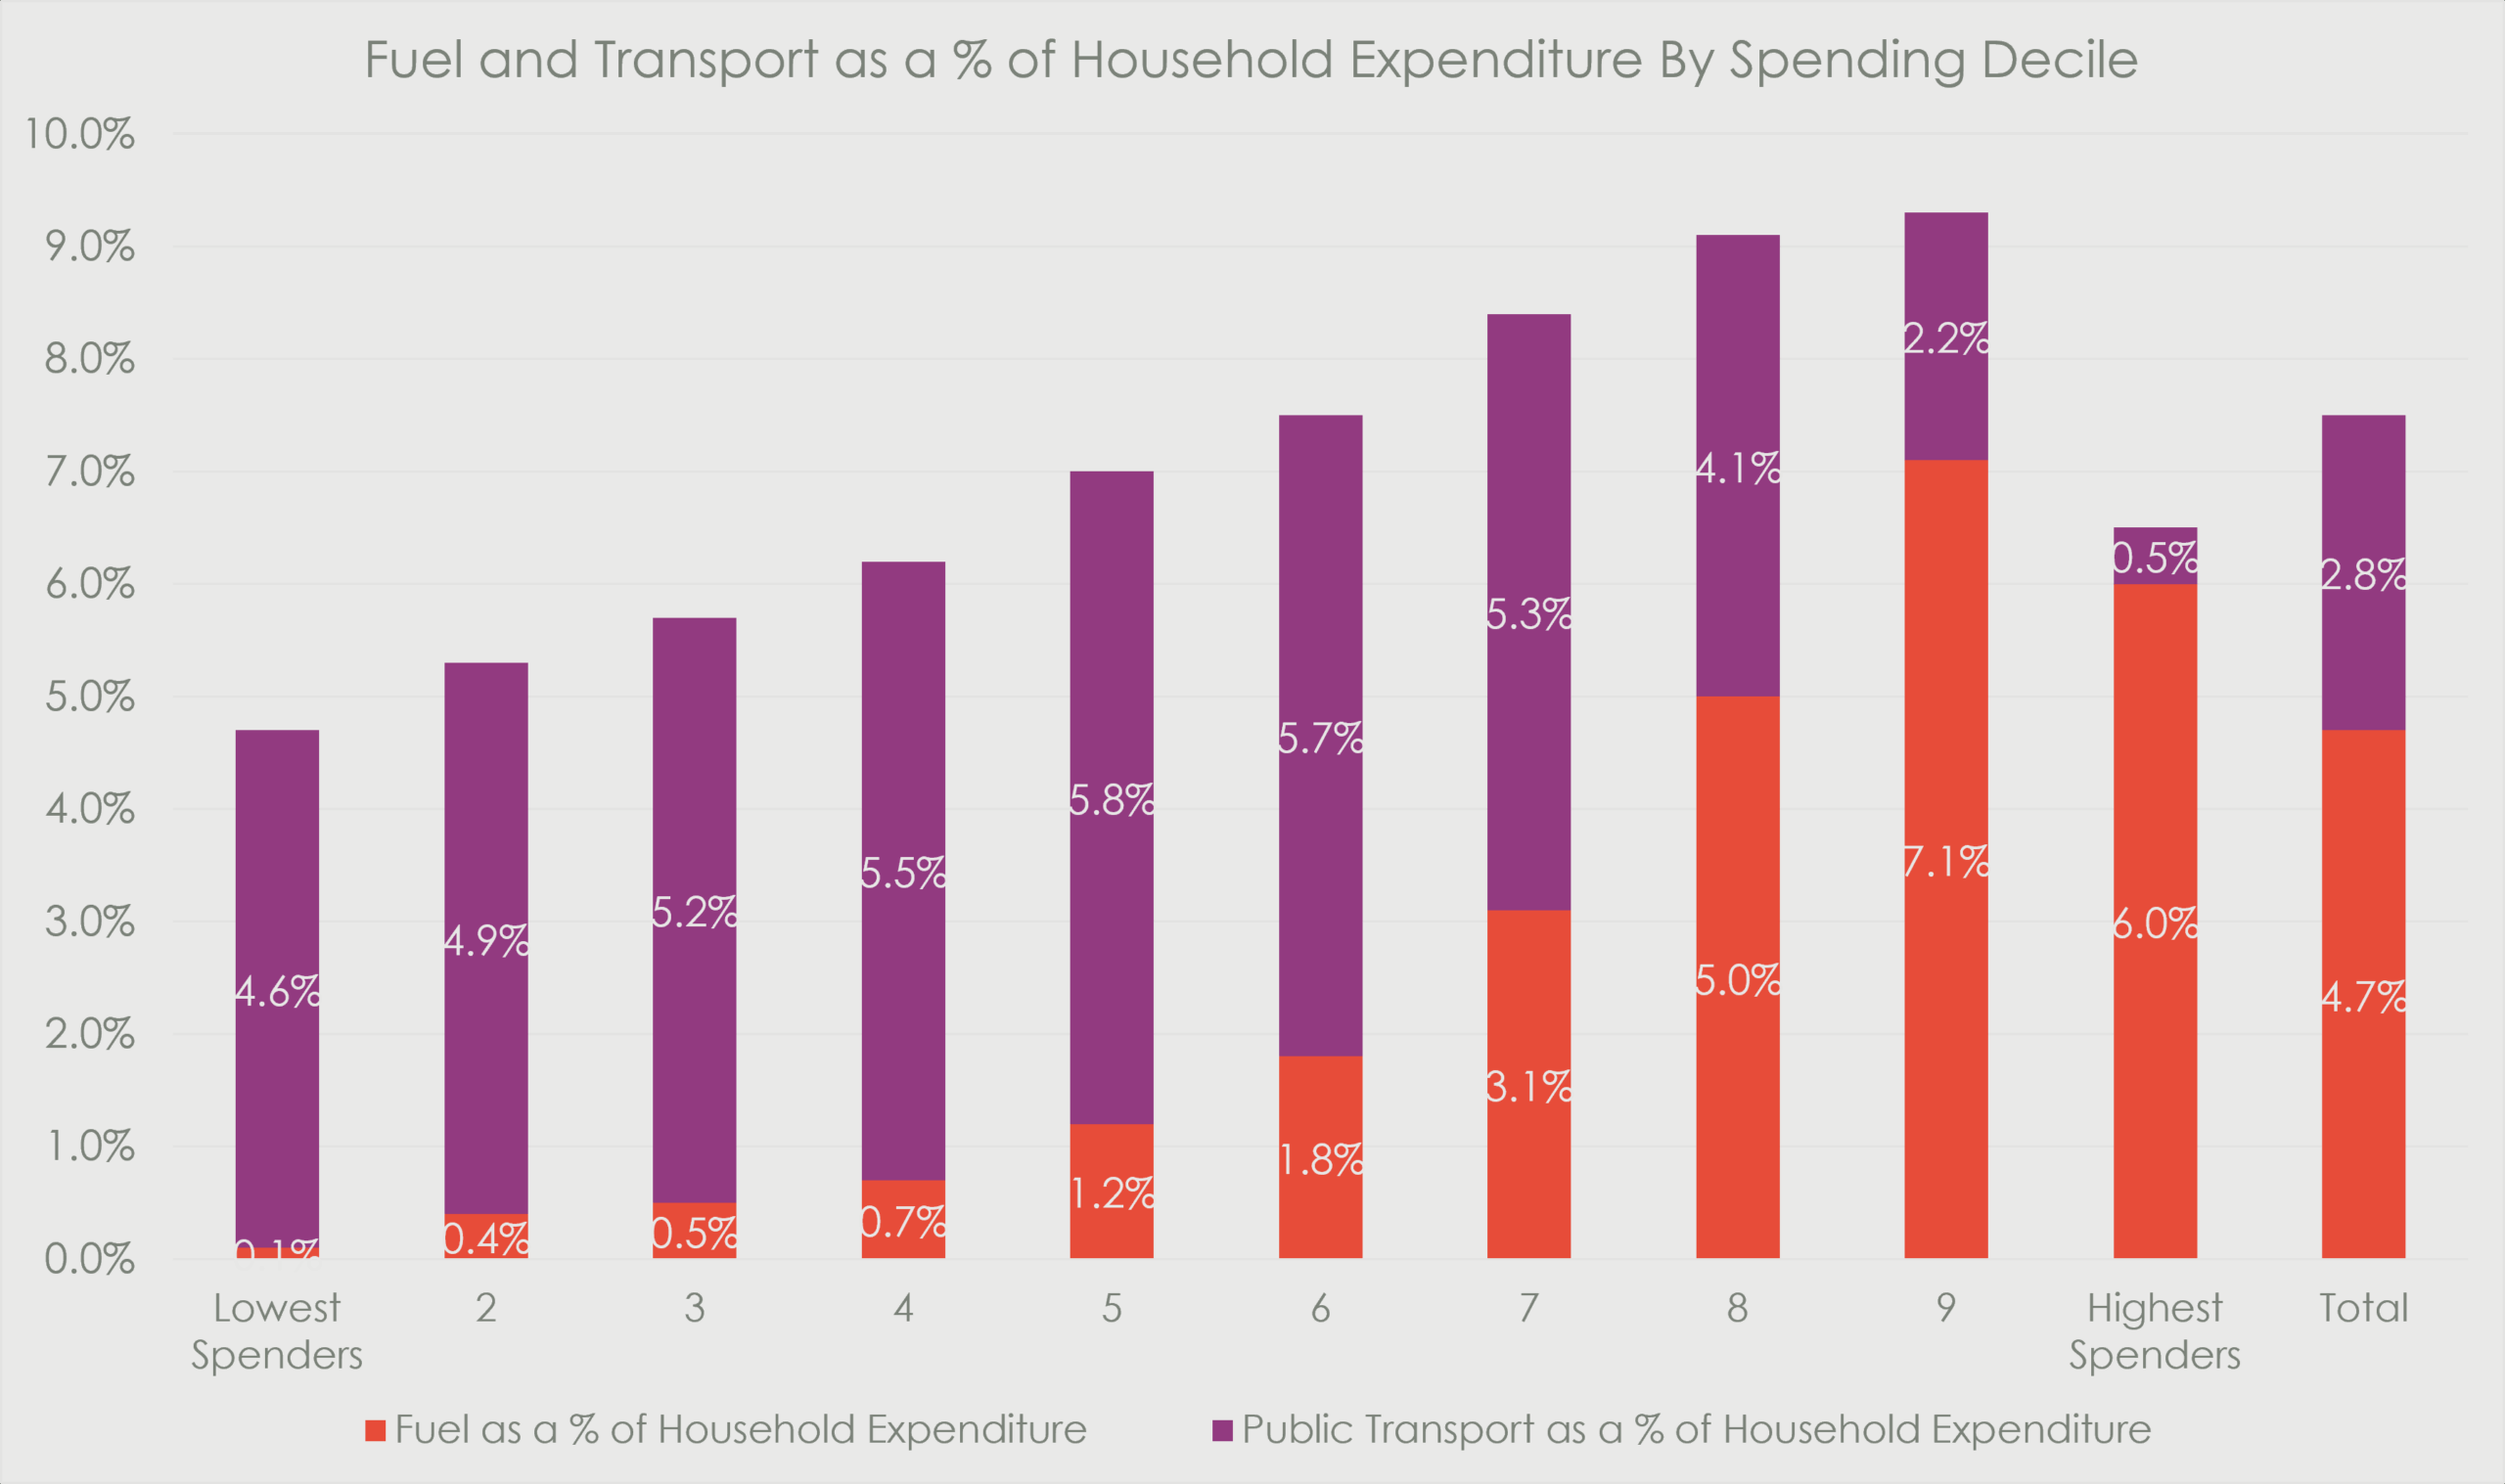
The main areas of consumer pressure are interest rates, which have recently been increased, and fuel costs, which remain elevated. These areas impact higher income consumers more than those at the lower end of the spectrum. Public transport inflation remains anchored while food inflation remains subdued. The latter two categories constitute a larger proportion of wallet among lower income consumers, who therefore remain relatively insulated.
Confidence indicators have deteriorated, along with unemployment, which is now at the highest level in four years. Yet economic activity remains resilient, with selective pockets of strength across sectors.
Against this backdrop, South Africa’s self-help narrative continues to gain momentum. Following an outlook upgrade from Moody’s in June, Fitch subsequently upgraded South Africa’s sovereign credit rating. The fiscal consolidation trajectory continues to show promise, with bond issuance reduced and tax collection significantly ahead of budget.
Investec Consumer Finance Conference 2026: Cape Town
We recently had opportunity to attend the Investec Consumer Finance Conference in Cape Town. The main focus of this year’s conference was the health of the consumer, with additional attention on the growing influence of Fintech within the South African economy. The net takeaway was that consumers remain resilient, lending books stable, and the informal sector continues to offer untapped growth potential.
A key insight was that lending books have become higher quality and more concentrated. As a consequence of this, aggregate credit quality has improved, with indebtedness gradually slowing. For the average consumer, this means more disposable income and less access to credit.
Into this growing under-serviced sector, we are seeing the likes of Pepkor, Weaver Fintech and Lesaka find interesting propositions to both assess and service what are referred to as “thin file” debtors. We heard from the respective CEOs how Weaver is using buy-now-pay-later, and Lesaka the SASSA grants ecosystem, to build a multi-faceted financial services infrastructure into what is a mass market of under-estimated scale and growth. Credit quality in this sector is surprisingly robust, with default rates in the low single digits.
Official data masks a vibrant informal sector that is finding creative ways to earn and spend money. The ecosystem being built to service this sector contains valuable insights and points to untapped growth potential for the South African economy.
Banks Earnings Upbeat
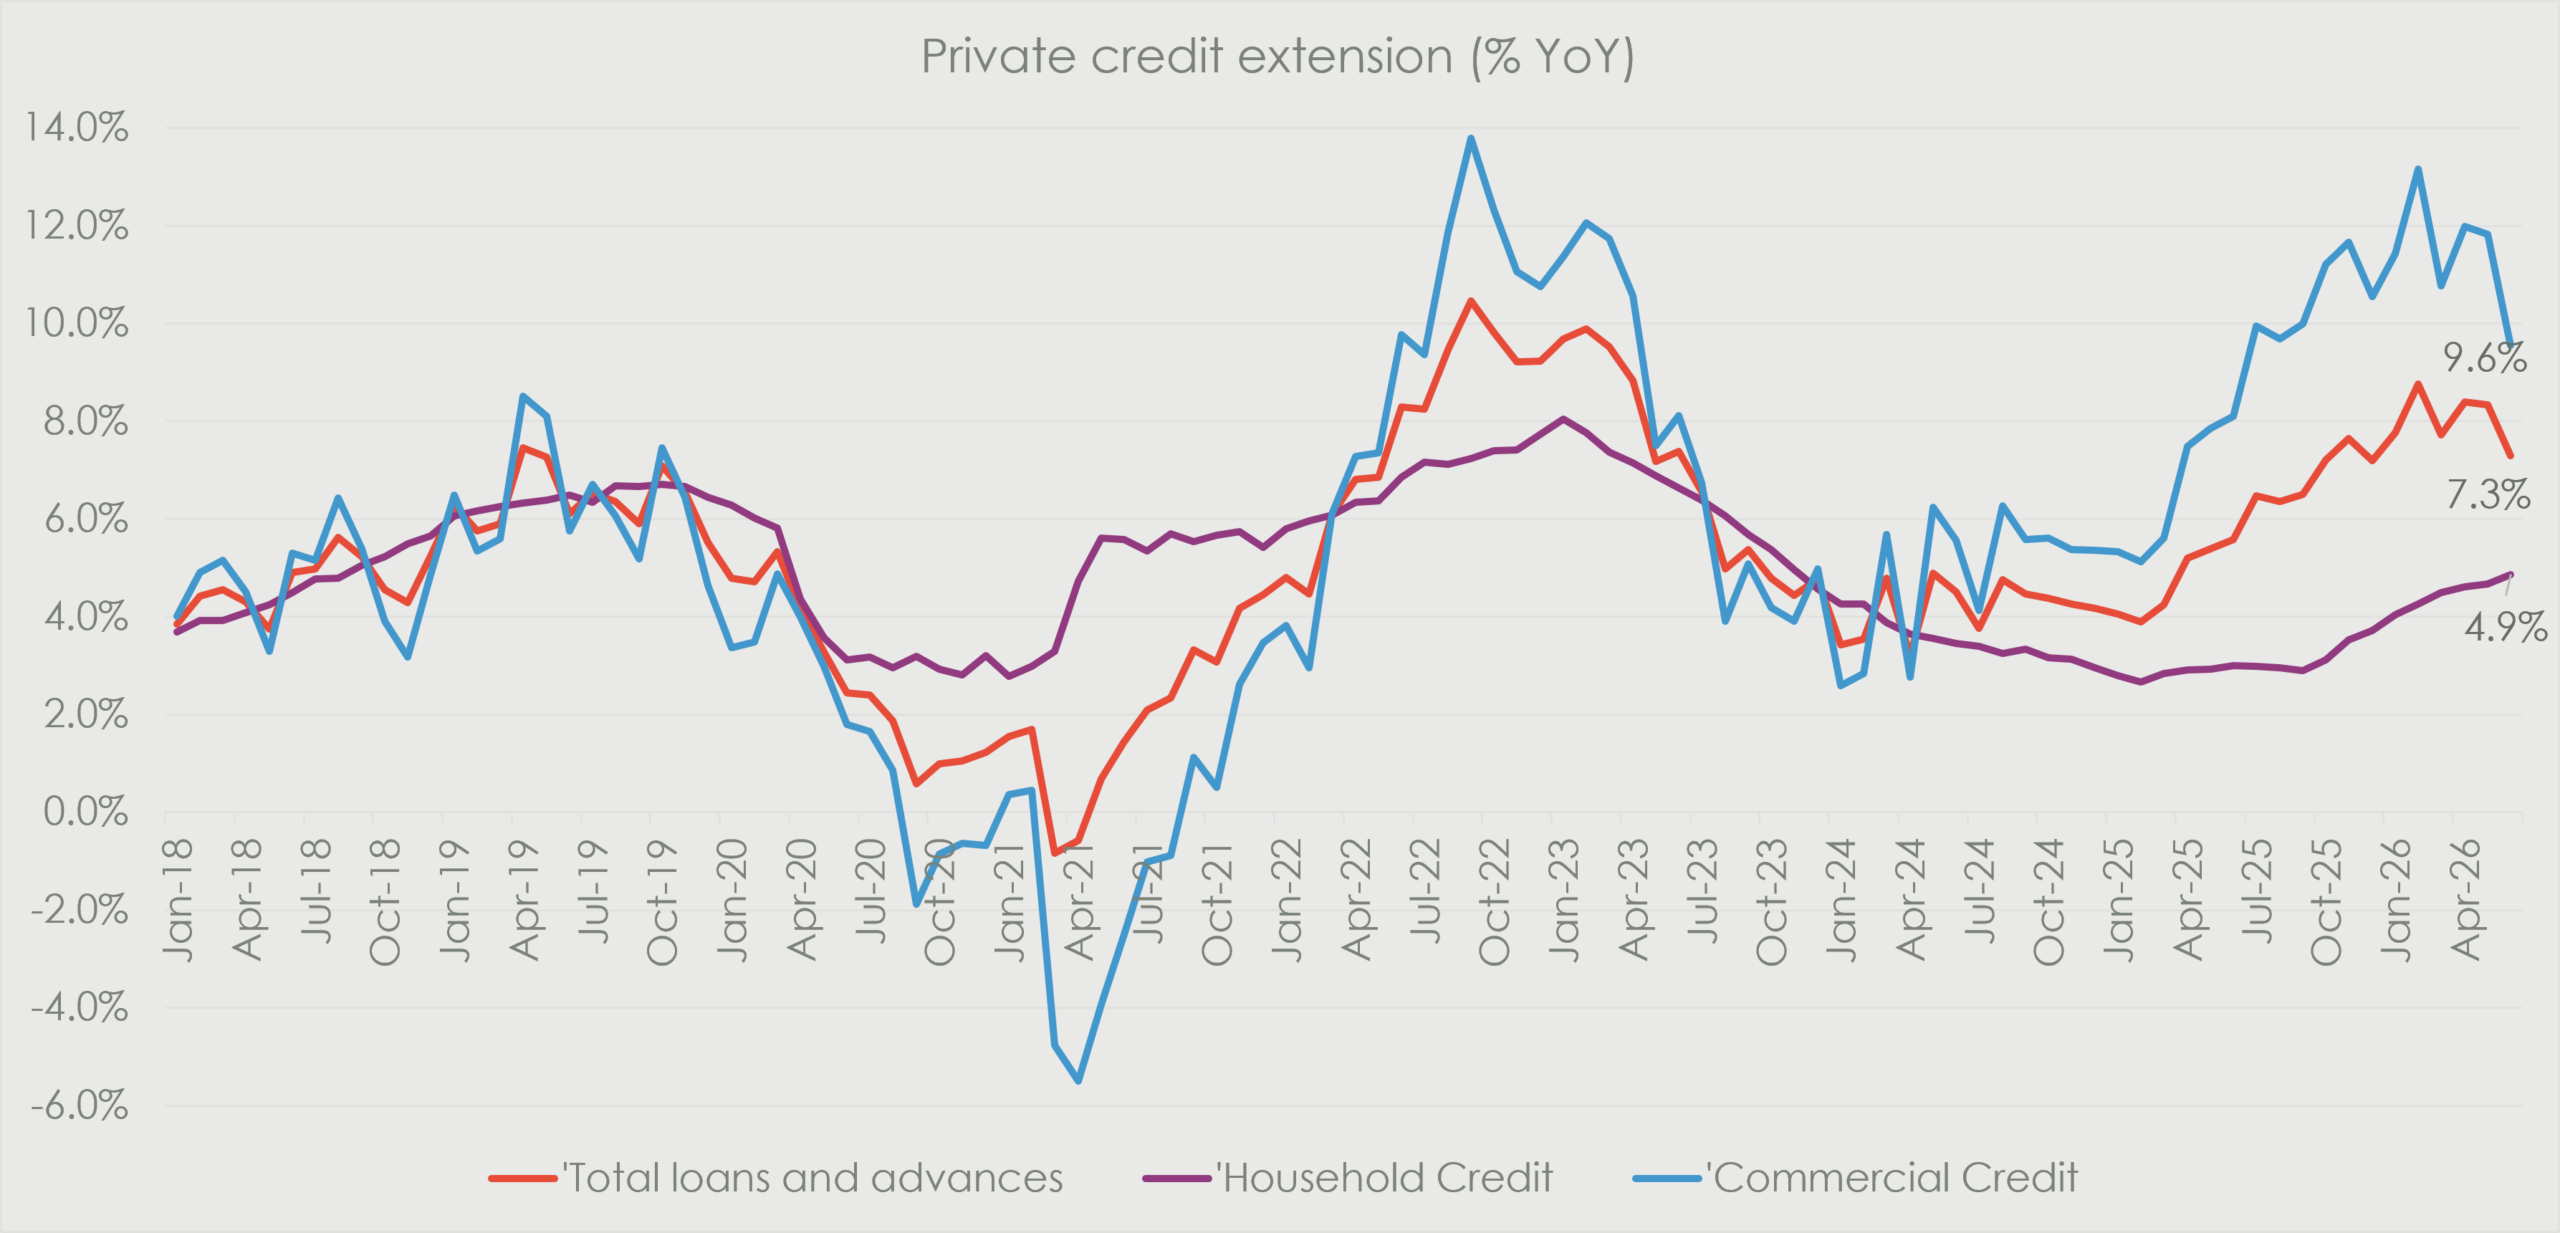
Nedbank and Standard Bank both reported encouraging sets of numbers recently. Nedbank is actively pursuing market share gains in loan granting, which served to boost net revenue and earnings beyond market expectations. Standard Bank reported stronger than anticipated credit quality, which together with cost control allowed them to maintain earnings momentum toward year end. Looking ahead, we expect topline growth to recede across the sector, driven by moderating credit extension.
Retailers Confirm Resilient Consumer Picture
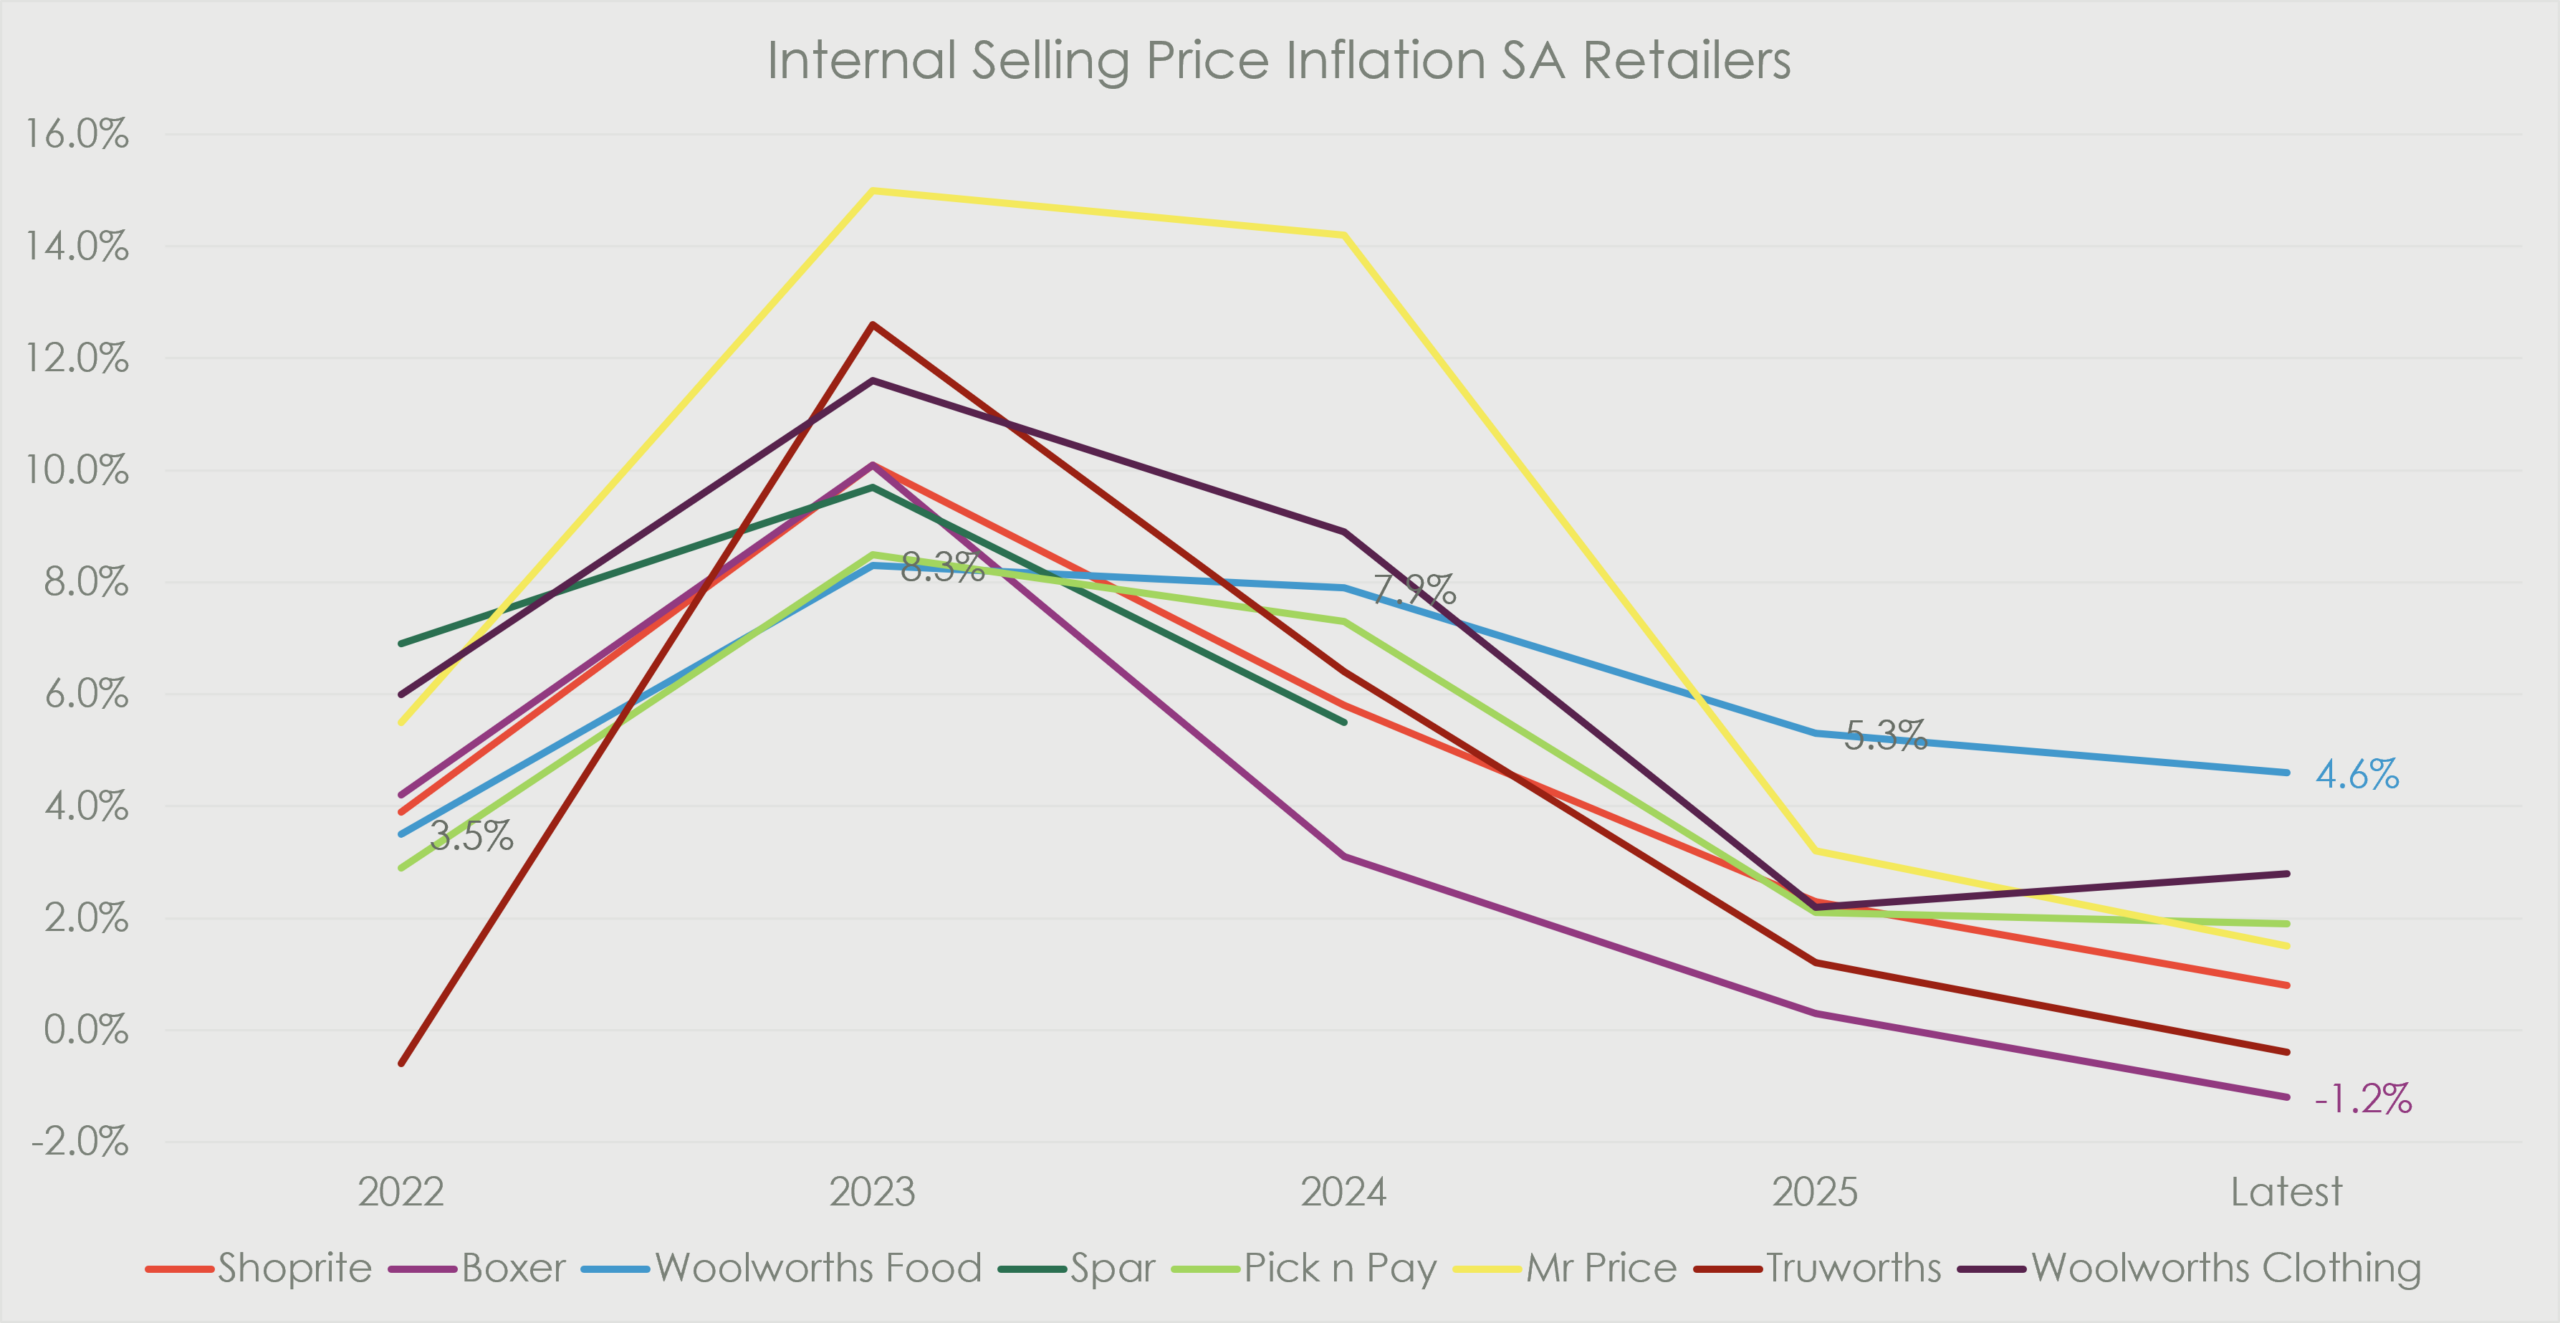
Various headwinds have compromised the retailer’s ability to use price as a lever for earnings growth. Consequently, the reporting revealed slowing revenue growth across the sector, against an unusually strong base. Key themes included consumers trading down for value and prioritizing essential goods over discretionary purchases. Shoprite and Boxer displayed their respective competitive advantages, managing to hold margin.
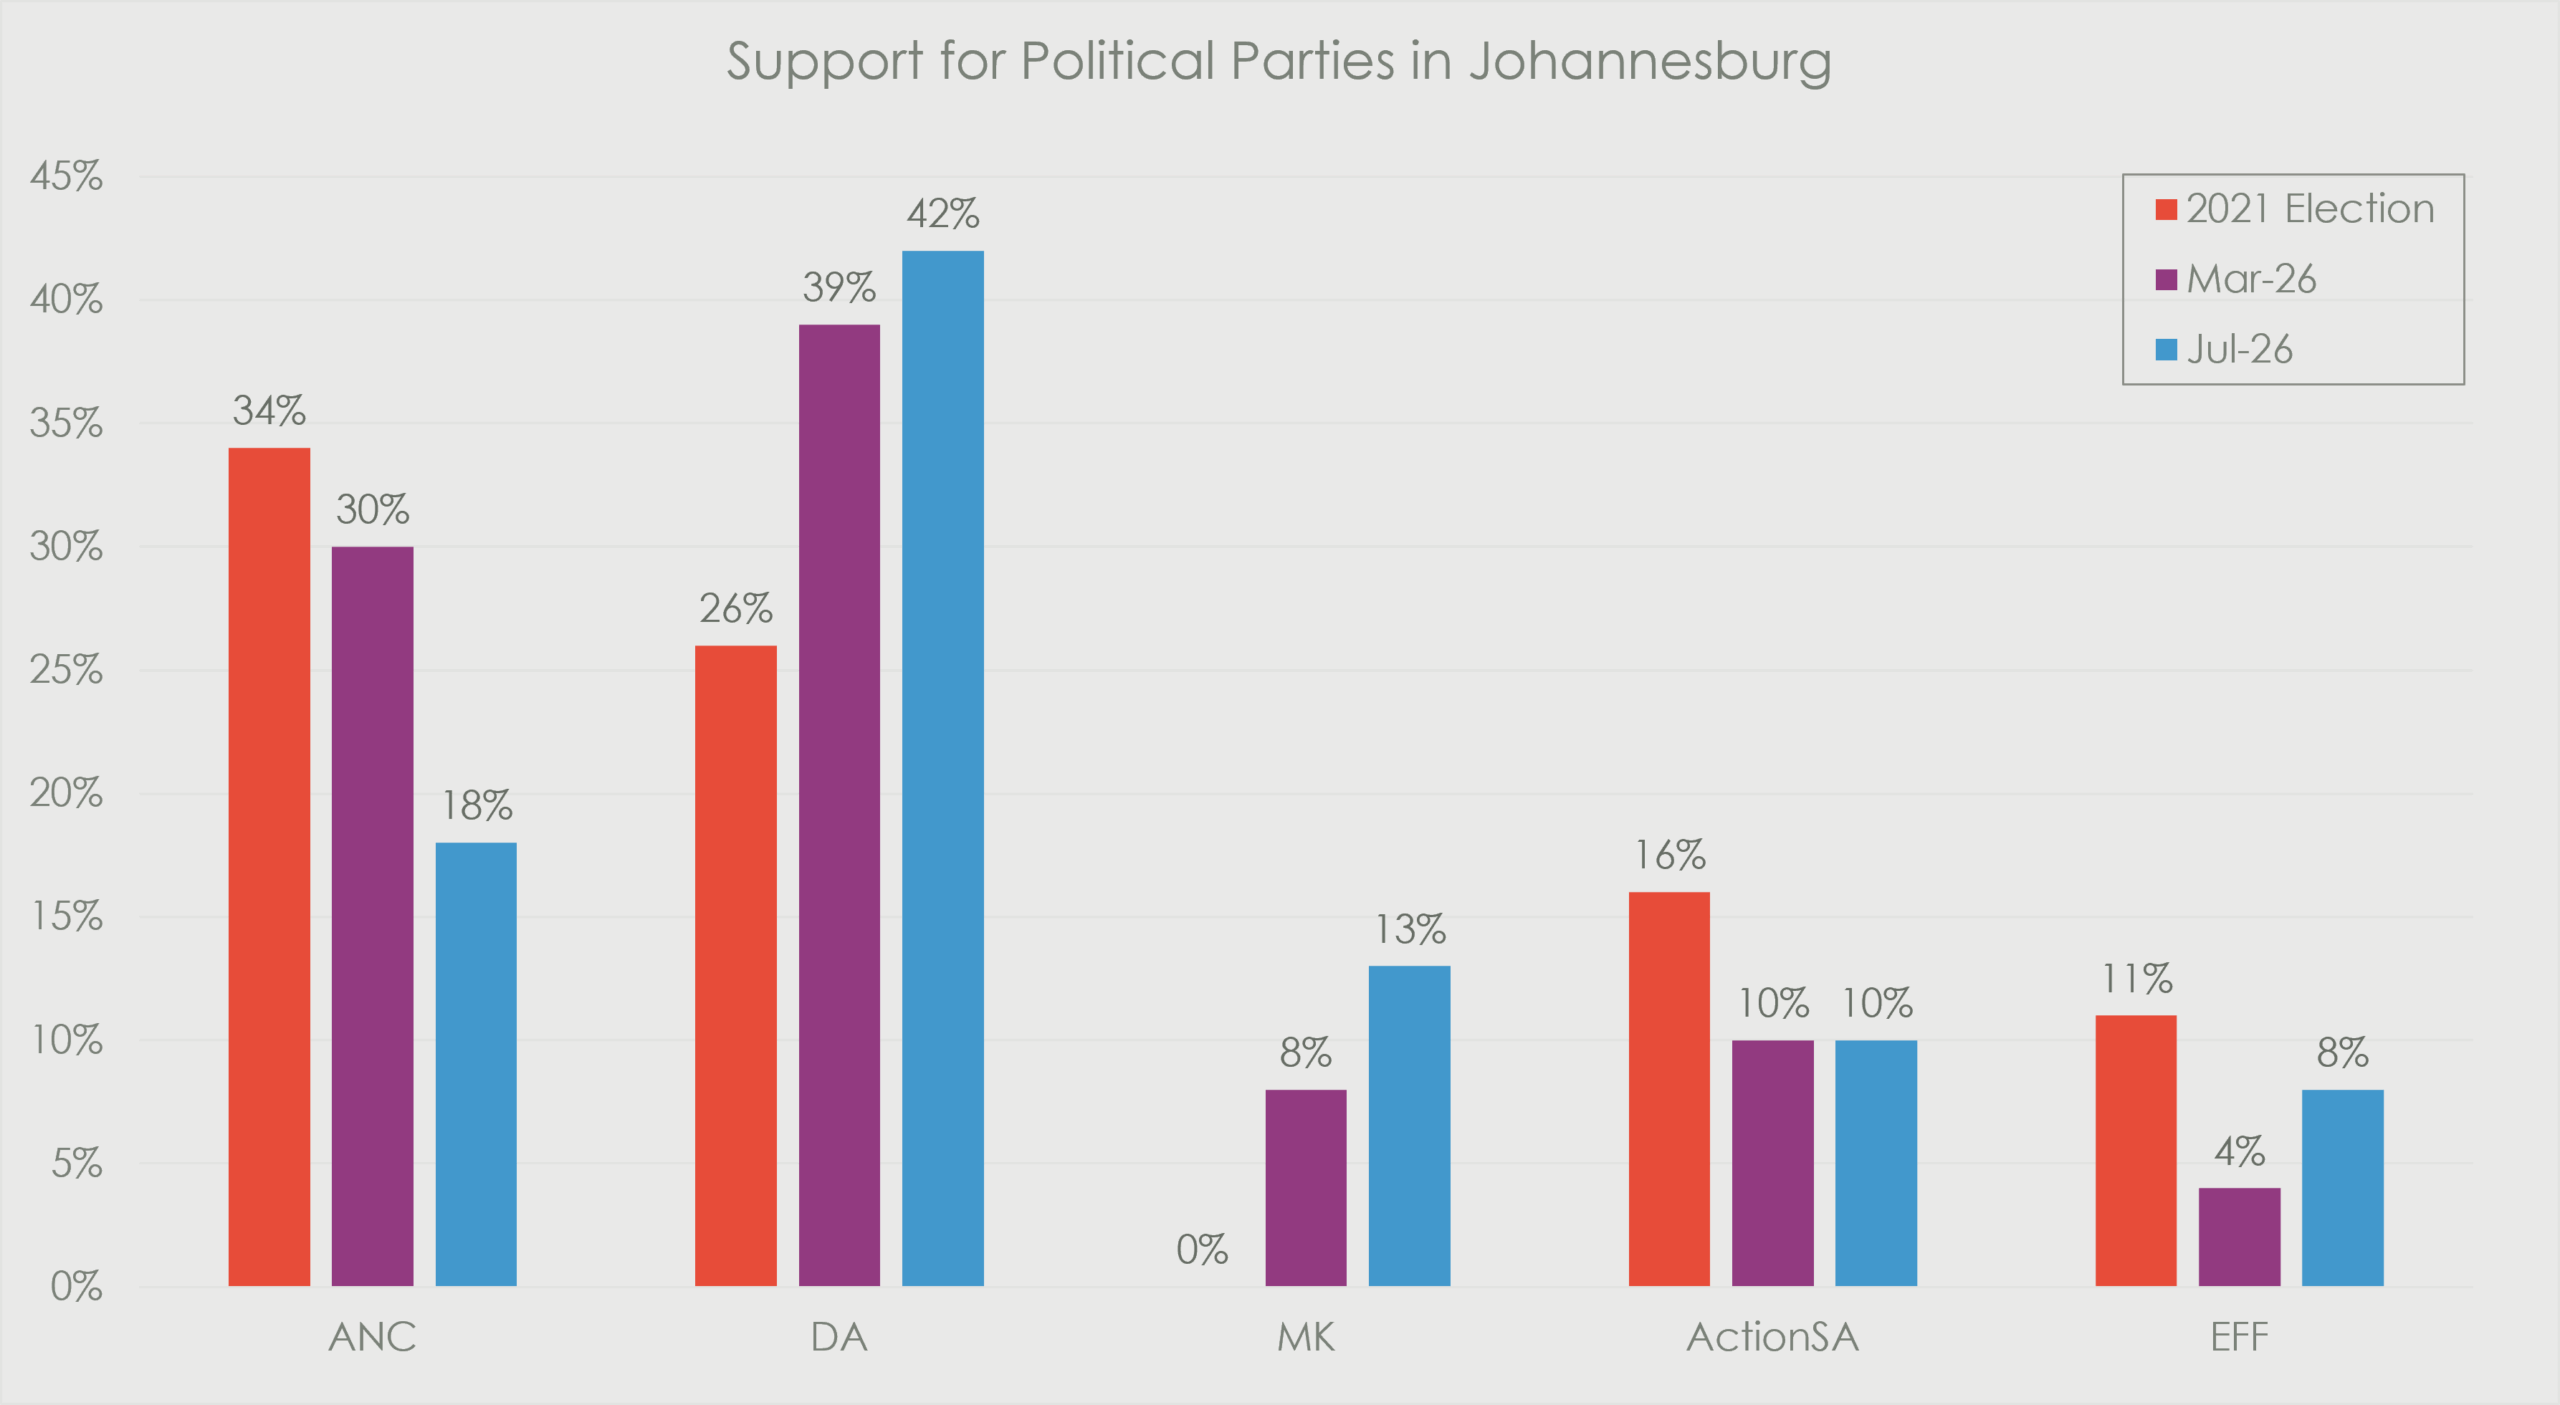
Latest Polling Indicating DA Momentum Gathering
The 2026 Local Government Elections, taking place on 4 November, will be a watershed moment for the economy and investor sentiment. Polling suggests that the DA is poised for a strong showing in key metros, which would be positive for South African assets, in our view. In Johannesburg, the ANC has yet to announce a mayoral candidate, while the Zille campaign continues to gain traction, as illustrated by the data below.
Positioning And Near-Term Catalysts
A sustained improvement in flows and share-price performance will require evidence that earnings expectations have bottomed. For now, JSE-listed equities remain under-owned by both domestic and offshore investors. Local institutions maintain foreign exposure of around 40%, while net foreign selling has resumed since the start of the Iran war. This creates opportunities to generate alpha from stock picking.
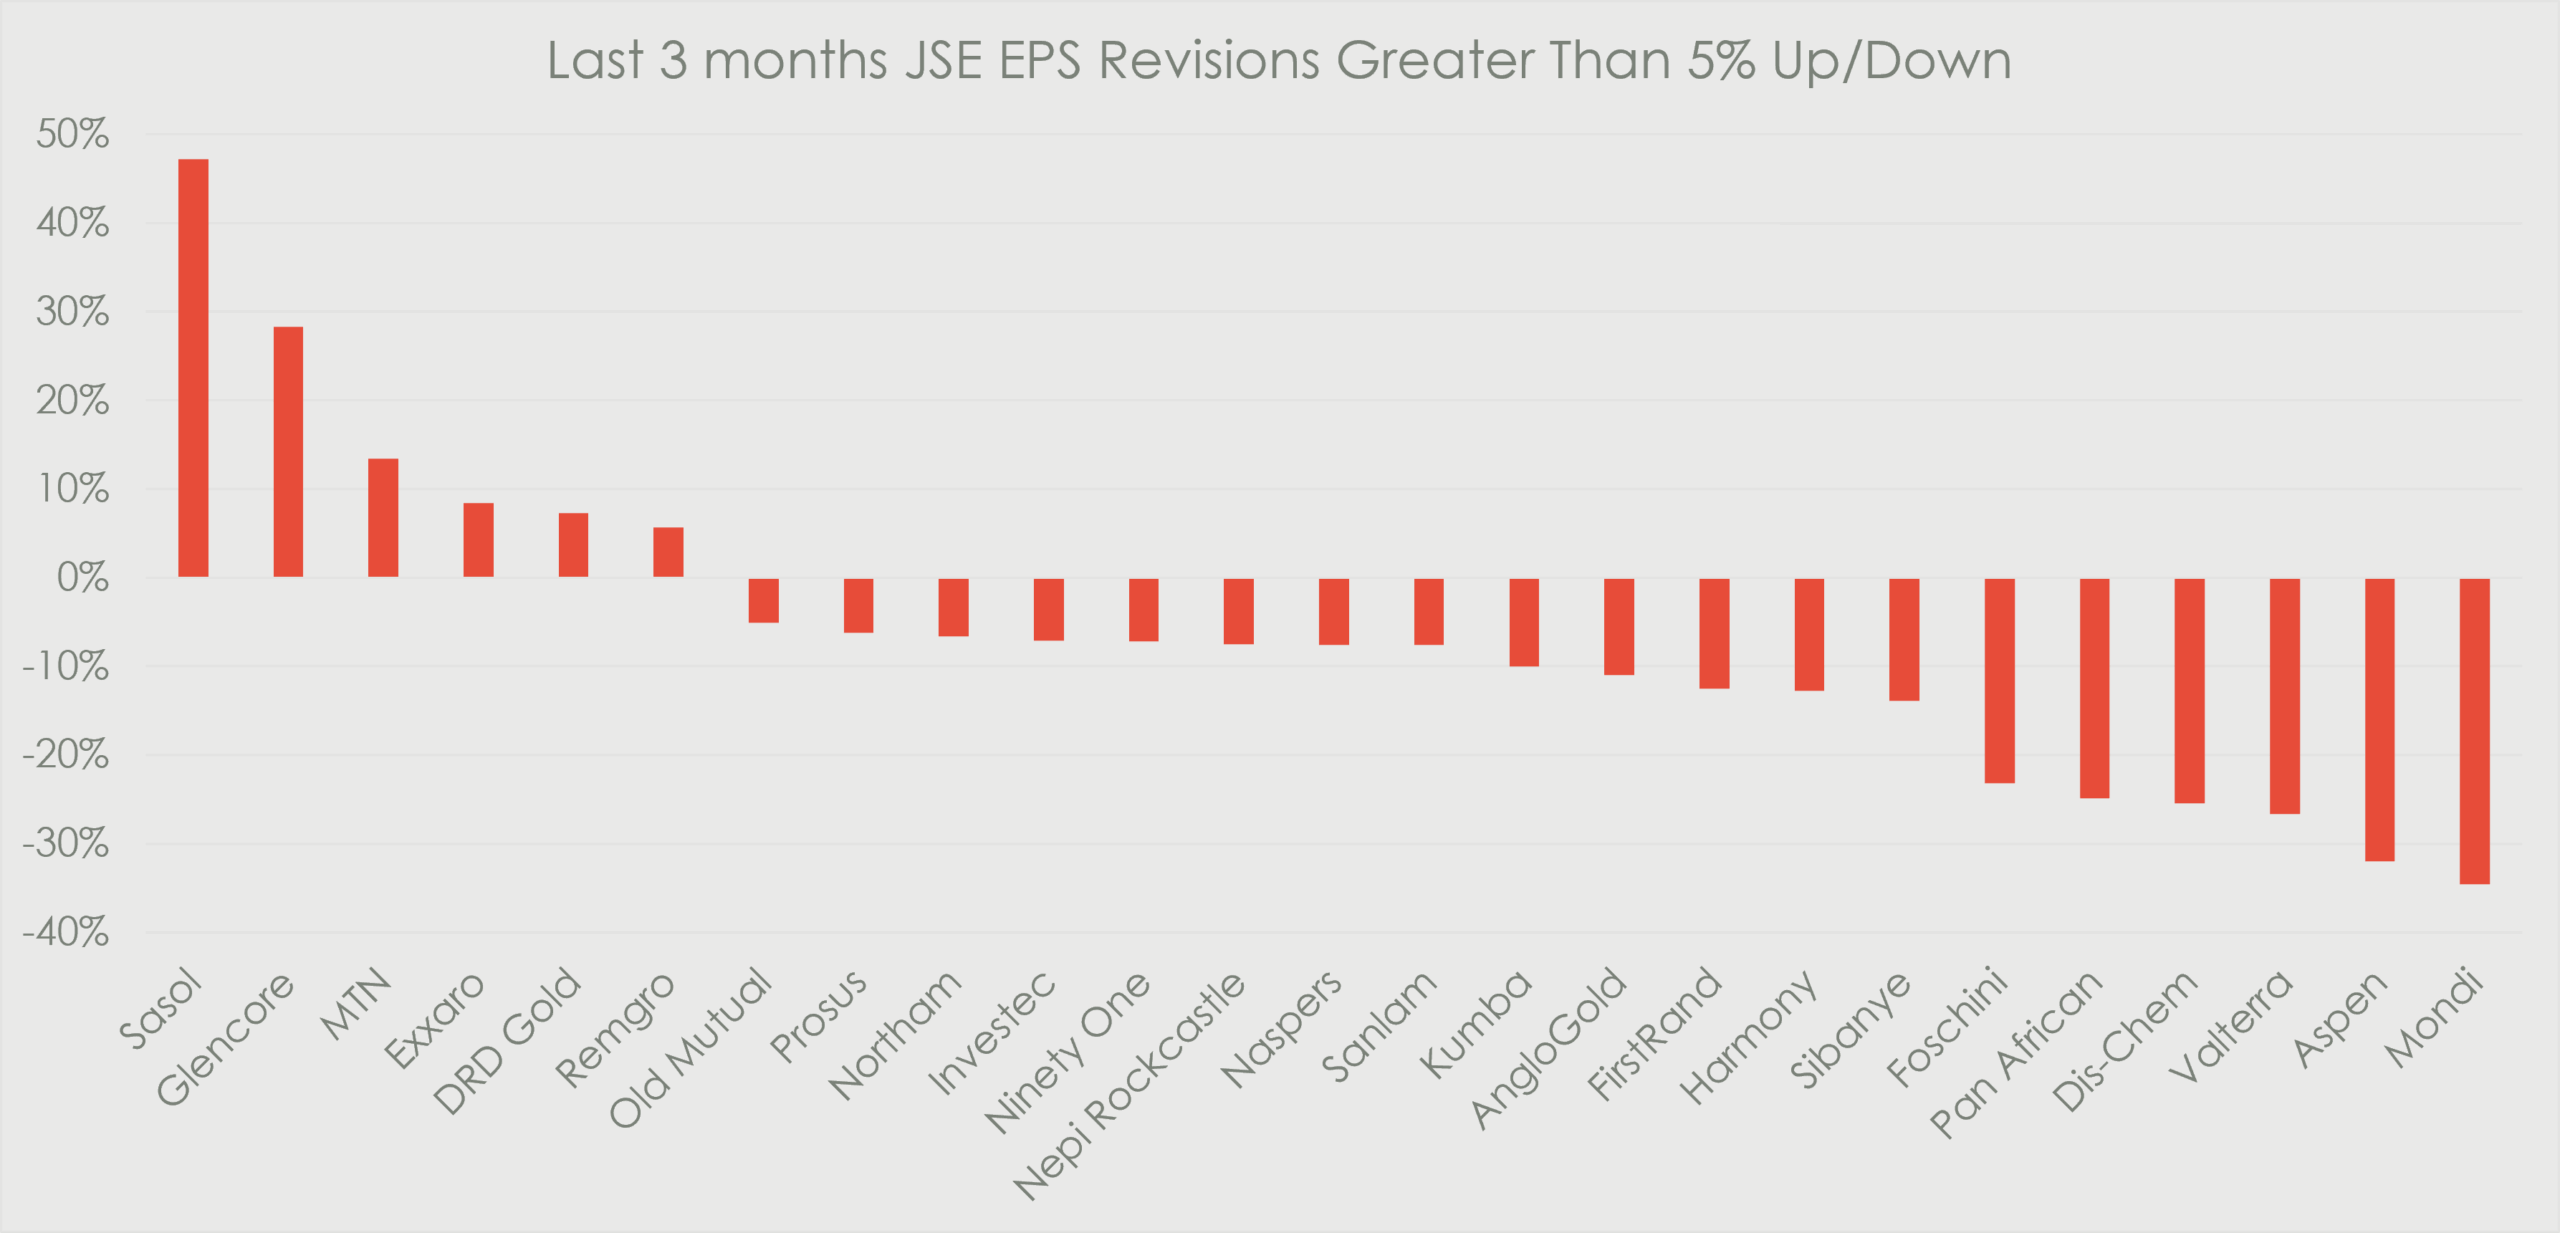
Our rotation from cyclicals into high-quality defensive companies has added value so far this year. The trio of consumer rand hedge names – AB InBev, British American Tobacco and Richemont – have produced credible results, resulting in earnings upgrades that should underpin future performance. We also see an opportunity to broaden our exposure to diversified miners, given the emergence of significant demand tailwinds across global base metals, particularly driven by the global AI infrastructure build up. To this end, we have added Glencore to our equity mandates, with a view to capitalising on volatility in global commodity markets while gaining access to a growing copper production profile at an attractive valuation.
Conclusion
Global geopolitical volatility continues to cloud the earnings outlook for South African equities. The resulting deterioration in sentiment has decelerated investment and spending trends across the economy. Beneath the surface, however, supply-side reforms and fiscal consolidation continue to gain traction, strengthening the long-term investment case for South African assets and creating the potential for outperformance as uncertainty recedes. We therefore continue to favour high-quality companies, with an emphasis on market-share gainers and businesses that are relatively insulated from the prevailing headwinds.