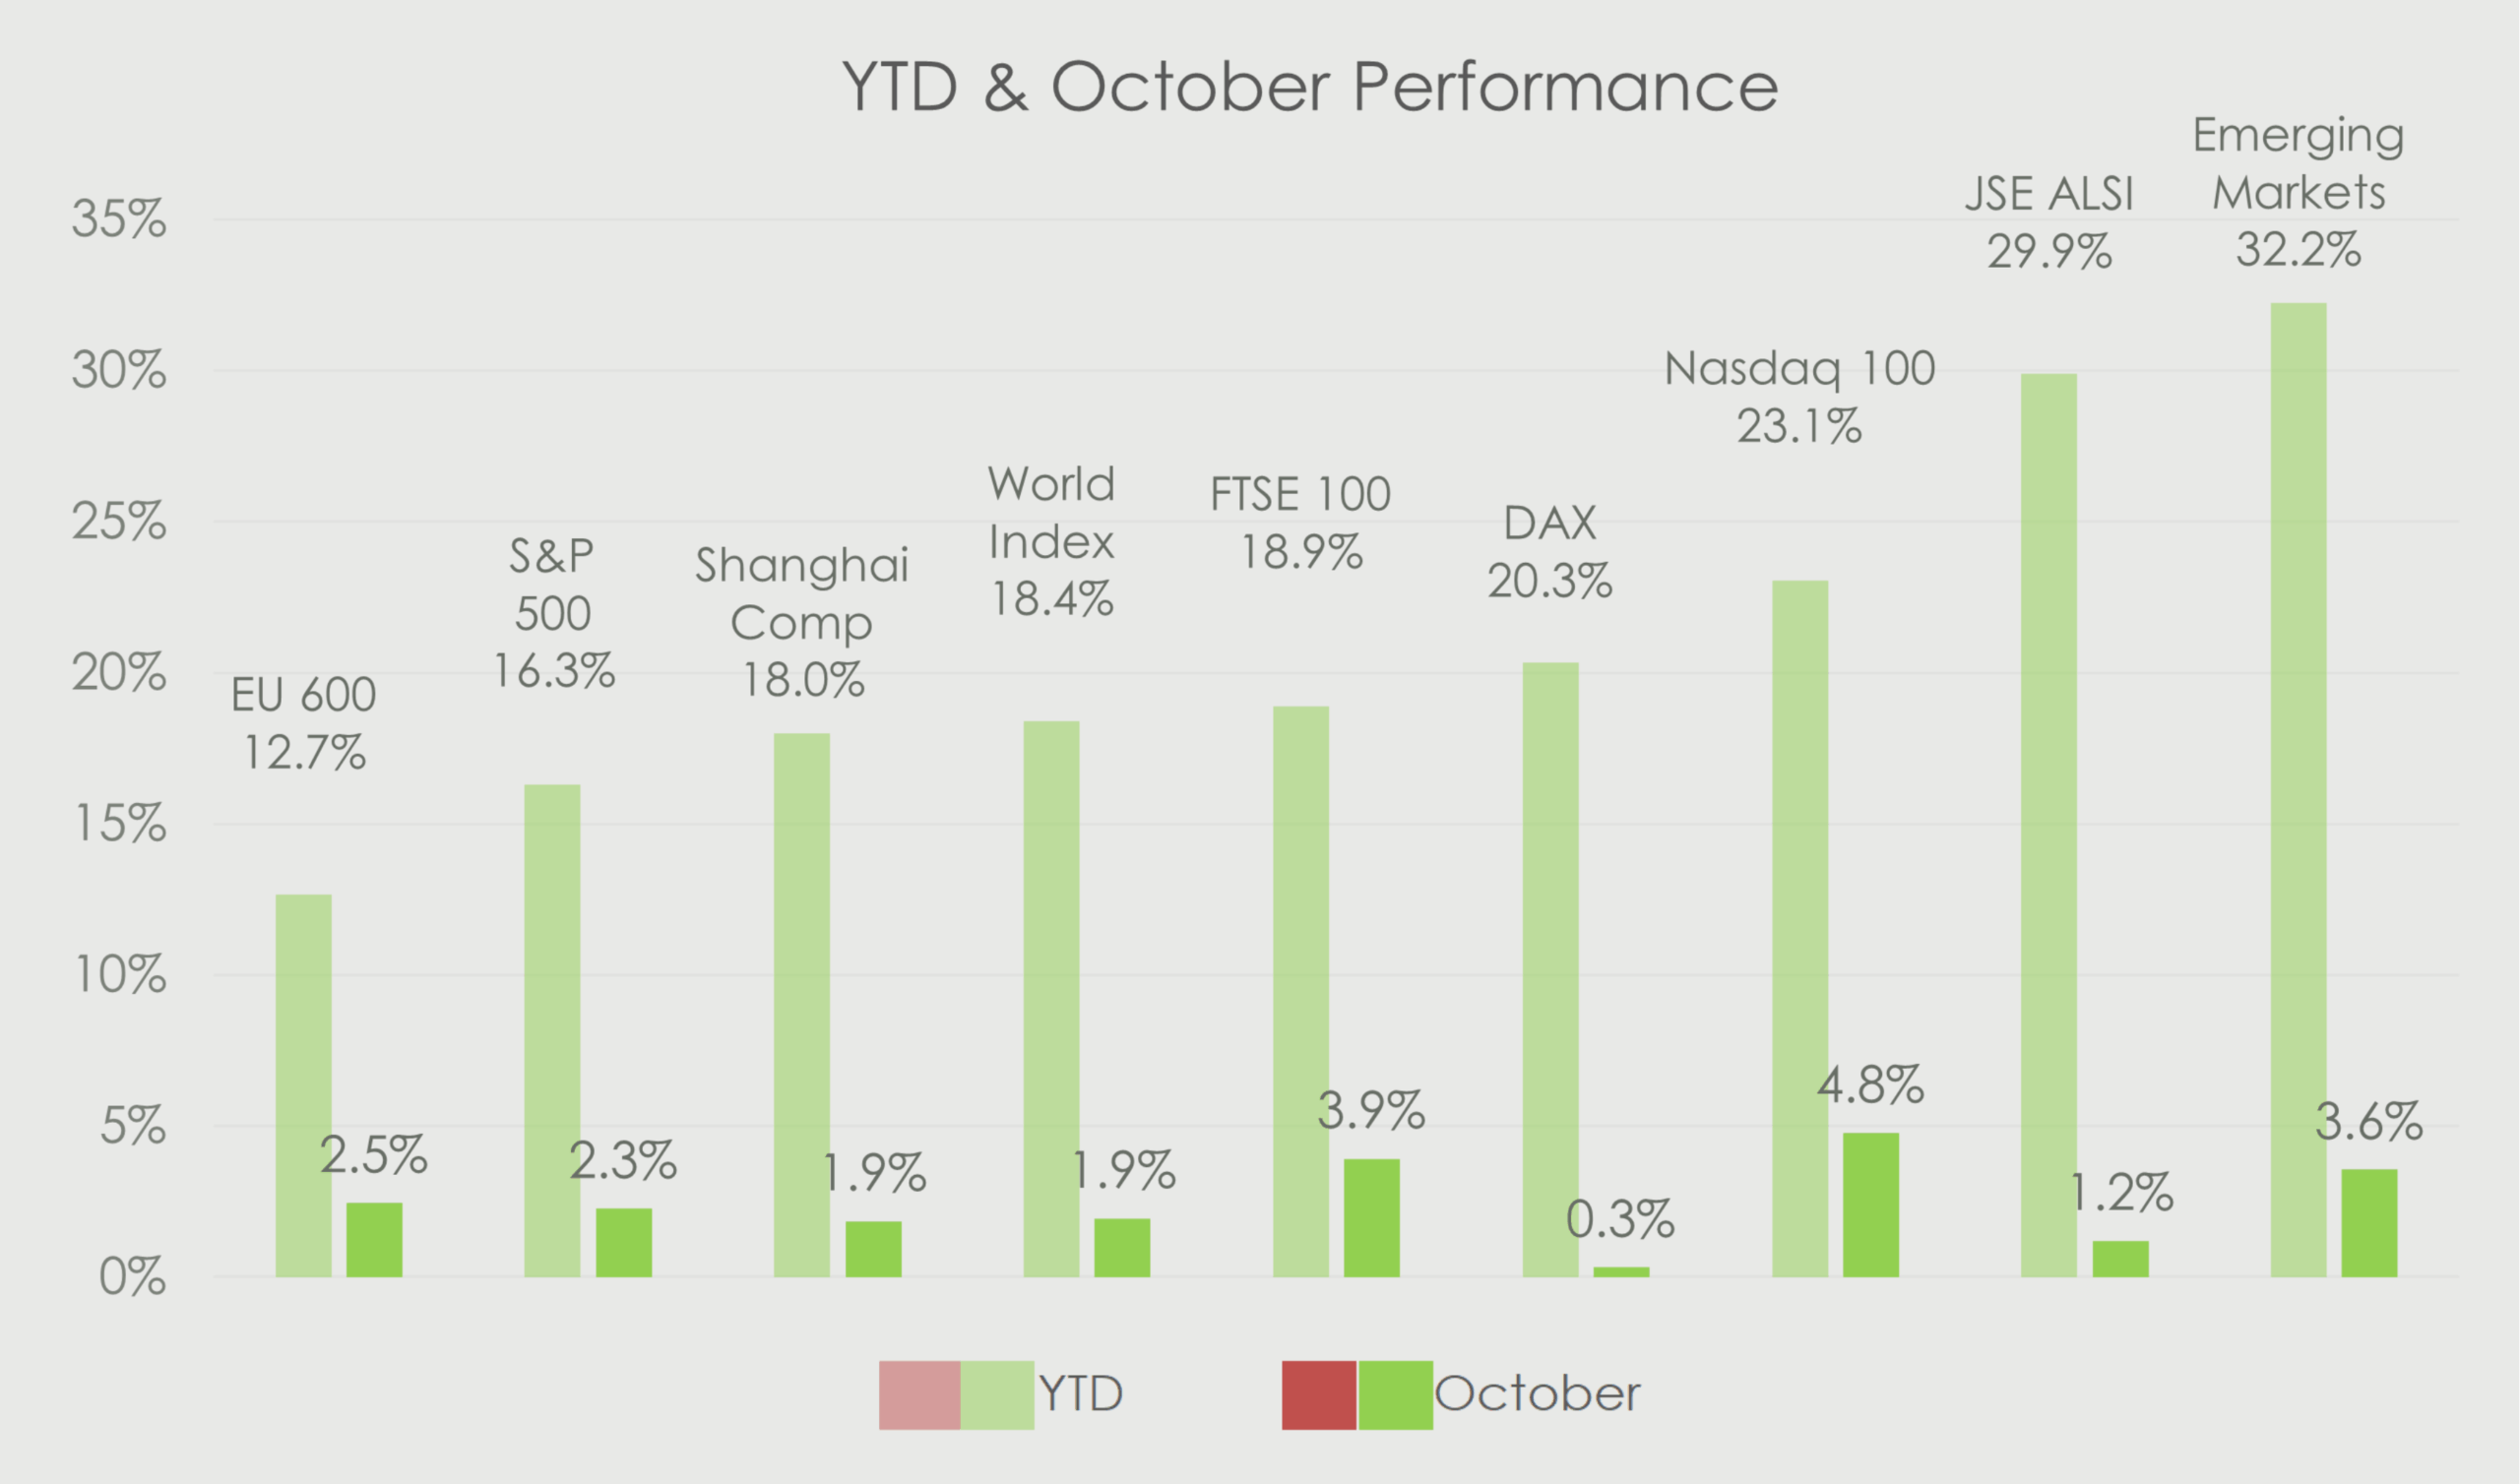
Markets posted strong gains in October, with major indices hitting record highs during the month. Gains were buoyed by the Fed’s 25bp interest rate cut, easing US-China tariff tensions, better-than-expected 3Q25 earnings, and AI investment momentum. Year-to-Date (YTD) equity markets continue to deliver solid returns.
As discussed in last month’s Wood for the Trees, we continue to believe that catalysts are in place to keep equity markets rallying into year end and beyond.
October kicked off with 3Q earnings reporting season, and it has been stellar to say the least. Any concerns about tariffs slowing growth is currently not reflecting in the operating performances of the companies. We started earnings season with analysts expecting earnings growth of 7.9%, with 90% of companies already reported, growth is coming in at an impressive 13.1%. Marking the 4th consecutive quarter of double-digit growth. Earnings growth is being driven by healthy revenue growth at 8.1% and improving net profit margins of 13.1%.
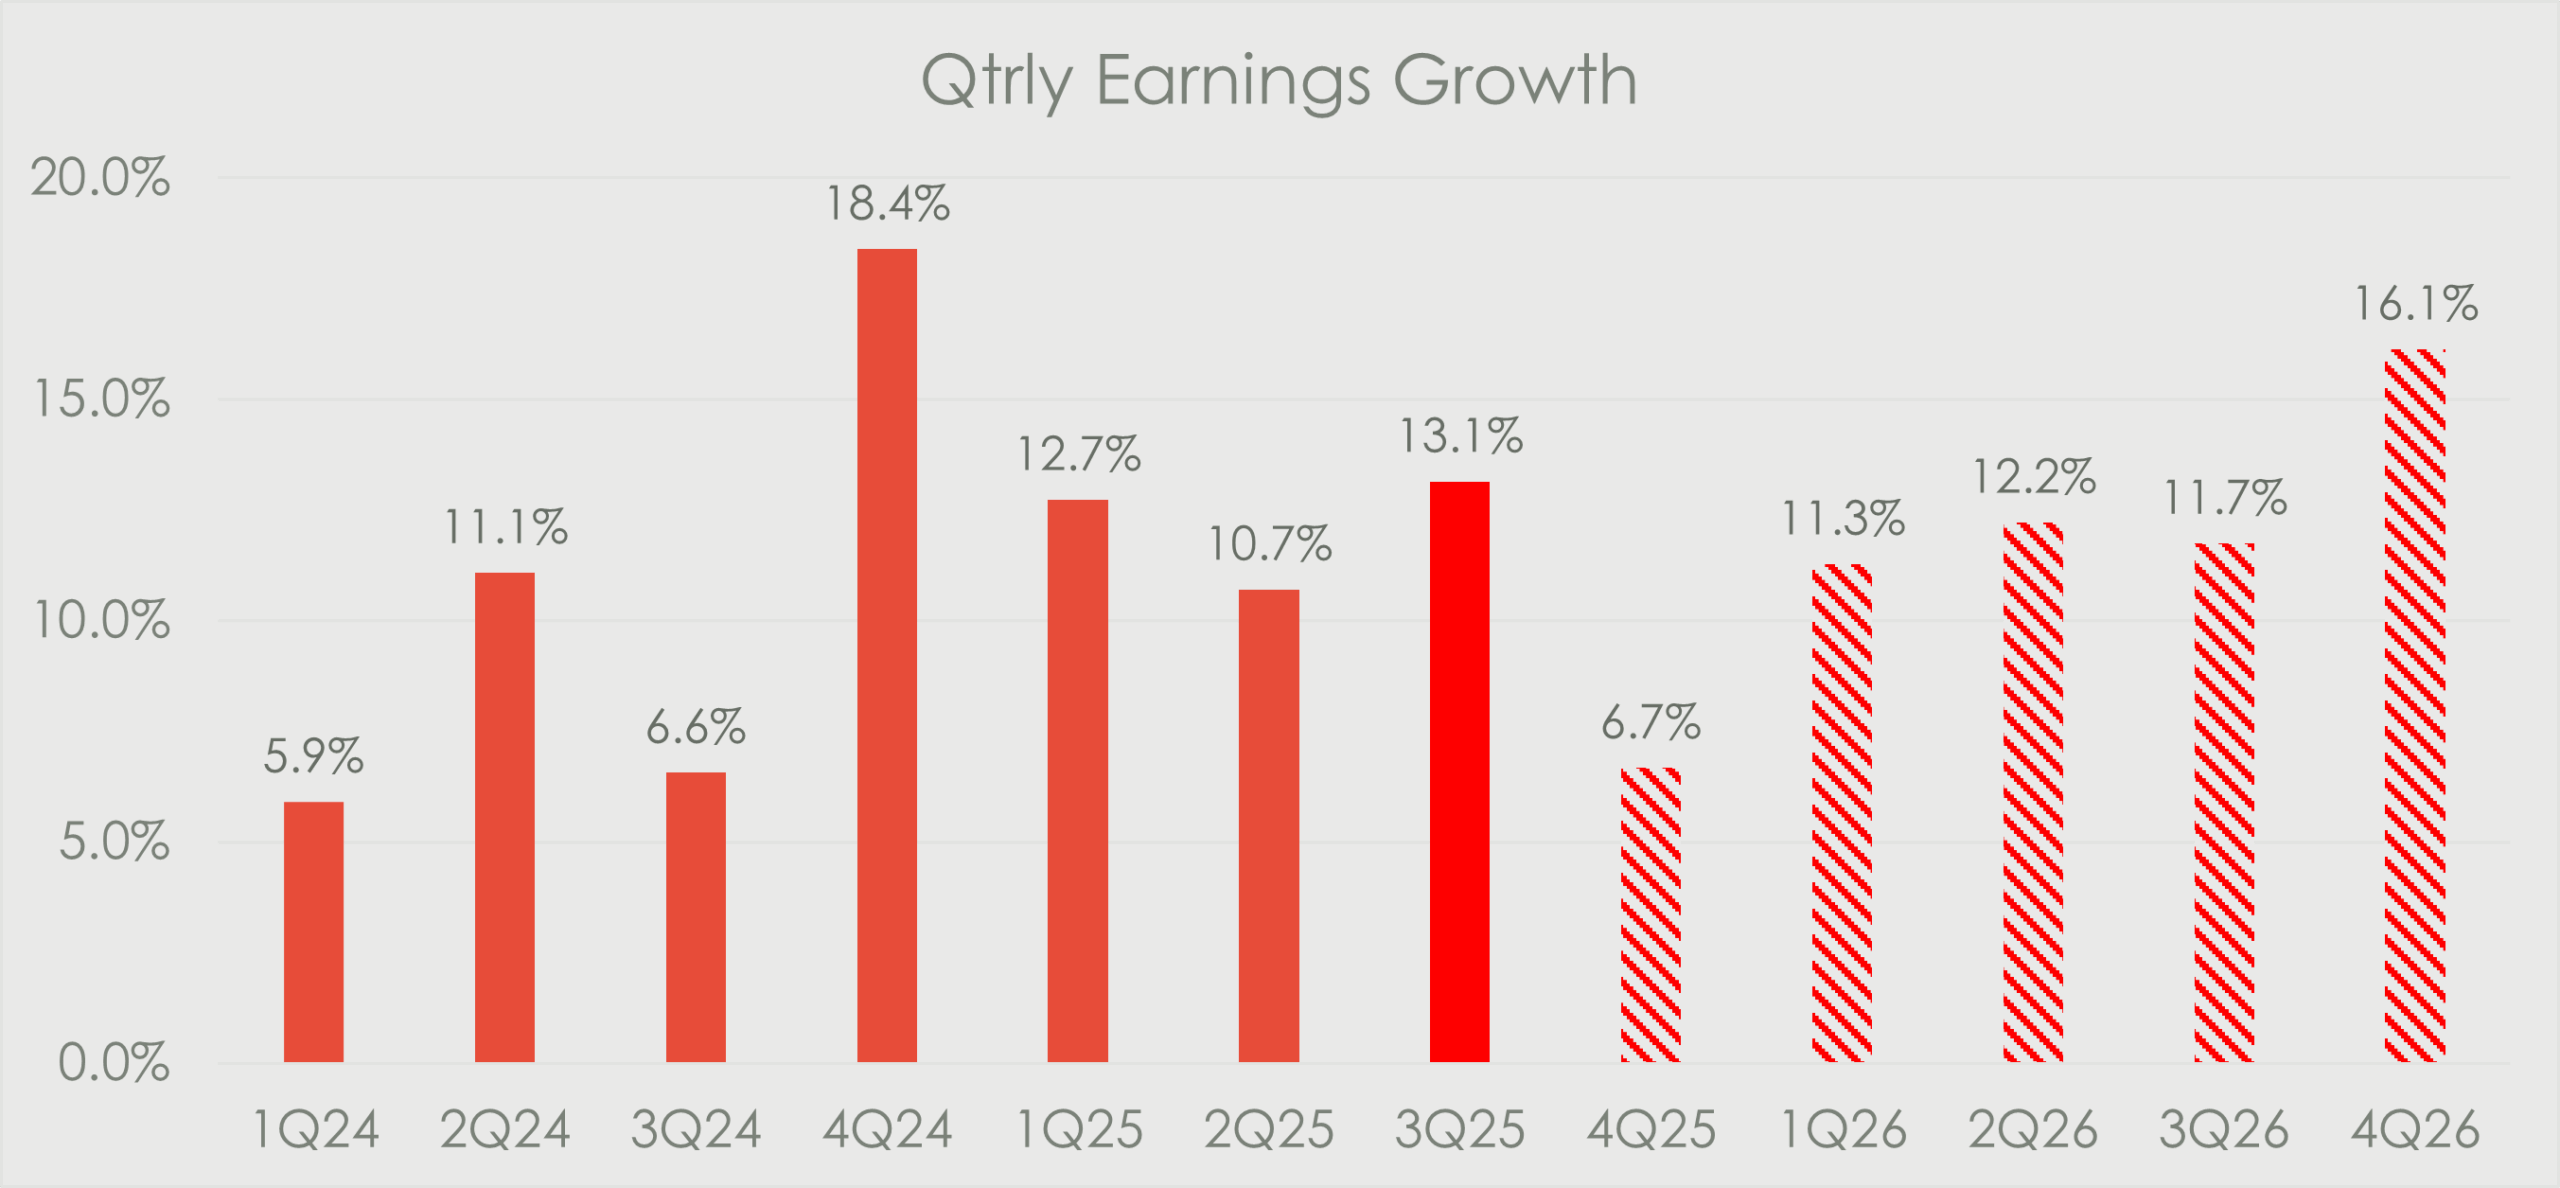
As earnings continues to grow at the current pace, valuation levels are justified and it’s hard to see any change in market trajectory.
Liza goes through the 3Q earnings season in more detail later.
The U.S. Fed met at the back end of October, and cut rates as expected by 25bps to a range of 3.75-4.0%. In addition to the rate cut, the Fed announced it would stop its Quantitative Tightening program by December, which will ultimately have the effect of keeping government bond rates down, a positive for equity markets.
“In the Committee’s discussions at this meeting, there were strongly differing views about how to proceed in December. A further reduction in the policy rate at the December meeting is not a forgone conclusion. Far from it.” Jerome Powell
Despite this, the rate market is still pricing in a 64% chance of another cut in 2025, followed by 2 further cuts in the first half of 2026. It goes without saying that cutting cycles are typically good for equity markets.
We had good news on the tariff front as President Trump went on a tour of Southeast Asia, striking trade deals on his way to South Korea to a much-anticipated meeting with Chinese President Xi. Prior to the Trump/Xi meeting, Steve Bessent and the Chinese trade envoy successfully bashed out an amicable trade deal between the U.S. and China. Ultimately, Trump and Xi rubber stamped a tariff truce which removed a large overhang for markets. The broad outline of the agreed deal is as follows:
-
- One-year trade agreement to be revisited every year
- China agreed to purchase U.S. agricultural products
- China to take steps to stop fentanyl flows in exchange for a reduction in the 45% Fentanyl tariff penalty to 10%
- China to suspend rare earths export controls for one year. The U.S. removed 50% tariff for one year
- U.S. to stop fees on China made shipping fleet
Is AI a Bubble waiting to Pop?
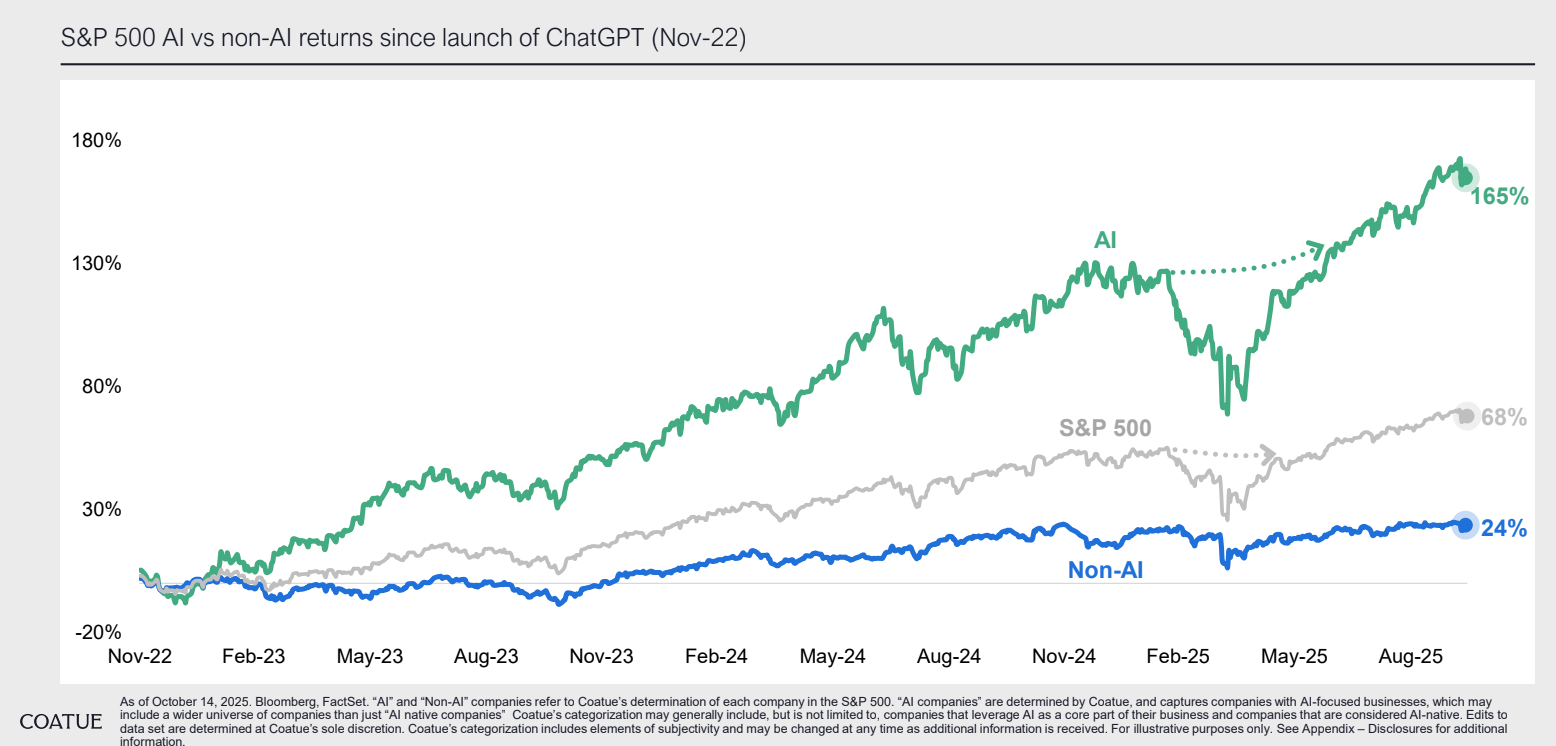
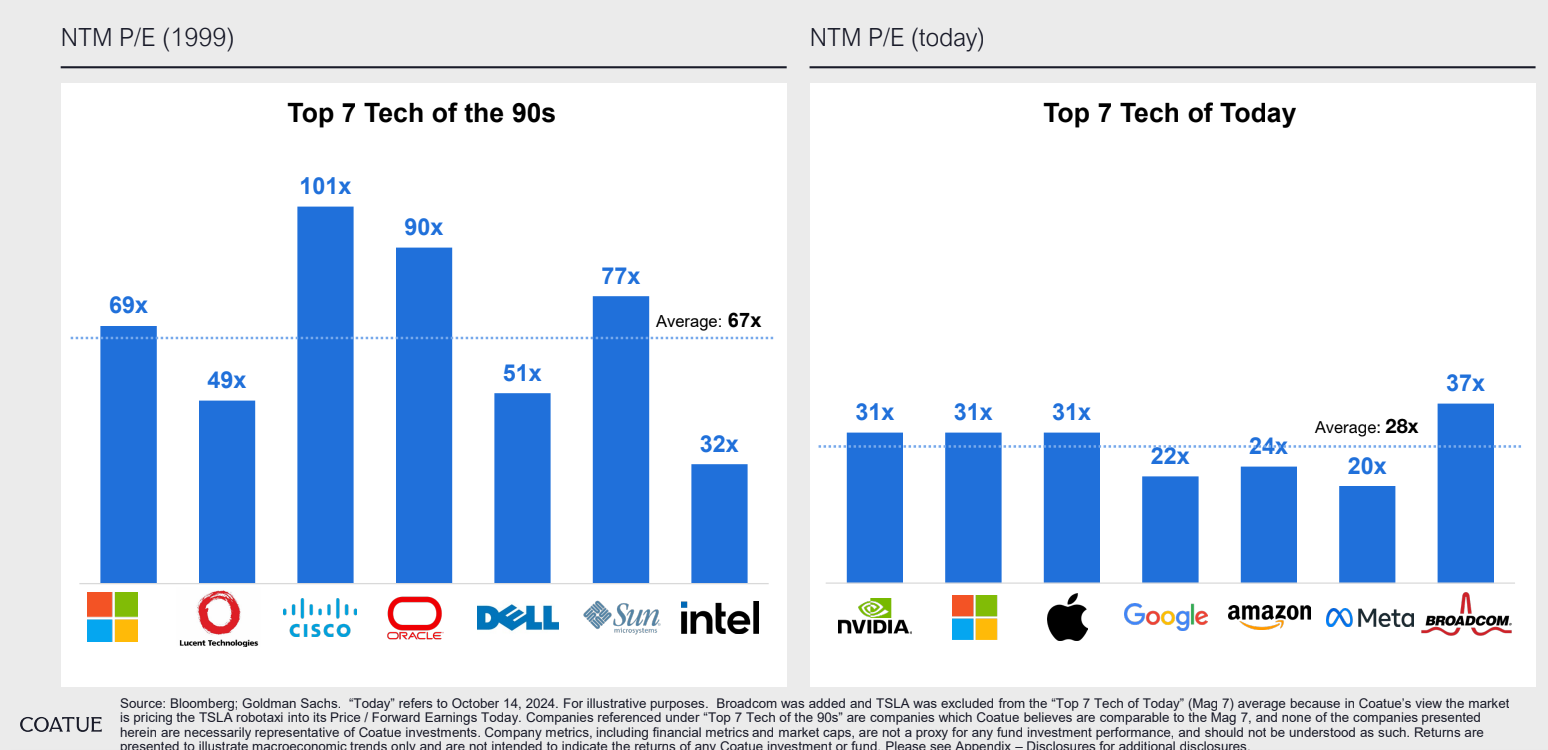
Given the incredible run we have seen in AI-related stocks and the growing murmurings from bears, comparing the run up to the Dot.com bubble in 2000, suggesting that it’s a bubble waiting to pop. Below are a few reasons we don’t believe this to be the case.
1) Valuations are not nearly as stretched. S&P 500 valuations shot up to almost 50x in 2000 with the top tech names trading at nosebleed levels approaching 100x. This is not the case today, S&P 500 valuations are only modestly above the long run average, with the tech giants trading at very reasonable valuation levels relative to growth rates.

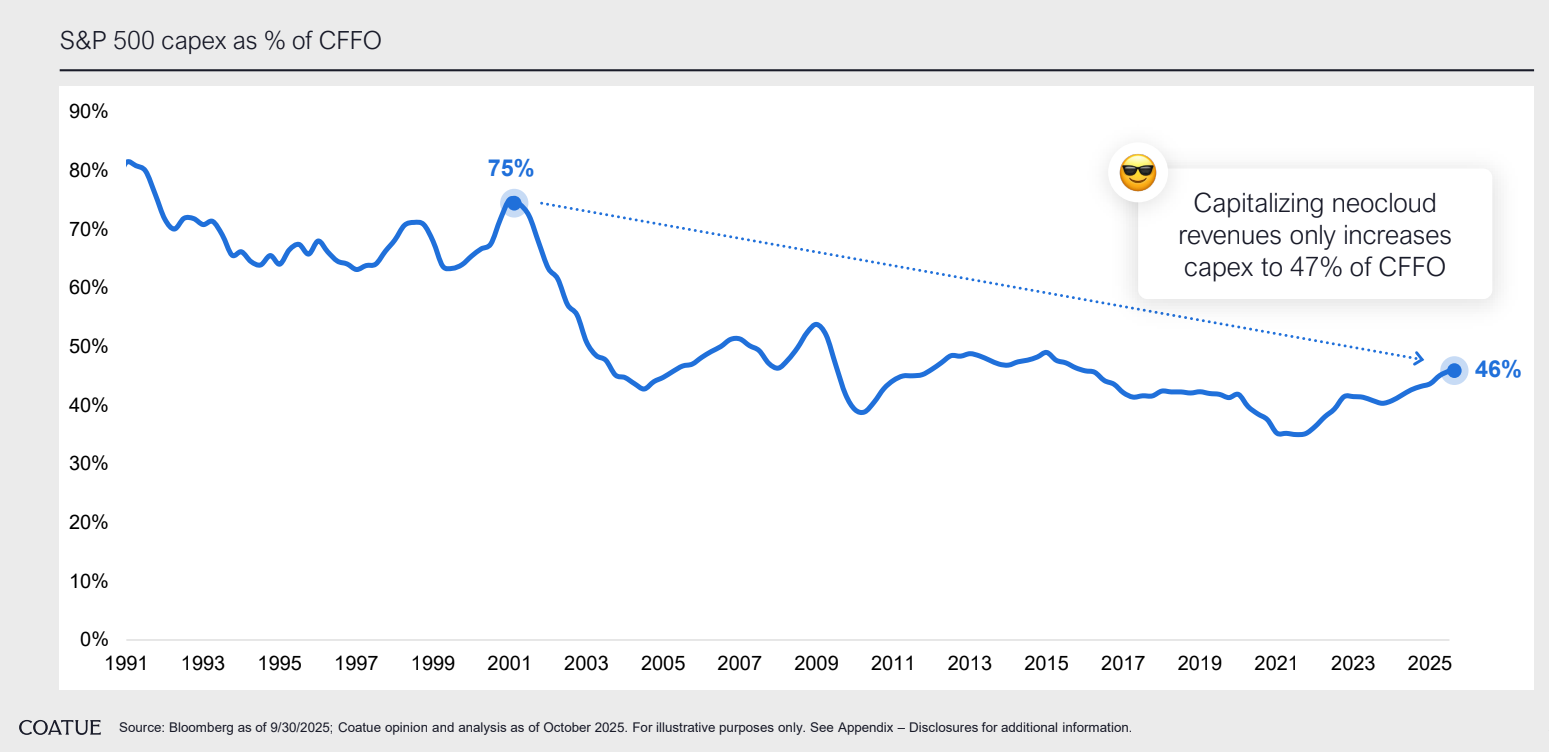
2) Capex is growing but it is being funded with operating cash flow
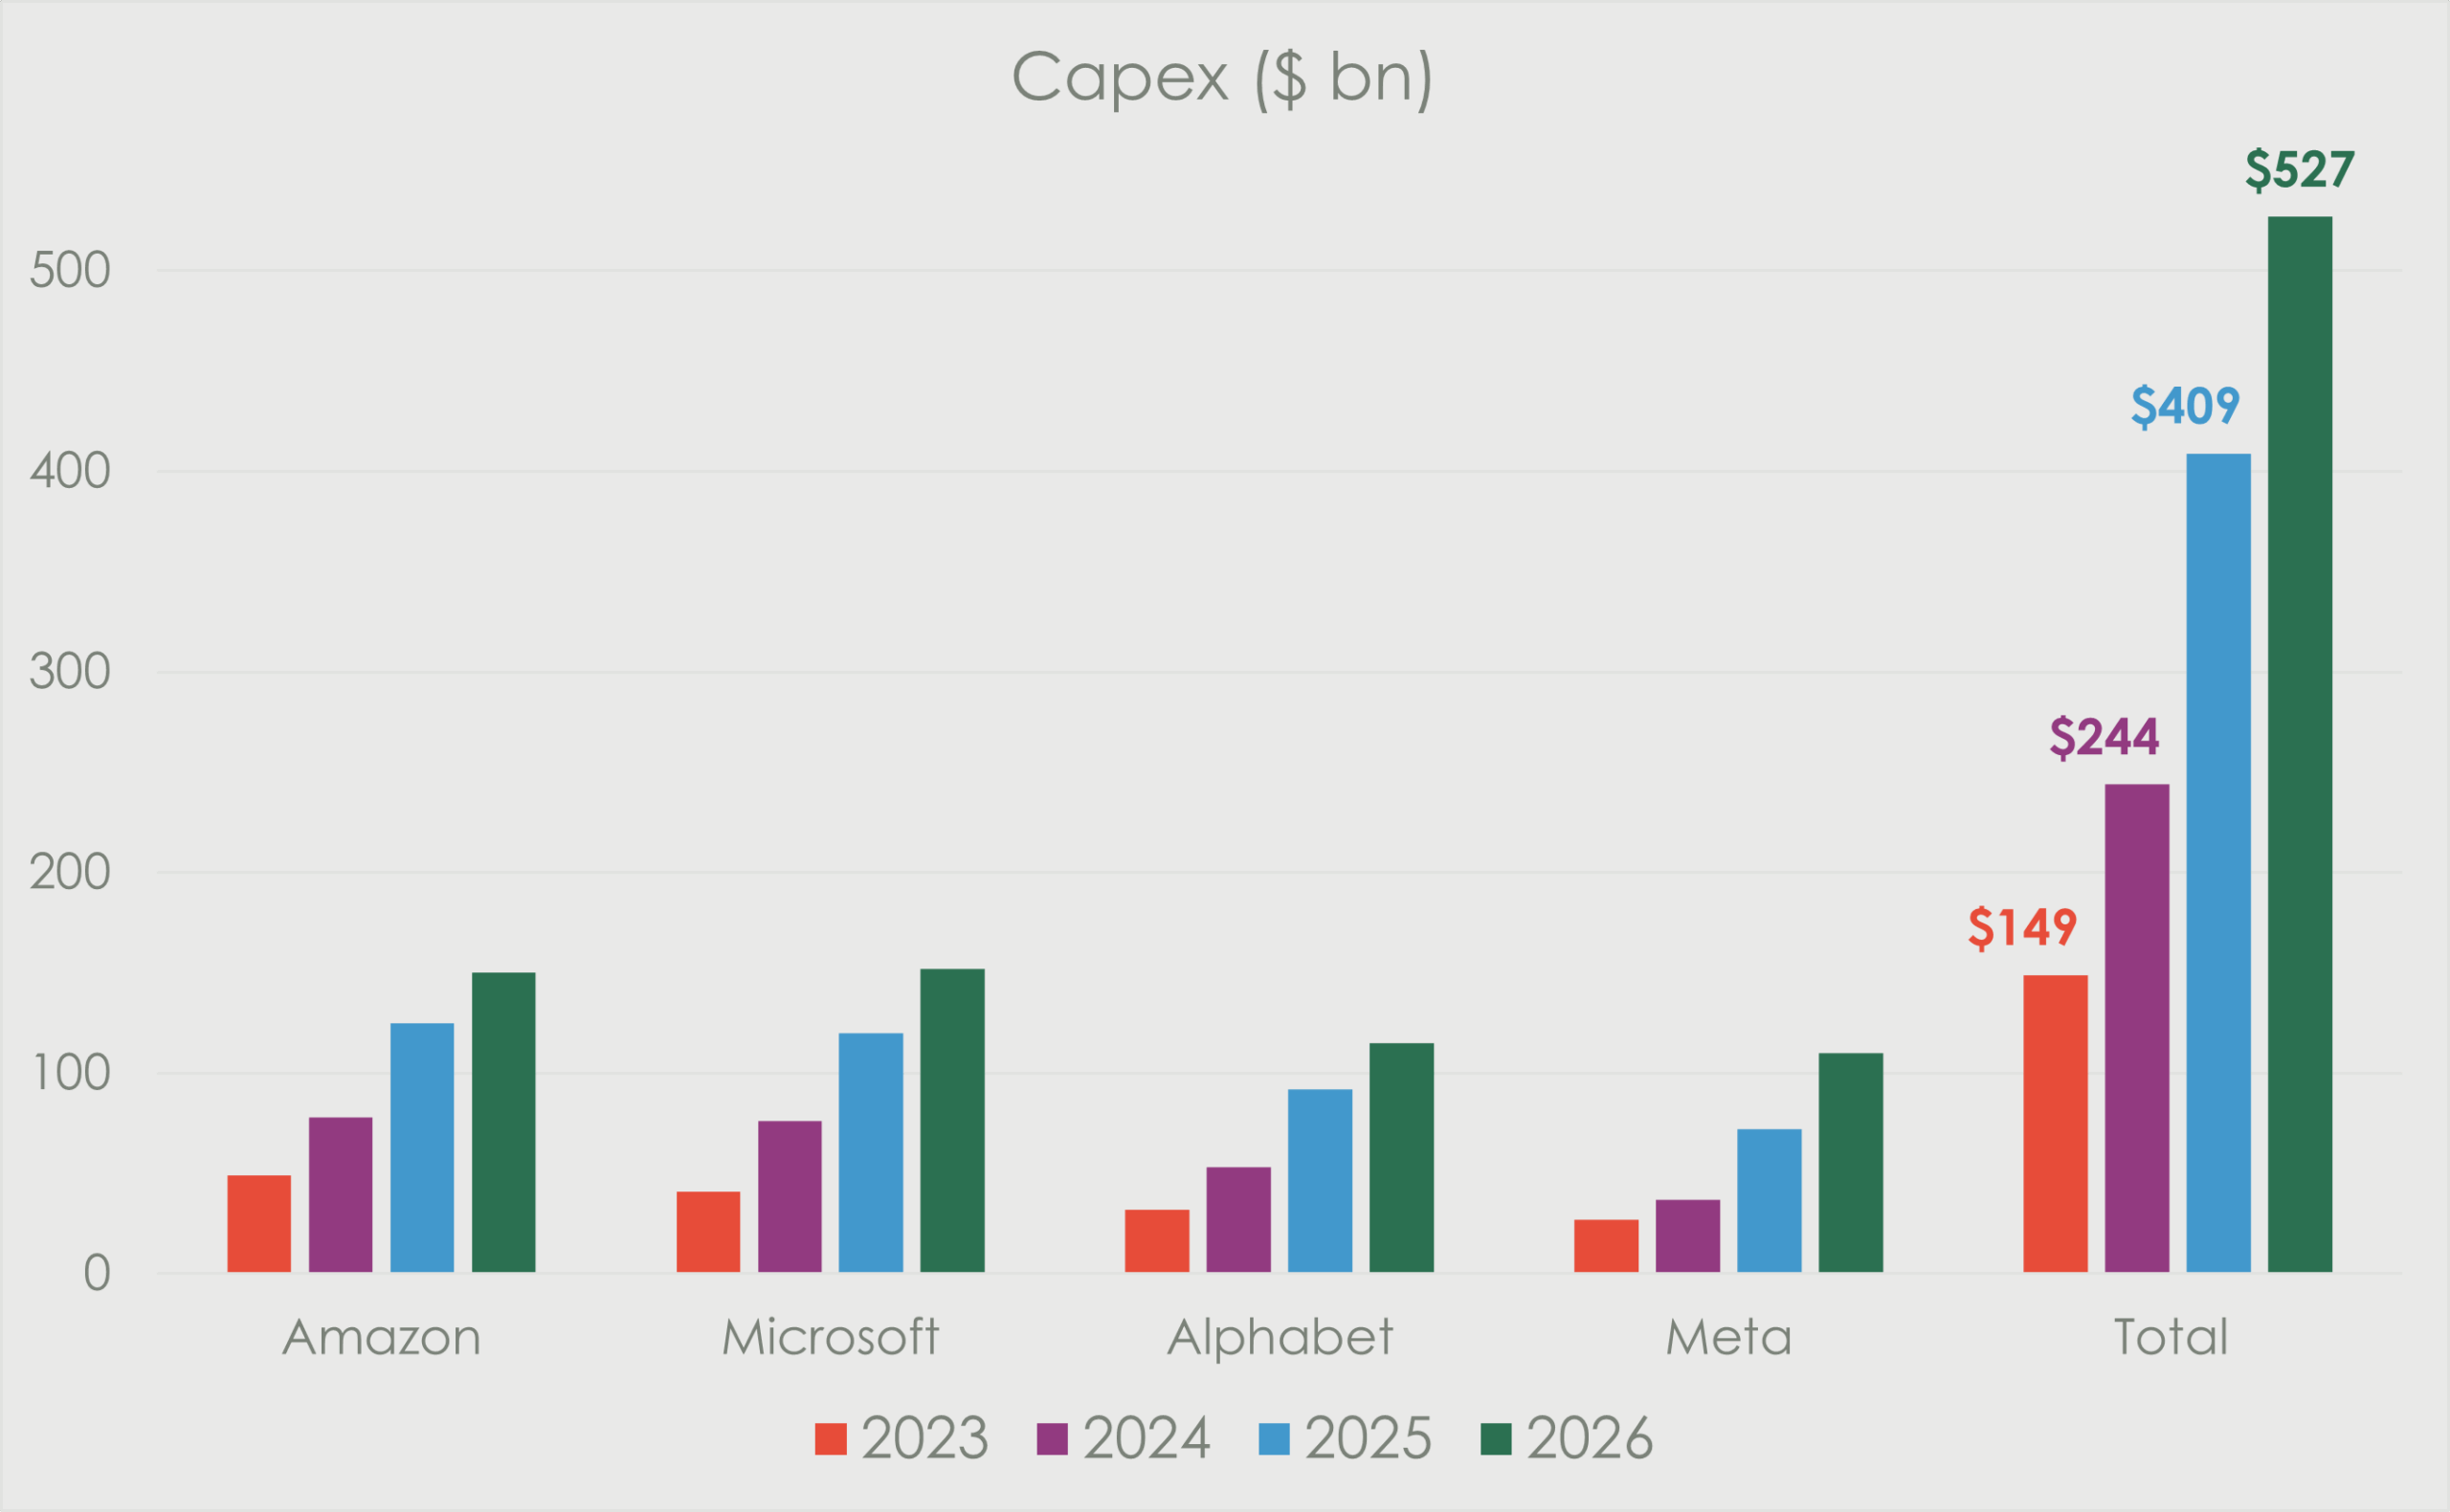
The level of capital spending by the big hyperscalers is astronomical. The Capex run rate for 2025 is R441bln, with 2026 expected to growth 28% to $566bln.

However, given the levels of profitability of the tech companies, they are easily able to fund the capital spend requirement from operating cash flow without limiting investments into other operating segments and placing pressure on their balance sheets.
3) Backlog growth is now outpacing Capex growth.
The question surrounding the massive capex spend given the large numbers, is what the ROIC will be. We are beginning to see a backlog revenues growth that is outpacing that of Capex. Suggesting Demand is beginning to outstrip Supply.

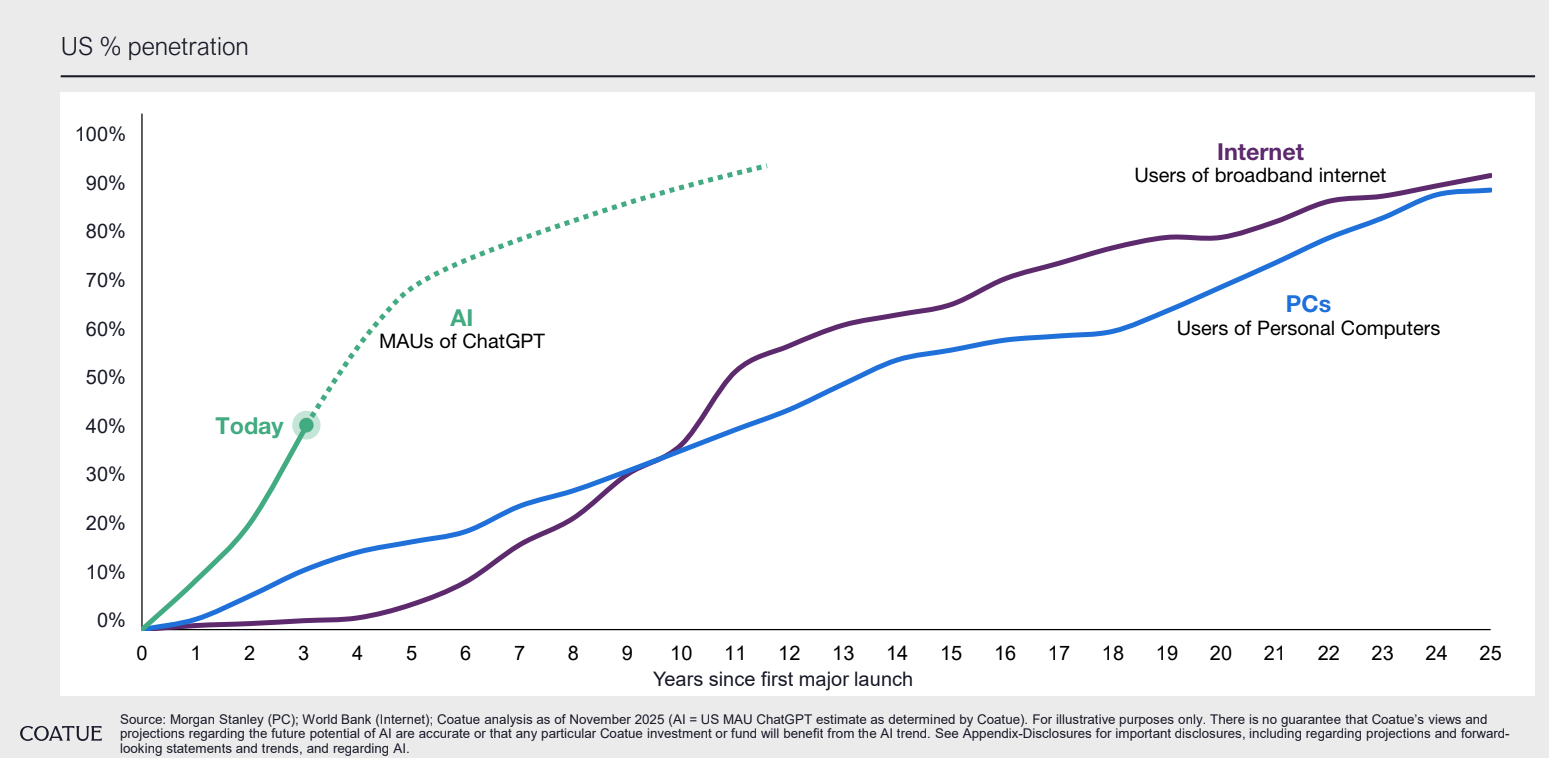
In conclusion, we are not too concerned when we hear comparisons to the 2000 Dot.com bubble. In any bull market there are those companies that run up on nothing but hype. We are always conscious of valuations and actual earnings growth. For now, we are still in the early innings of AI and adoption levels are through the roof.
International section
Local section

By the Numbers
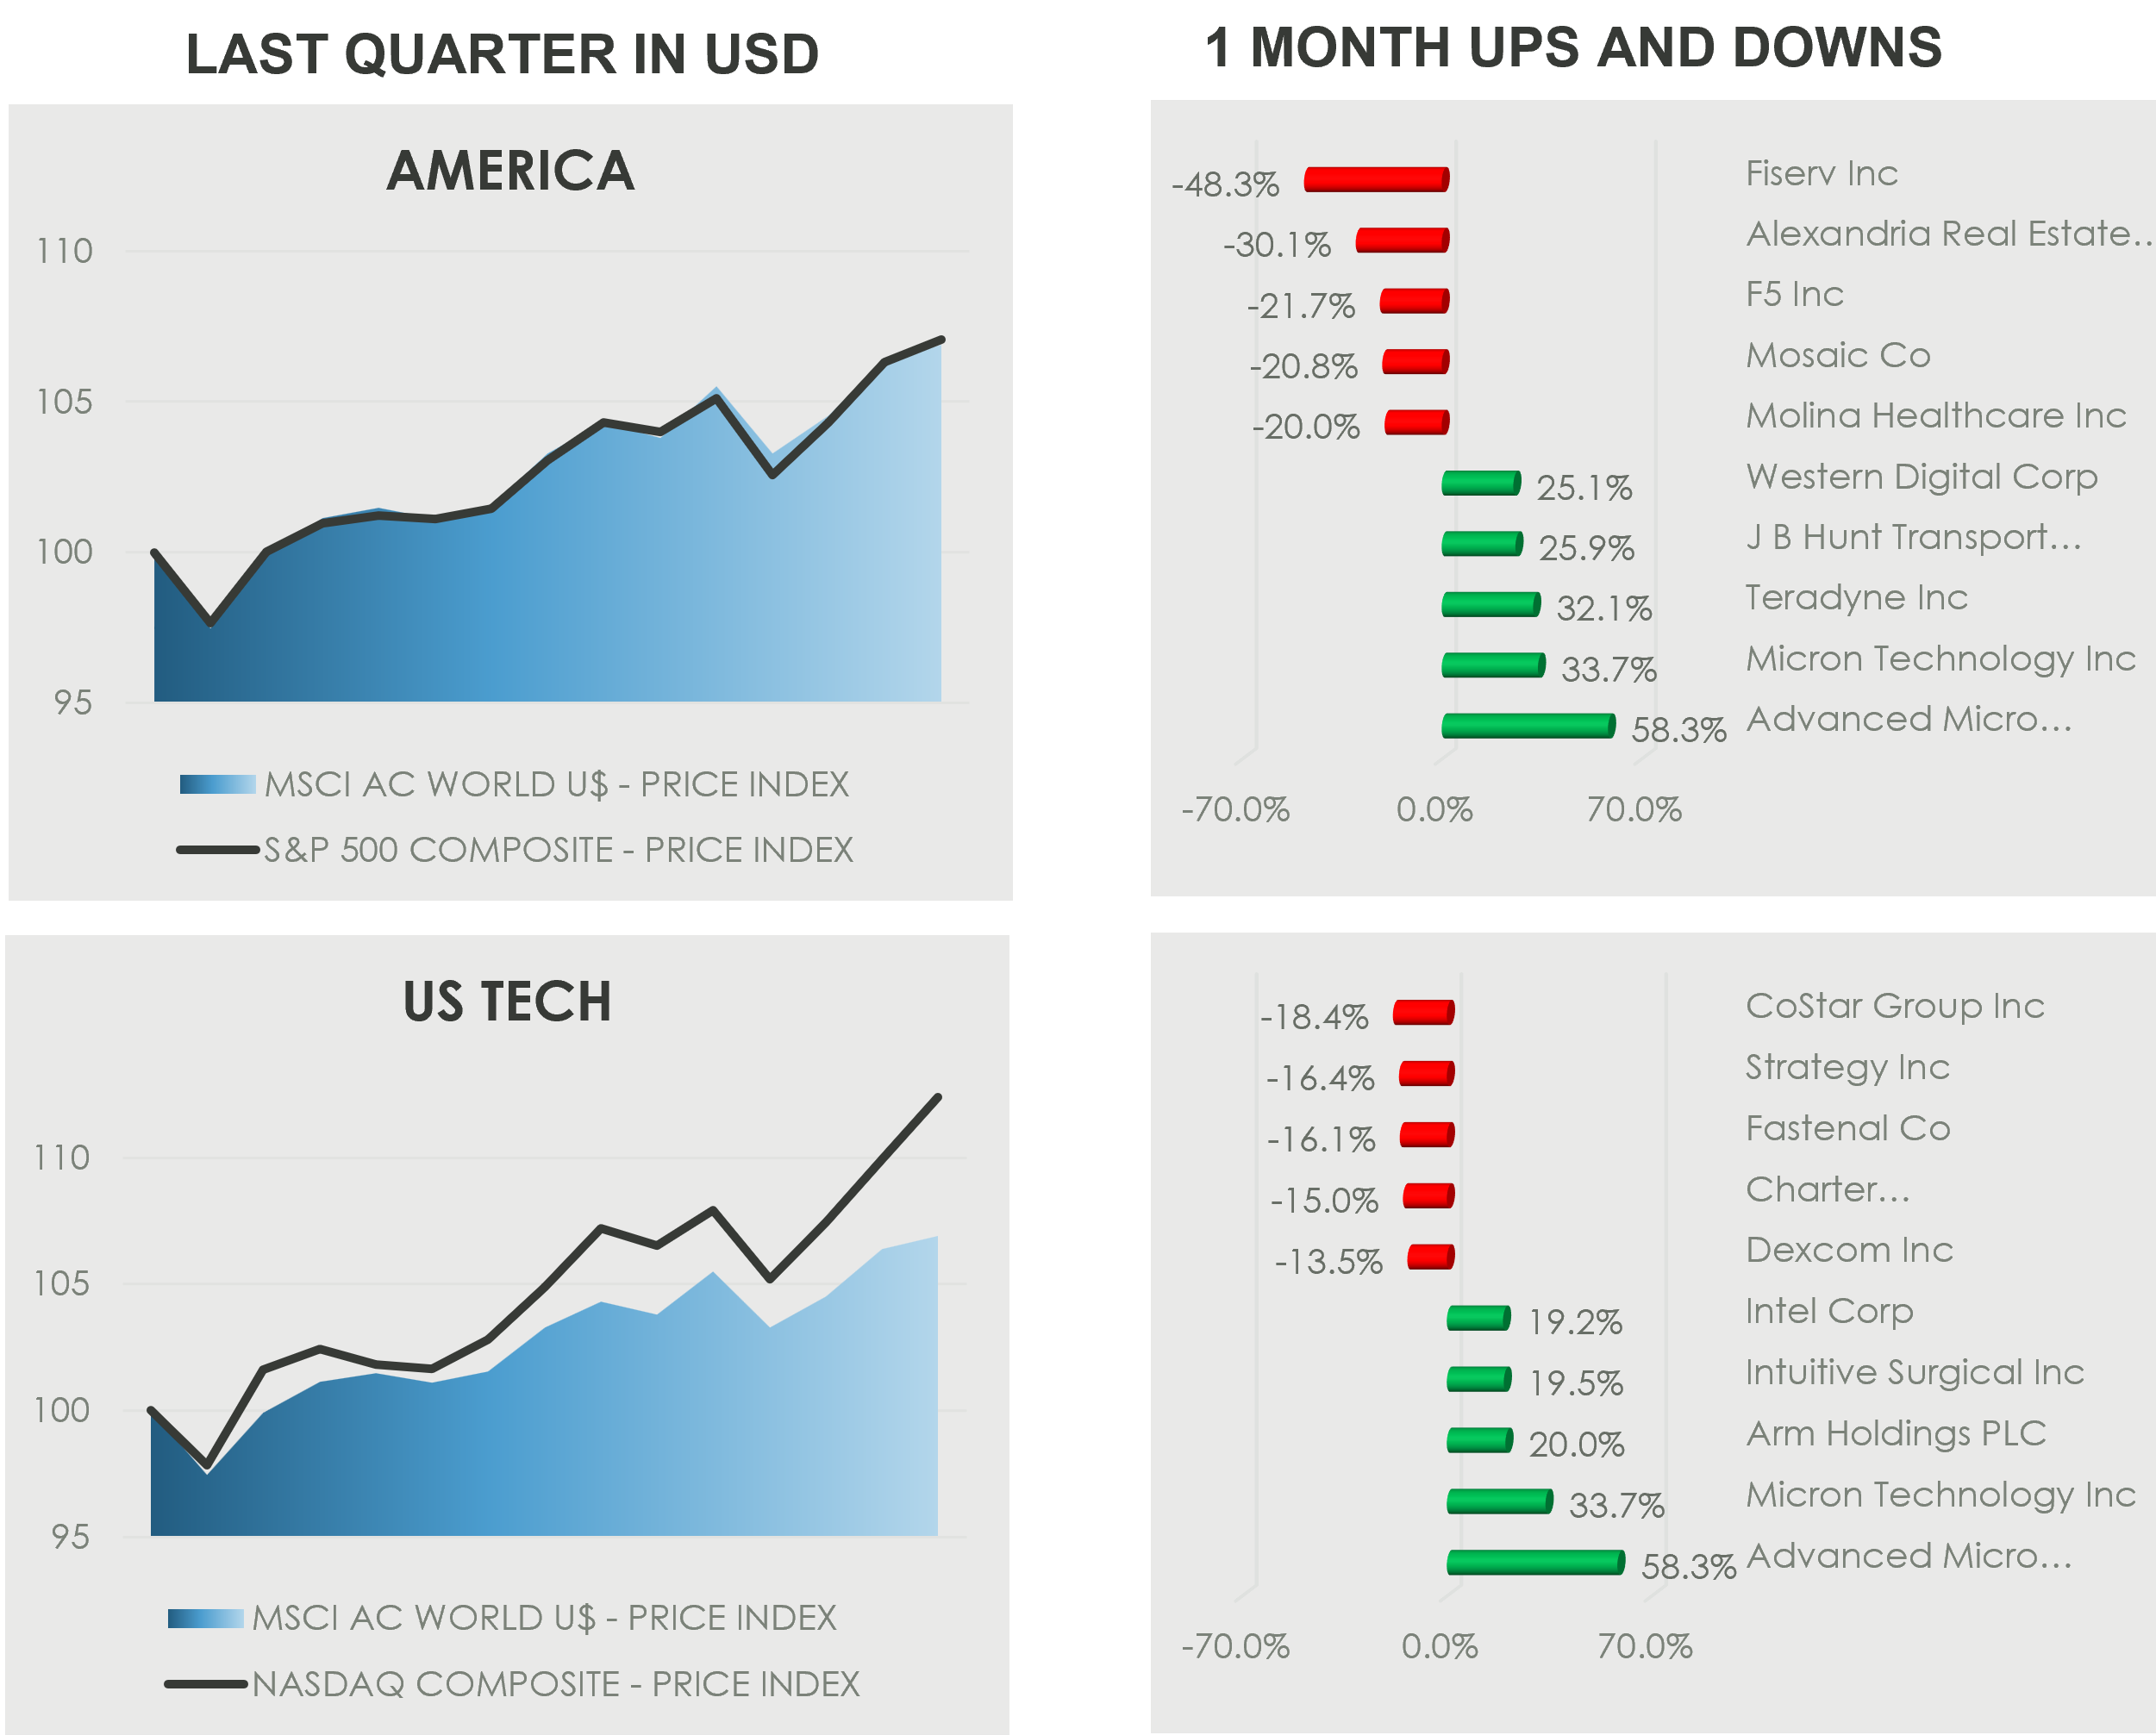
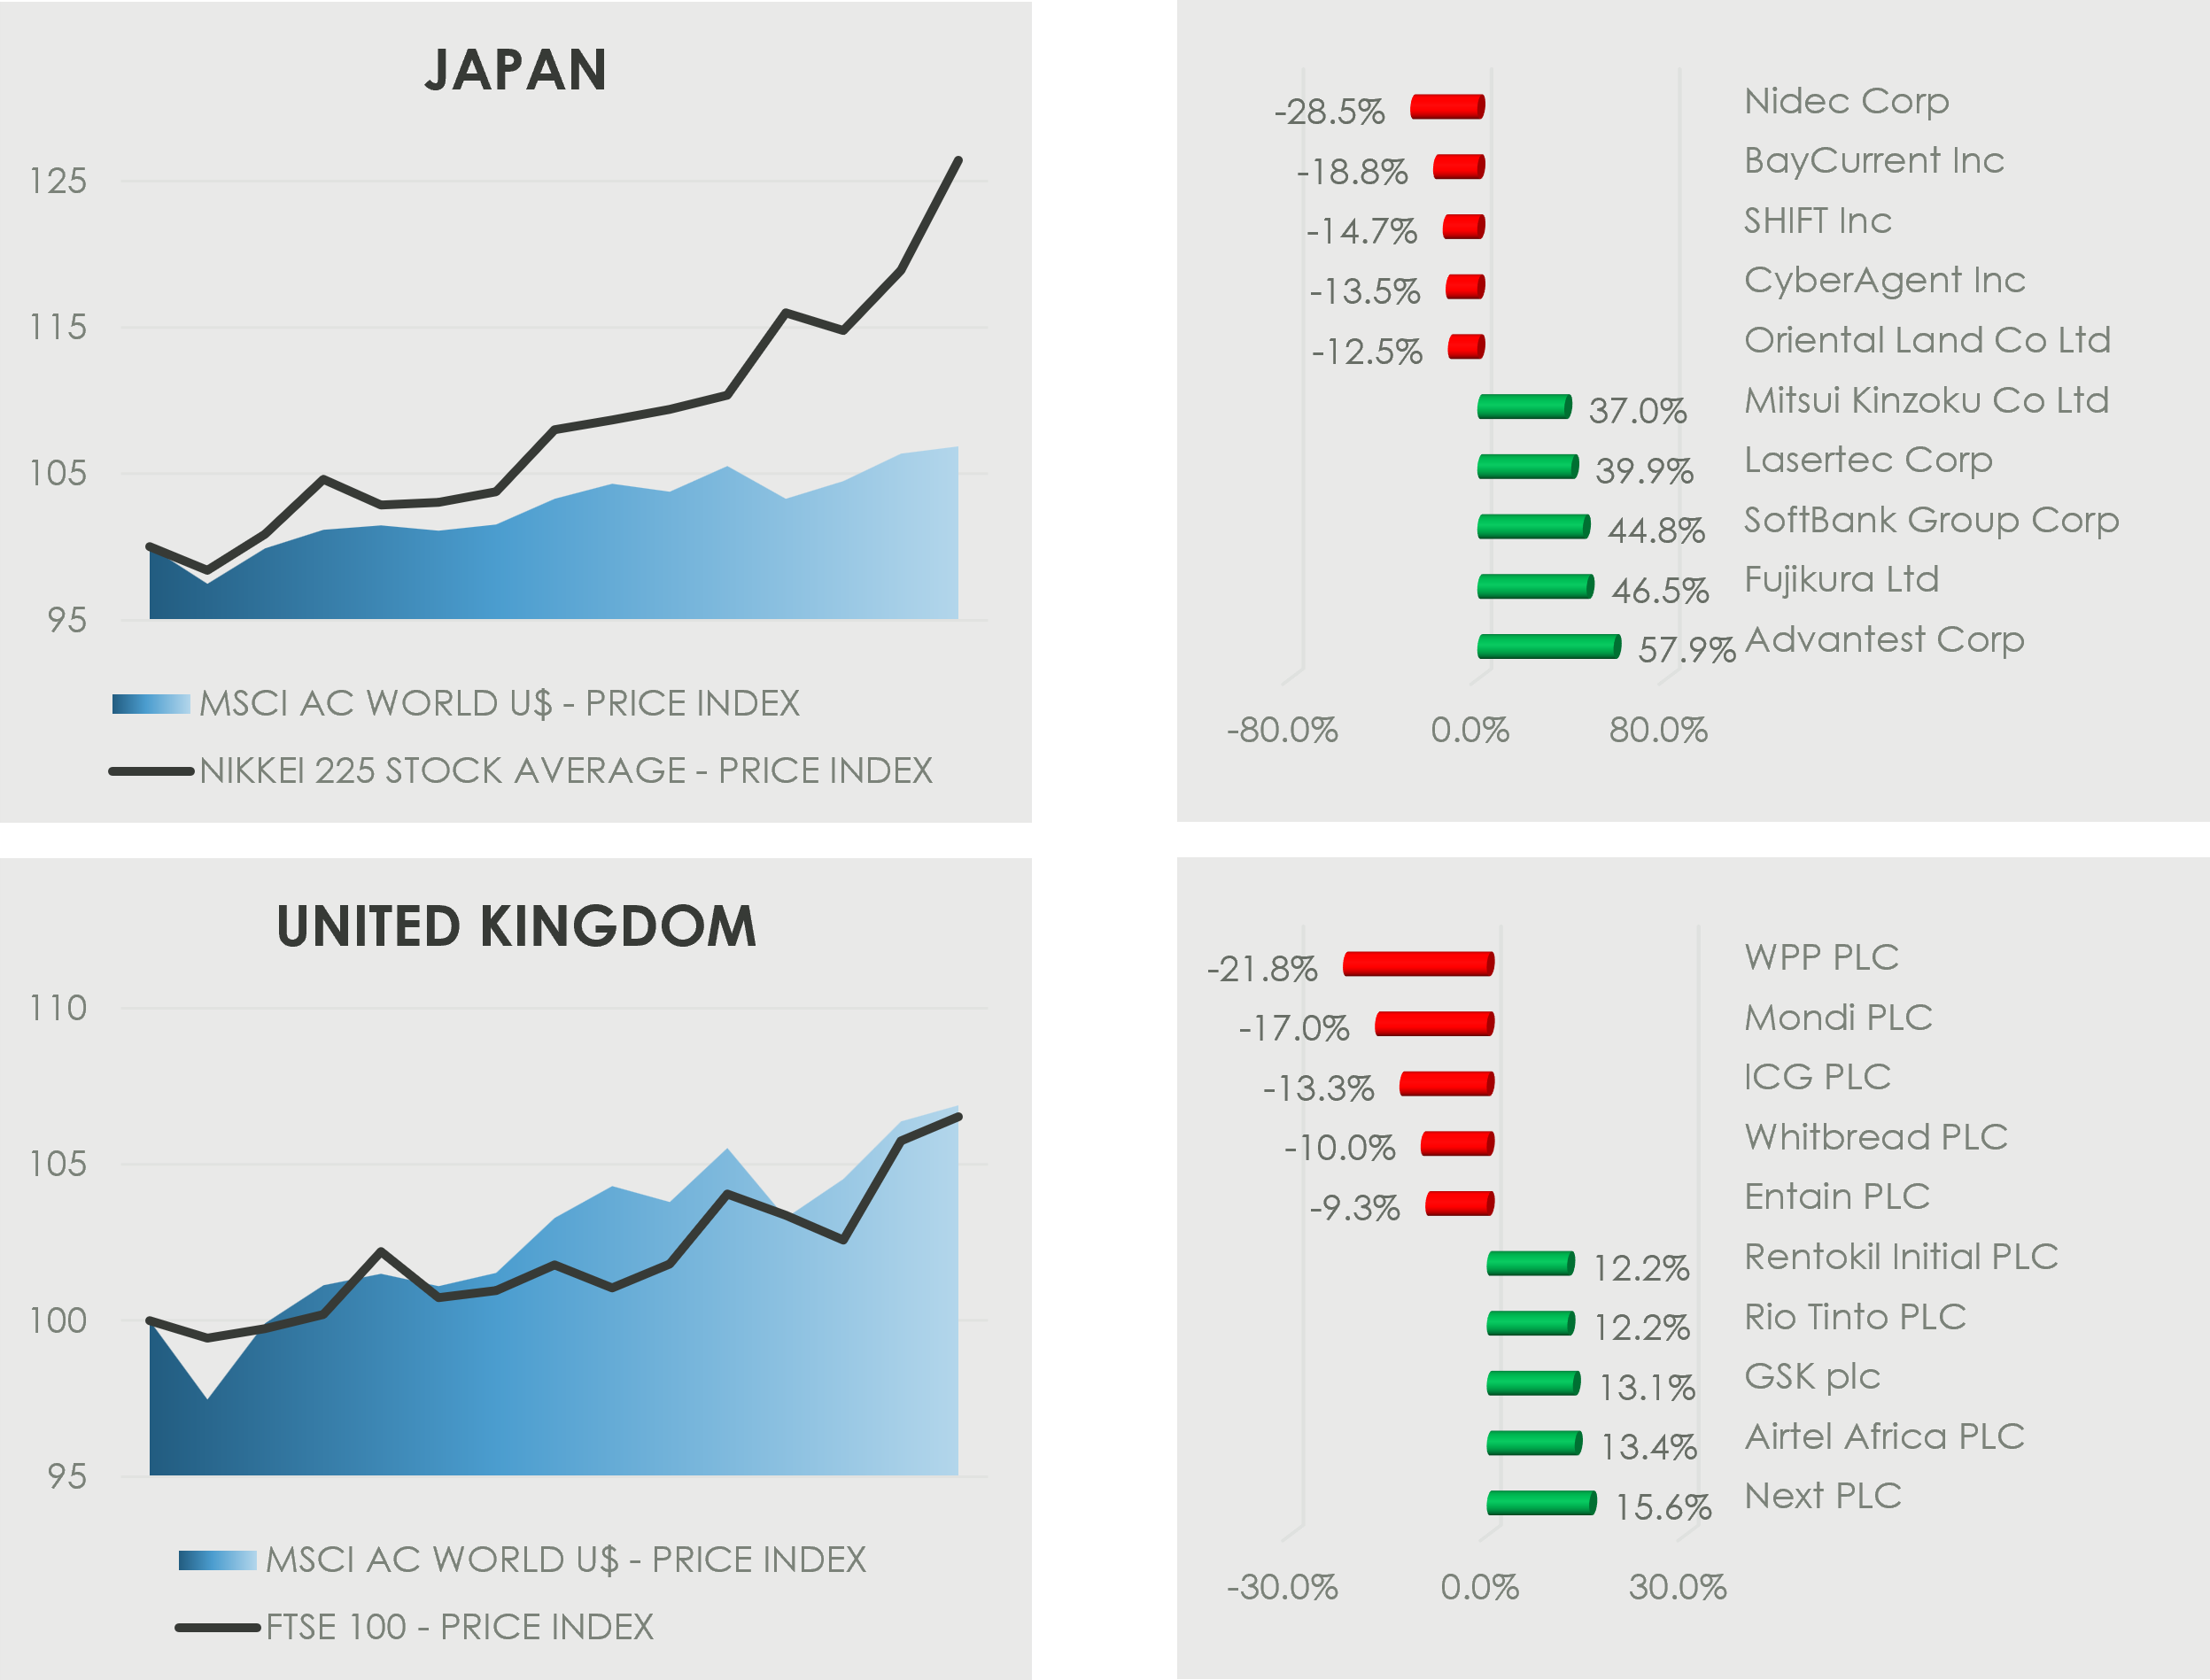
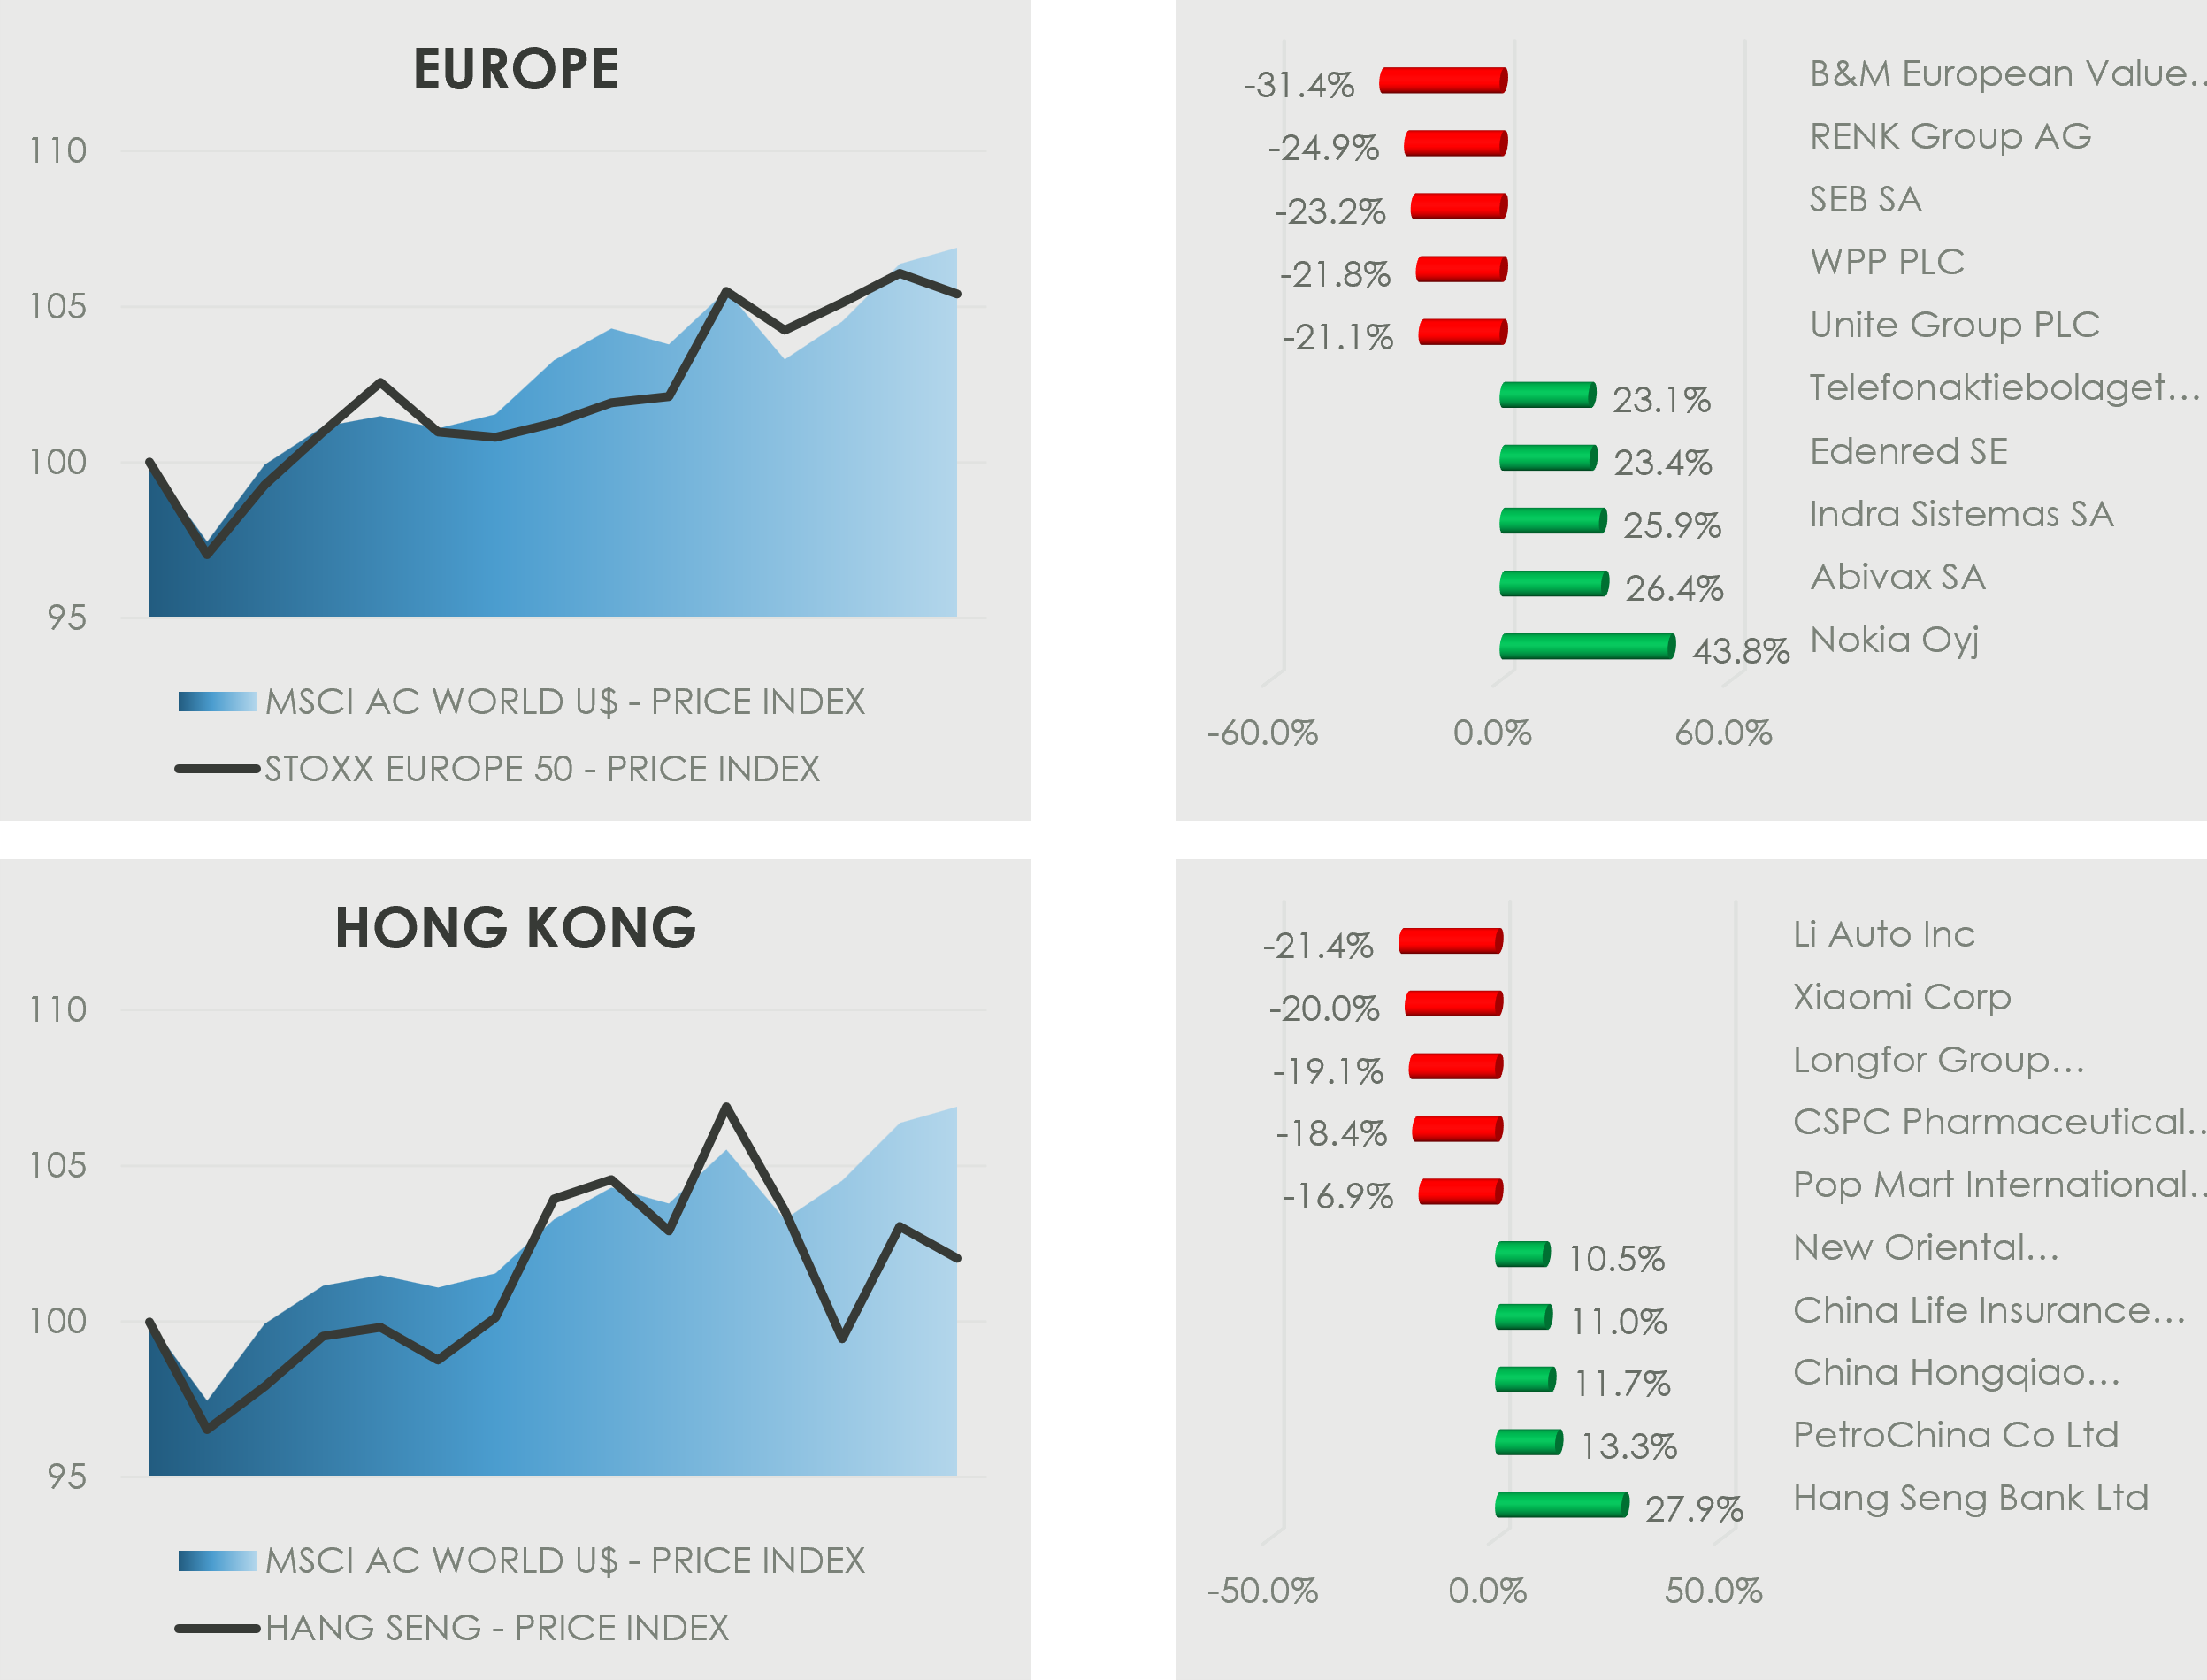
Global equities extended their gains in October, supported by resilient corporate earnings, AI optimism, and easing inflation expectations. The S&P 500 rose +2.3%, while the Nasdaq outperformed with a +4.7% gain. Semiconductor and AI-related names such as AMD (+58.3%) extended its rally following upbeat earnings and record data-center revenue growth. Gains included Micron (+33.7%), Teradyne (+32.1%), Western Digital (+25.1%), Arm Holdings (+20.0%) and Intel (+19.2%). J.B. Hunt (+25.9%) benefitted after the U.S. trucking firm’s rise in profits.
On the other hand, Molina Healthcare (–20.0%) guided to slower membership growth, Mosaic (–20.8%) fell on lower fertilizer prices, and Alexandria Real Estate (–30.1%) slumped after revising its guidance downward amid softer U.S. office fundamentals. Payments firm Fiserv (–48.3%) was the biggest laggard following a disappointing quarterly update that missed estimates.
In Europe, the FTSE 100 advanced +3.9%, the EU 600 gained +2.5%, and Germany’s DAX edged higher by +0.3%. Nokia (+43.8%) and Ericsson (+23.1%) rallied on a rebound in 5G infrastructure demand. Consumer retailer Next (+15.6%) benefitted from resilient spending, while Mondi (–17.0%) fell after profit slowed on weak demand and lower prices.
China and Hong Kong markets posted broad gains in financials and energy. Hang Seng Bank (+27.9%) rebounded on improved net-interest margins, while PetroChina (+13.3%) advanced alongside stronger energy prices. Education group New Oriental (+10.5%) also rose on robust enrolment data. On the downside, Li Auto (–21.4%) declined amid weaker EV demand.
Q3 Earnings Update
Third-quarter earnings season painted a constructive picture, showing better-than-expected results, a resilient consumer, and the undeniable giant that is AI investment.
Tech: AI Investment Reaches New Heights
AI and cloud computing remain the dominant growth engines across the tech space, with hyperscaler capital expenditure (capex) continuing to surge, and demand consistently exceeding available capacity. Capacity is expected to remain tight into 2026, with AI-related investment cascading across industries – from chip fabrication to power generation.
Microsoft posted quarterly revenue growth of 18% year-over-year (Y/Y) and EPS growth of 13%. Intelligent Cloud segment grew 28%, driven by Azure’s ongoing momentum and underscoring the strong demand for AI services. CEO Satya Nadella said, “we will increase our total AI capacity by over 80% this year, and roughly double our total data center footprint over the next two years, reflecting the demand signals we see.” CFO Amy Hood reiterated that the company expects to be capacity constrained through at least the end of the fiscal year, and will continue to increase “investments in AI across both capital and talent to meet the massive opportunity ahead.”
Alphabet delivered their first ever quarterly revenue of $100bn, with revenue growing 16% Y/Y and accelerating double-digit across Search, YouTube, and Cloud. CEO Sundar Pichai said the company is “seeing AI now driving real business results across the company,” and are “excited about our roadmap.” Alphabet raised full-year capex guidance to $91-93bn, and expects a significant increase again in 2026; driven by continued tight supply. Looking forward, Alphabet is well positioned to capitalize on the expansion of AI across its ecosystem.
Apple reported 8% revenue and 13% EPS growth, supported by better-than-expected iPhone sales and record sales in Services. CEO Tim Cook cited strong demand for the iPhone 17, that is resonating around the world. The company guided to December quarter revenue growth of 10-12% – previously mid- to high-single-digits – alongside the “best iPhone quarter ever.” They also highlighted rising AI-related R&D costs, as they are increasing their investments in AI.
TSMC echoed the bullish sentiment, noting that AI demand continues to exceed supply. Both revenue and operating margins were better than expected. CEO C.C. Wei noted that they “are also happy to see continued strong outlook from our customers” and also received “very strong signals from our customers’ customers… Thus, our conviction in the AI megatrend is strengthening.” The chipmaker raised full-year capex guidance to the top-end and highlighted that “a higher level of capex is always going to be correlated with a higher growth opportunity.”
Infineon reported sequential improvement as inventory normalization continues. Management noted that “global investment in AI infrastructure is continuing to rise rapidly and we expect considerable growth in demand for our leading power supply solutions for AI data centers.” Accordingly, they significantly increased their outlook for AI power solutions. Given the strong AI infrastructure growth outlook, we expect AI power to continue to drive Infineon’s growth beyond 2026, alongside a recovery in auto/industrial semis.
Across the tech space, we saw better-than-expected results with AI infrastructure spending continuing to surge. This quarter marked the largest sequential increase in cloud capex; illustrating how the race to build AI capacity has become a defining feature.
Financials: Rebound in Capital Markets Activity & Stable Credit Quality
The financial sector delivered solid performance driven by a boost in capital markets activity, as well as a favourable trading environment. Analysts kept a close eye on the health of the consumer and credit quality, which held up well. Reassuringly, J.P. Morgan’s CEO Jamie Dimon noted, “the consumer is resilient, spending is strong, and delinquency rates are actually coming in below expectations.”
Goldman Sachs beat expectations on both revenue and earnings. Investment Banking fees rose 42%, with deal backlog at its highest level in three years. CEO David Solomon said that there is a renewed momentum with corporates who have “shifted their focus back to long-term and strategic decision-making, particularly amid a more supportive regulatory environment.” He highlighted that they expect 2026 to be an even stronger year for M&A and see a very constructive environment.
Blackstone reached a new AUM record ($1.24tn), supported by strong inflows of $54bn for the quarter. Management noted a resurgence in capital markets activity and IPO pipeline with COO Jonathan Gray highlighting that “the deal dam is finally breaking, and we have a bunch of secular tailwinds driving us forward.” He further added, “our IPO pipeline for the next 12 months, if converted, would translate to one of the largest years of issuance in our history.” Blackstone also pointed to strength in data centers, reporting that in their portfolio in Q3, they “saw a doubling in their leasing pipeline globally versus Q2”; reflecting surging AI infrastructure demand.
HSBC traded higher after reporting better-than-expected results and upgrading guidance. HSBC plans to temporarily pause buybacks while finalizing the Hang Seng Bank privatization, after which it will restore buybacks and maintain capital targets. Management reiterated confidence in wealth management growth, favourable deposit trends, and stable credit losses.
ING Bank reported another strong quarter, with loan growth of 7% and deposits up 6%. Net interest income and mortgage portfolio growth exceeded expectations. Management raised their ROE and total income outlook, and guided expenses to the low end of the previous range. As part of the upgraded outlook, management announced a €1.6bn shareholder distribution, down from €2bn and aligning with their higher CET1 ratio target – as a higher CET1 ratio requires more capital to be retained.
Visa delivered solid results with double-digit revenue and EPS growth. CEO Ryan McInerney highlighted that U.S. consumer spending strengthened across retail, travel and fuel. He also noted that the highest-earning consumers are increasing spending the fastest. Visa raised guidance to low-double-digit revenue and EPS growth, and increased quarterly dividend by 14%.
Consumer Goods: Brand Power and Pricing Resilience
Consumer-facing companies showcased their ability to push pricing and still achieve volume growth. Some companies lowered their tariff-related costs as trade negotiations led to moderation and more certainty in tariff costs. The consumer remains resilient, but there is a bifurcation in income groups with the lower-income cohort under more pressure.
Unilever’s sales update showed 3.9% underlying sales growth, driven by 1.5% volume and 2.4% price increases. Outlook was confirmed, expecting growth in the second half to outpace the first half, accompanied by margin improvement for the full year. CEO Fernando Fernandez noted that they “see a clear bifurcation in the [U.S.] market between households that own stocks and households that don’t own stocks.” Resulting in resilience in their premium portfolio in the U.S. where they continue to deliver significant volume growth. In China, while the market remains subdued, there is an improvement. The ice cream demerger is expected to be completed before the end of the year, where shareholders will receive one share in the Magnum Ice Cream Company for every five Unilever shares, they hold.
Philp Morris reported solid revenue growth and double-digit EPS growth, and also raised their EPS guidance for the full year. Smoke-free products grew 16.5%; driving operating margins to the highest in almost four years. Management highlighted that they are on track to exceed their 2024-2026 growth targets. CEO Jacek Olczak noted increased inventory in Zyn nicotine pouches, after experiencing several quarters of supply constraints, and emphasized scaling U.S. production and expanding its distribution network in Europe and Asia.
Nike shares rallied after results exceeded expectations, benefitting from improved wholesale execution and inventory normalization. CEO Elliott Hill reiterated commitment to the “Win Now” strategy, focusing on product innovation and wholesale growth. Tariff-related costs remain a headwind, but the company maintained guidance and expect a sequential margin recovery in 2026.
LVMH delivered a better-than-expected sales update; marking a return to positive revenue growth, with all divisions performing ahead of consensus. Management acknowledged that while the environment is still challenging, there are pockets of improvement. Chinese demand accelerated, supported by improving domestic sentiment and rising tourist activity. LVMH also recently announced the opening of a new store in Beijing, China – a sign of confidence in the region.
Diageo’s trading update disappointed the market as management lowered guidance due to softer U.S. tequila demand and weakness in China. Interim CFO Deirdre Mahlan noted that they are seeing consumers trade down, and a shift in the way and where consumers are drinking. Since the trading update, Diageo announced a new CEO Sir Dave Lewis – previous CEO of Tesco – who will be starting January 2026. This boosted investor, with the stock rallying over 7% on the news.
Summary and Outlook
Earnings momentum remains broad-based across technology, financials, and consumer sectors, with AI representing one of the next transformative investment themes.
3Q25 reaffirmed the global economy is on solid footing – underpinned by AI transformation, capital strength, and consumer resilience – providing a constructive backdrop heading into 2026.

October Review and Expectations for Year-End
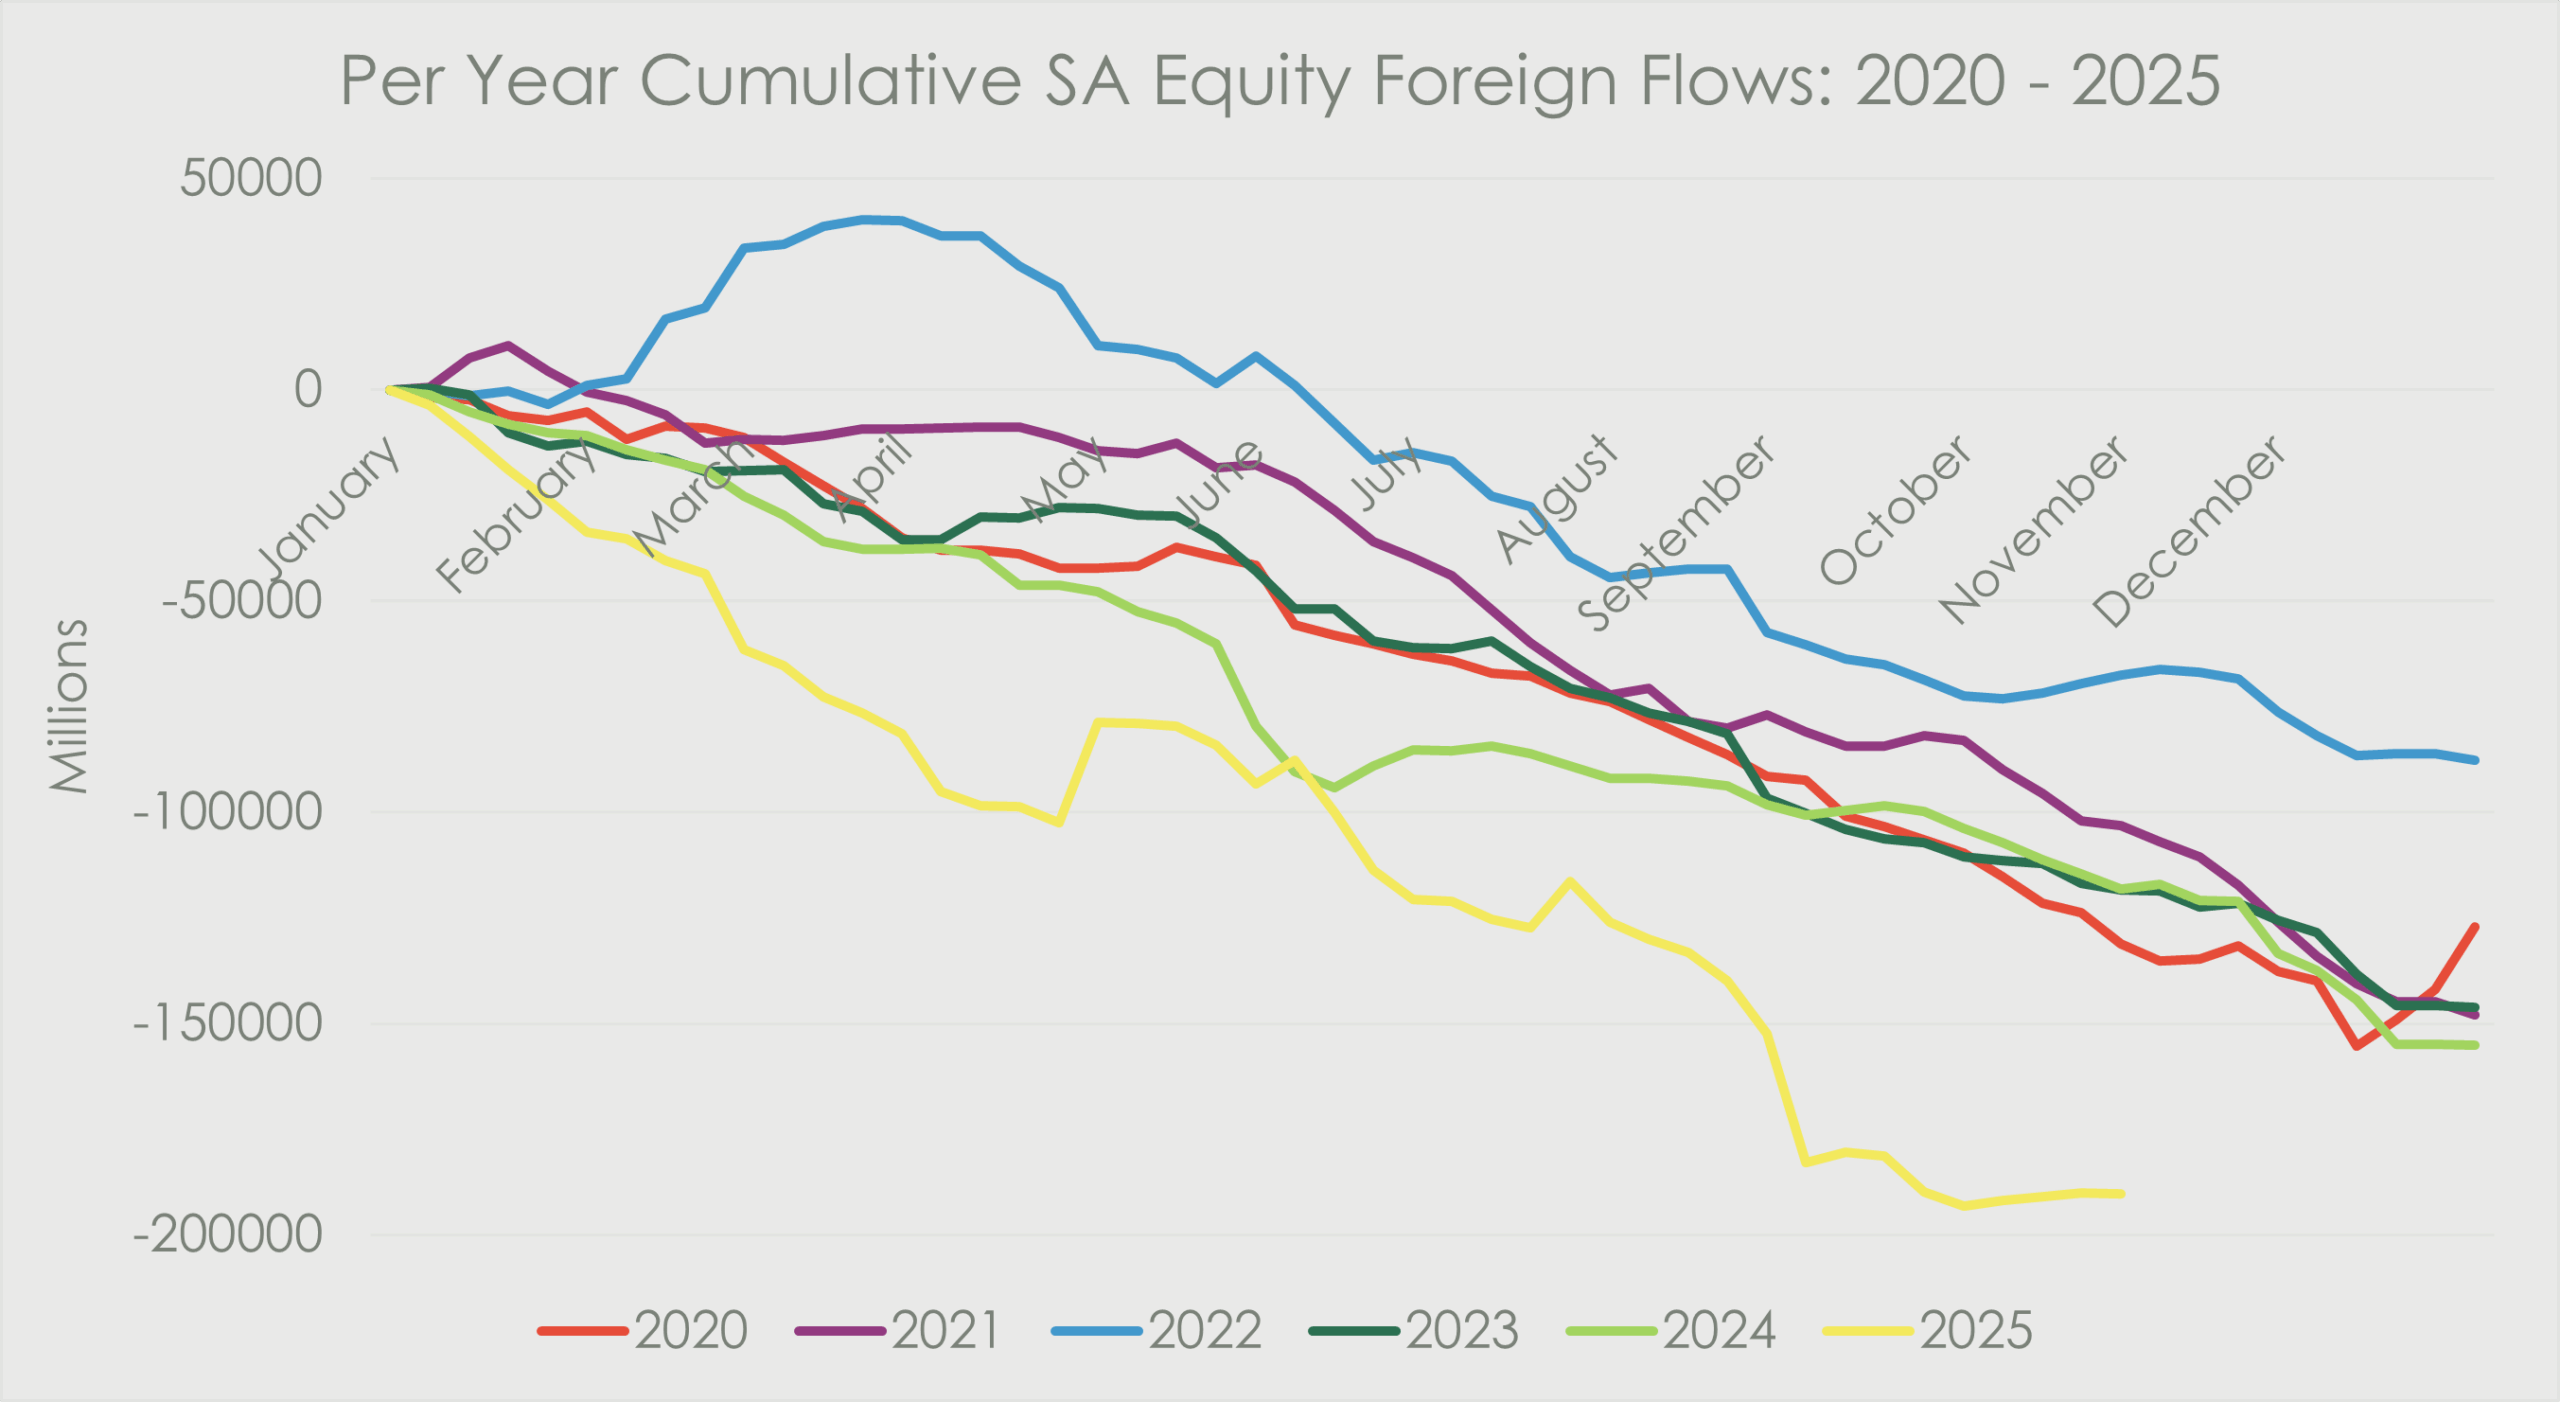
For the first time since April 2023 foreigners were net buyers of SA equities. We saw R7.3bn flow into local shares, excluding the dual-listed names. This, according to Bloomberg, represented the strongest equity flow number among emerging markets during October. Investor interest was concentrated on the banks, which saw R10.1bn in net inflows, while resources saw a net outflow. For context, we have seen a net outflow of R108bn for the year so far. In contrast to that, our bonds saw a rare monthly foreign outflow, after what has been an impressive year marked by growing foreign interest in the asset class. The annual inflow is measured at R127bn.
In economic news, on October 24th South Africa was removed from the Financial Action Task Force (FATF) grey list, which came as no surprise to the market, after a string of positive updates in the months preceding the announcement. Our progress will now be monitored over a three-year period, to ensure we maintain our momentum on the underlying governance measures.
Key Drivers to Year End
As we look toward year-end, we have a number of key data points which have the potential to impact market sentiment going into 2026.
- November 12th will see the Medium-Term Budget Policy Statement given by the finance minister.
- On the 20th of November, the reserve bank will deliver their final rate decision for the calendar year, with rate markets pricing in a 25-basis point cut which would mark the sixth of the current cycle.
- S&P will update the market on South Africa’s sovereign credit rating on November 14th, followed by Moody’s on December 5th. Economists are optimistic about the chances for an upgrade to be announced.
- Lastly, Business Confidence data is expected during November and will be significant in providing cyclical directionality in our market.
A possible headwind exists in the form of tough comparables in the 2024 fourth quarter base. Businesses will have to outperform a period with the two-pot withdrawals and rate cuts we saw in September of last year. We think this is largely in the price of the retail sector, which has so far delivered resilient trade against this backdrop.
Valuations
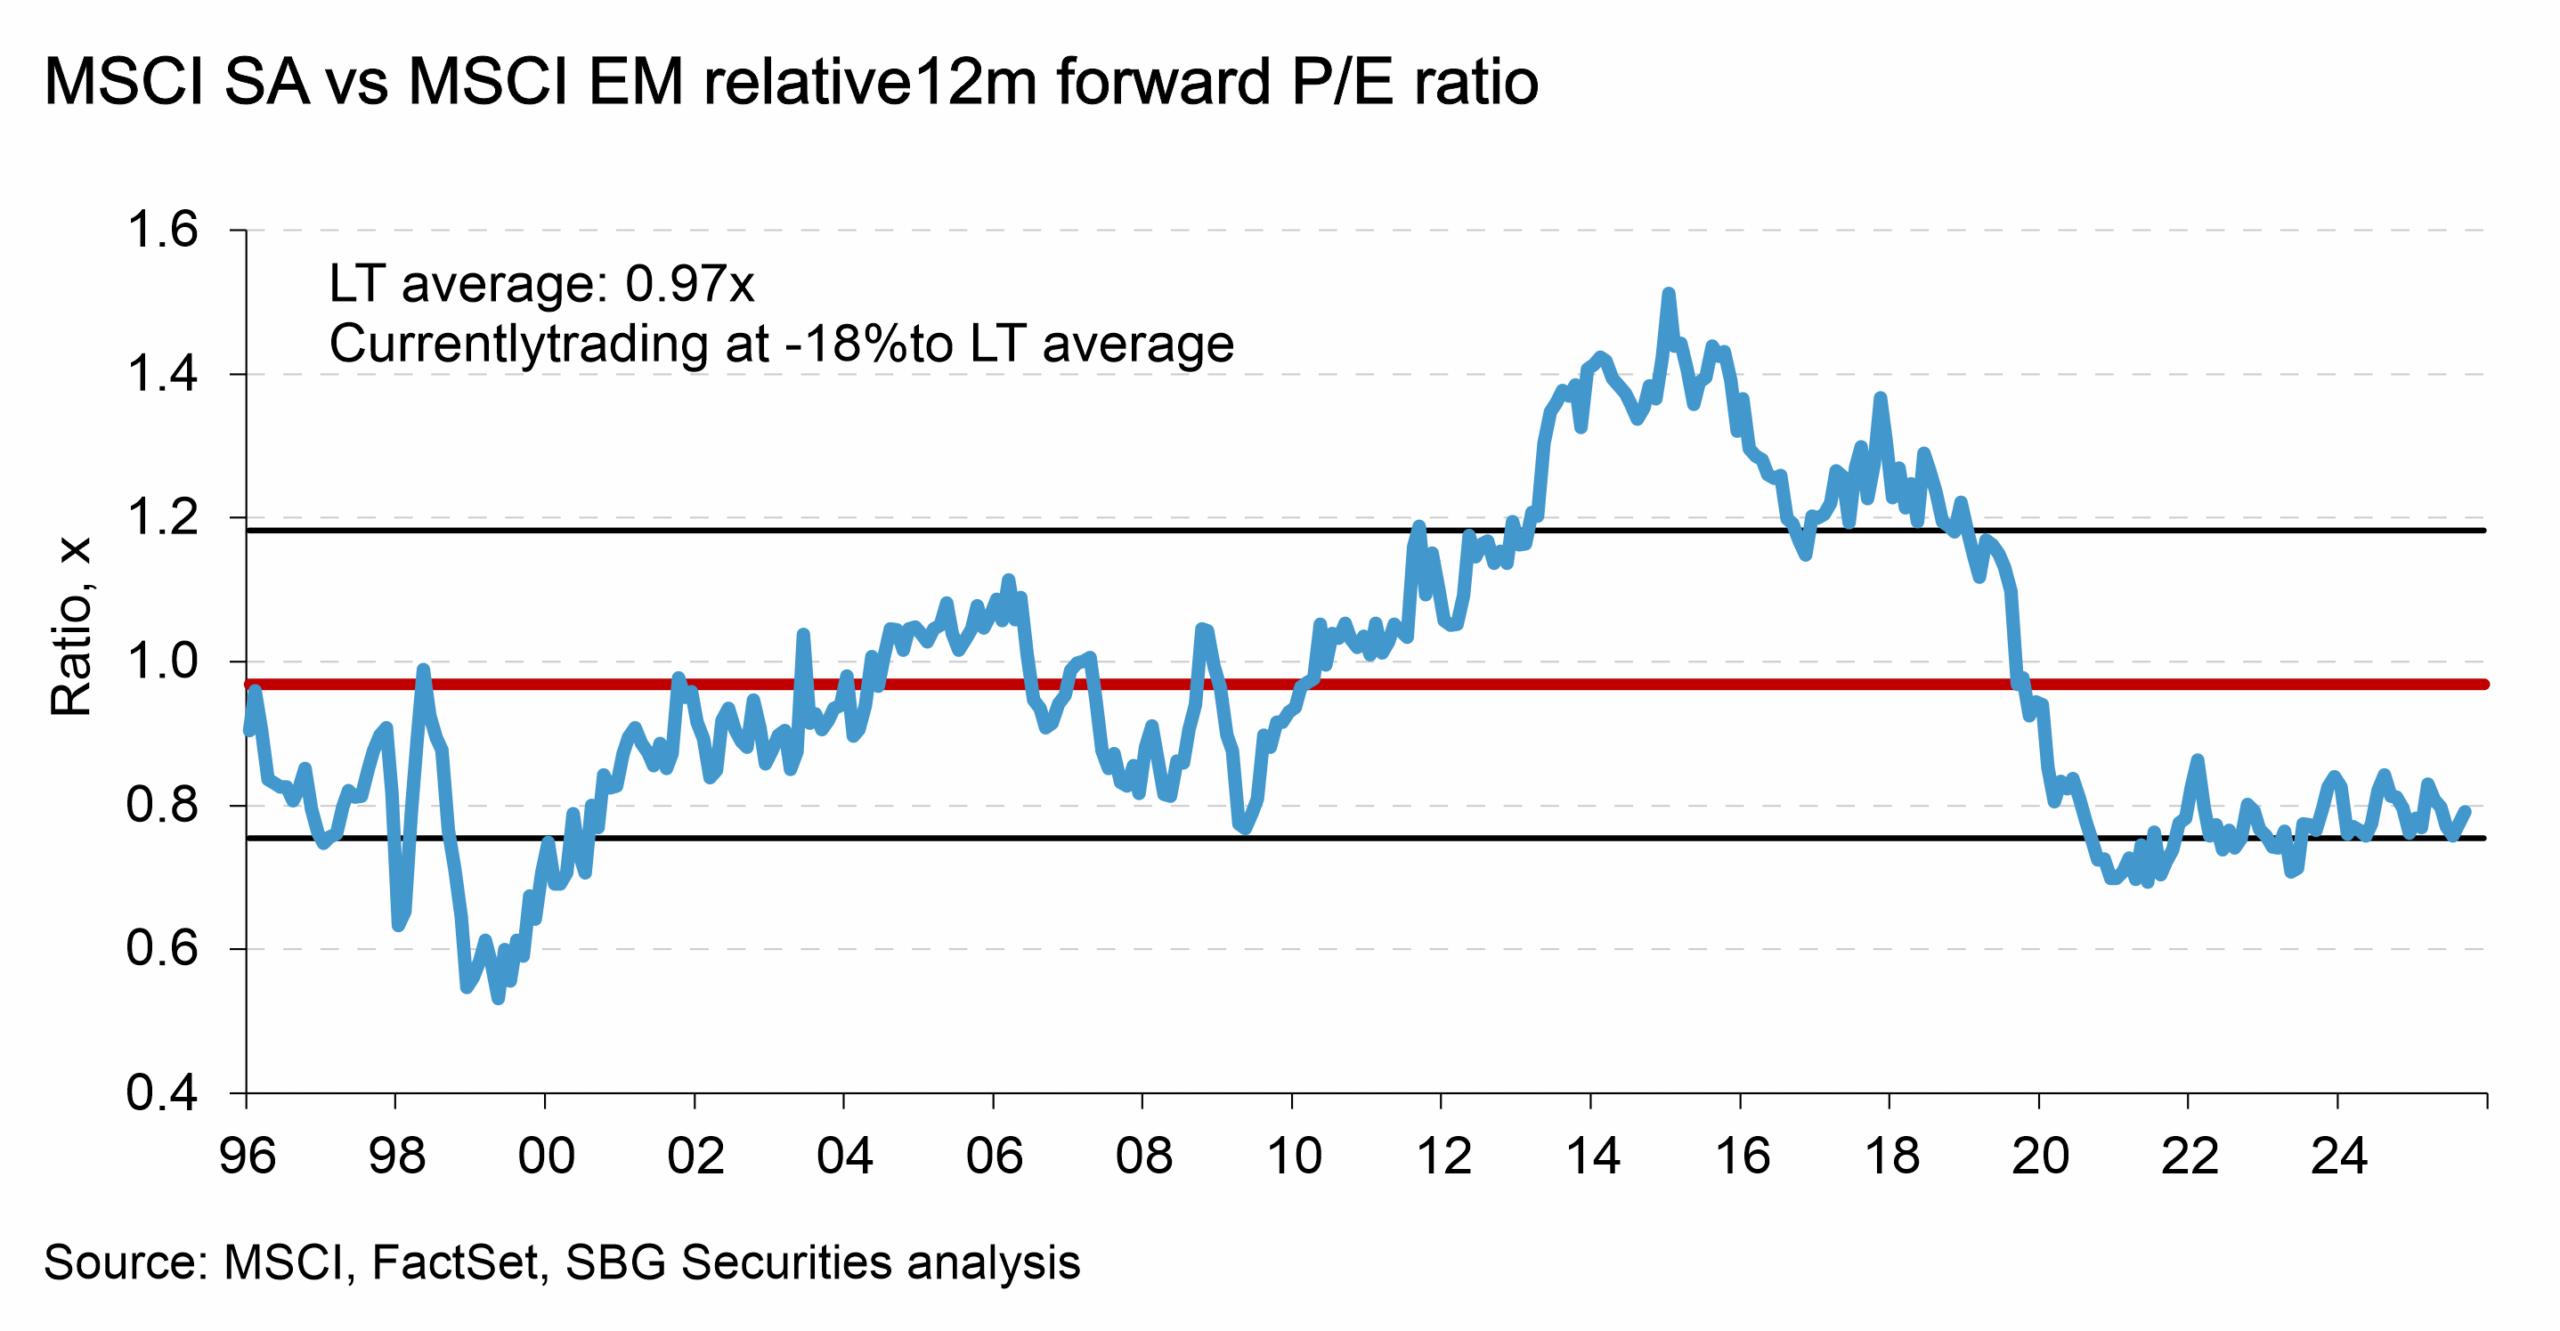
South African equities have more than doubled the performance of Emerging Markets this year, in dollar terms. Local equities still screen cheap on a relative basis
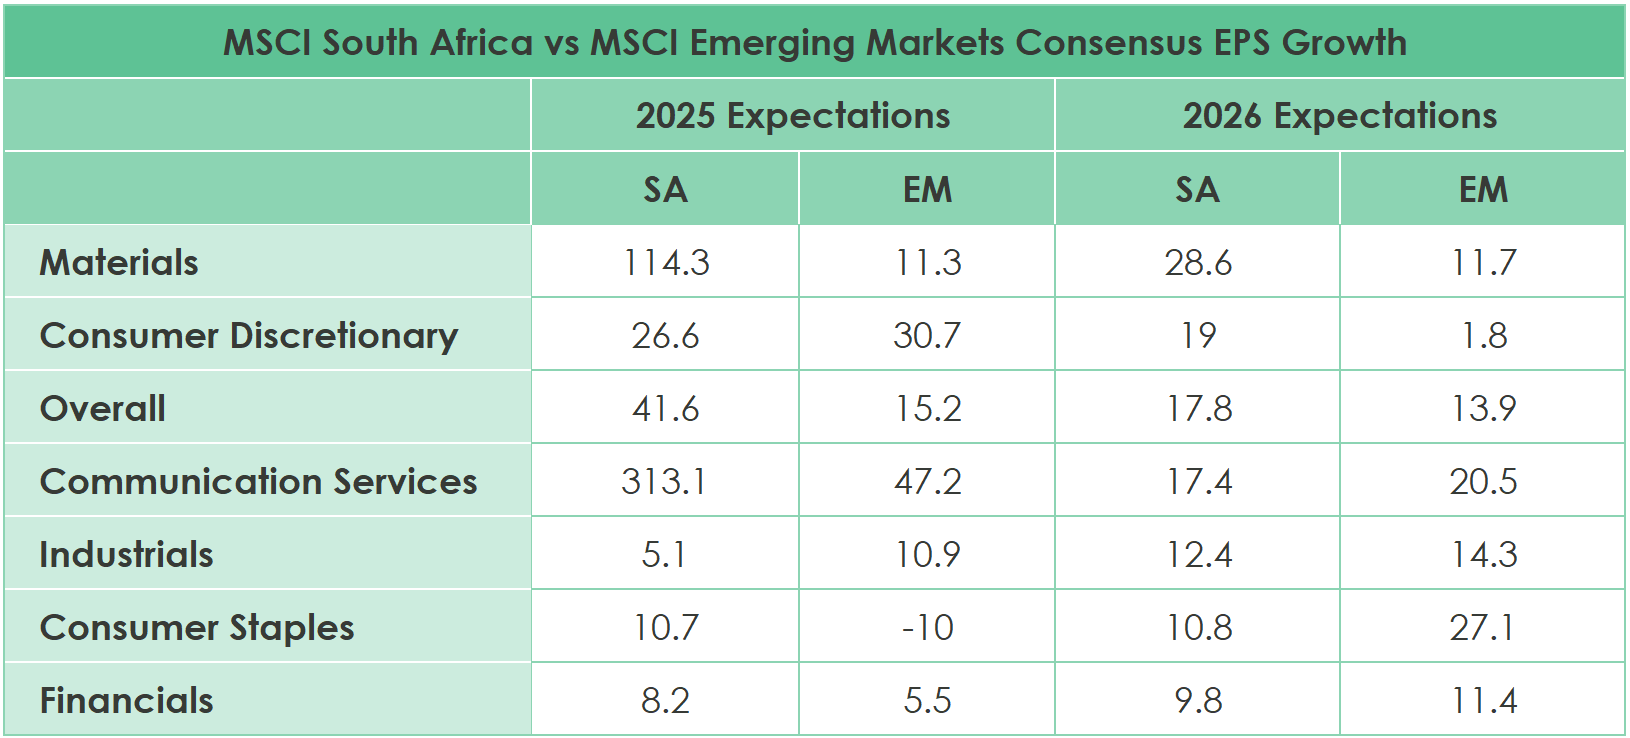
This is despite higher consensus earnings expectations among local equities for this and next year.
Conclusion
The positive equity flow picture is still nascent; South African equities remain unloved by both local and foreign investors. It is encouraging, however, that our bonds and REIT sector appear to be attracting interest and flows from both local and foreign investors.
We are seeing encouraging signs in the macro data which could be foundational to a change in investor sentiment and cause a rerating in local stocks. Green shoots are discernible among the bond proxy sectors (banks and property), but we expect a more broad-based reaction from markets, should the data come in as we anticipate.
By the Numbers
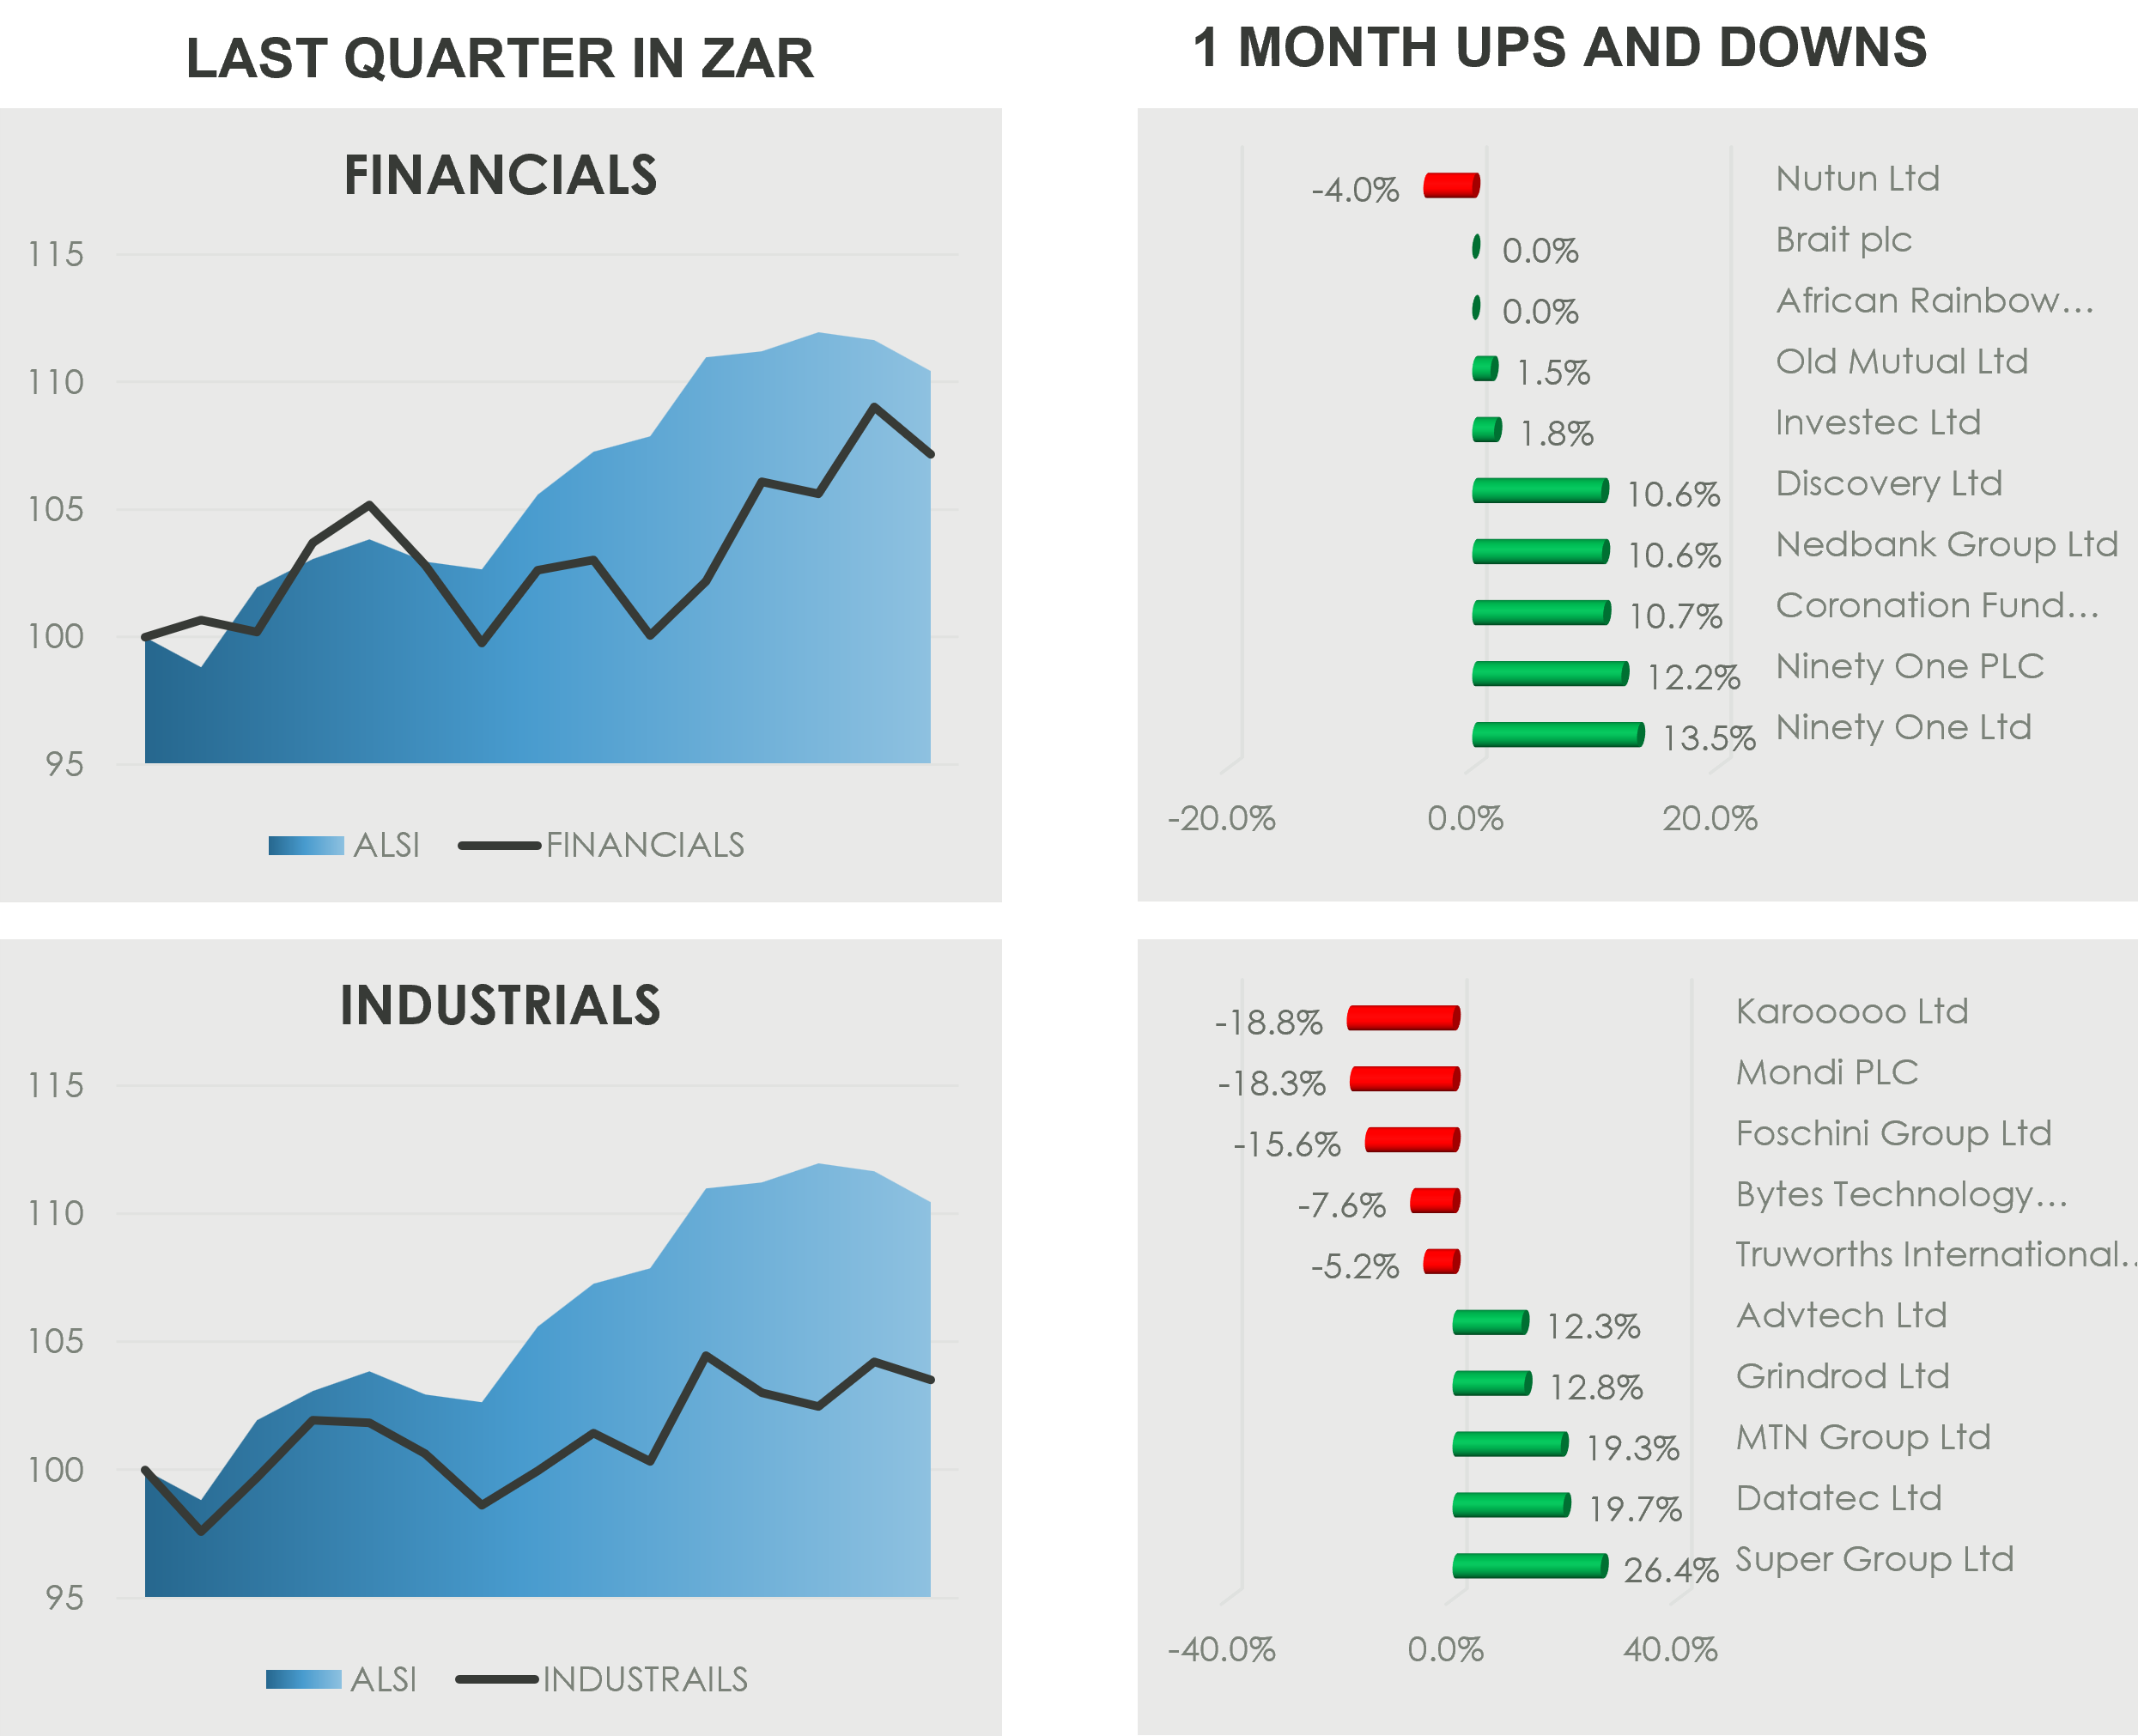
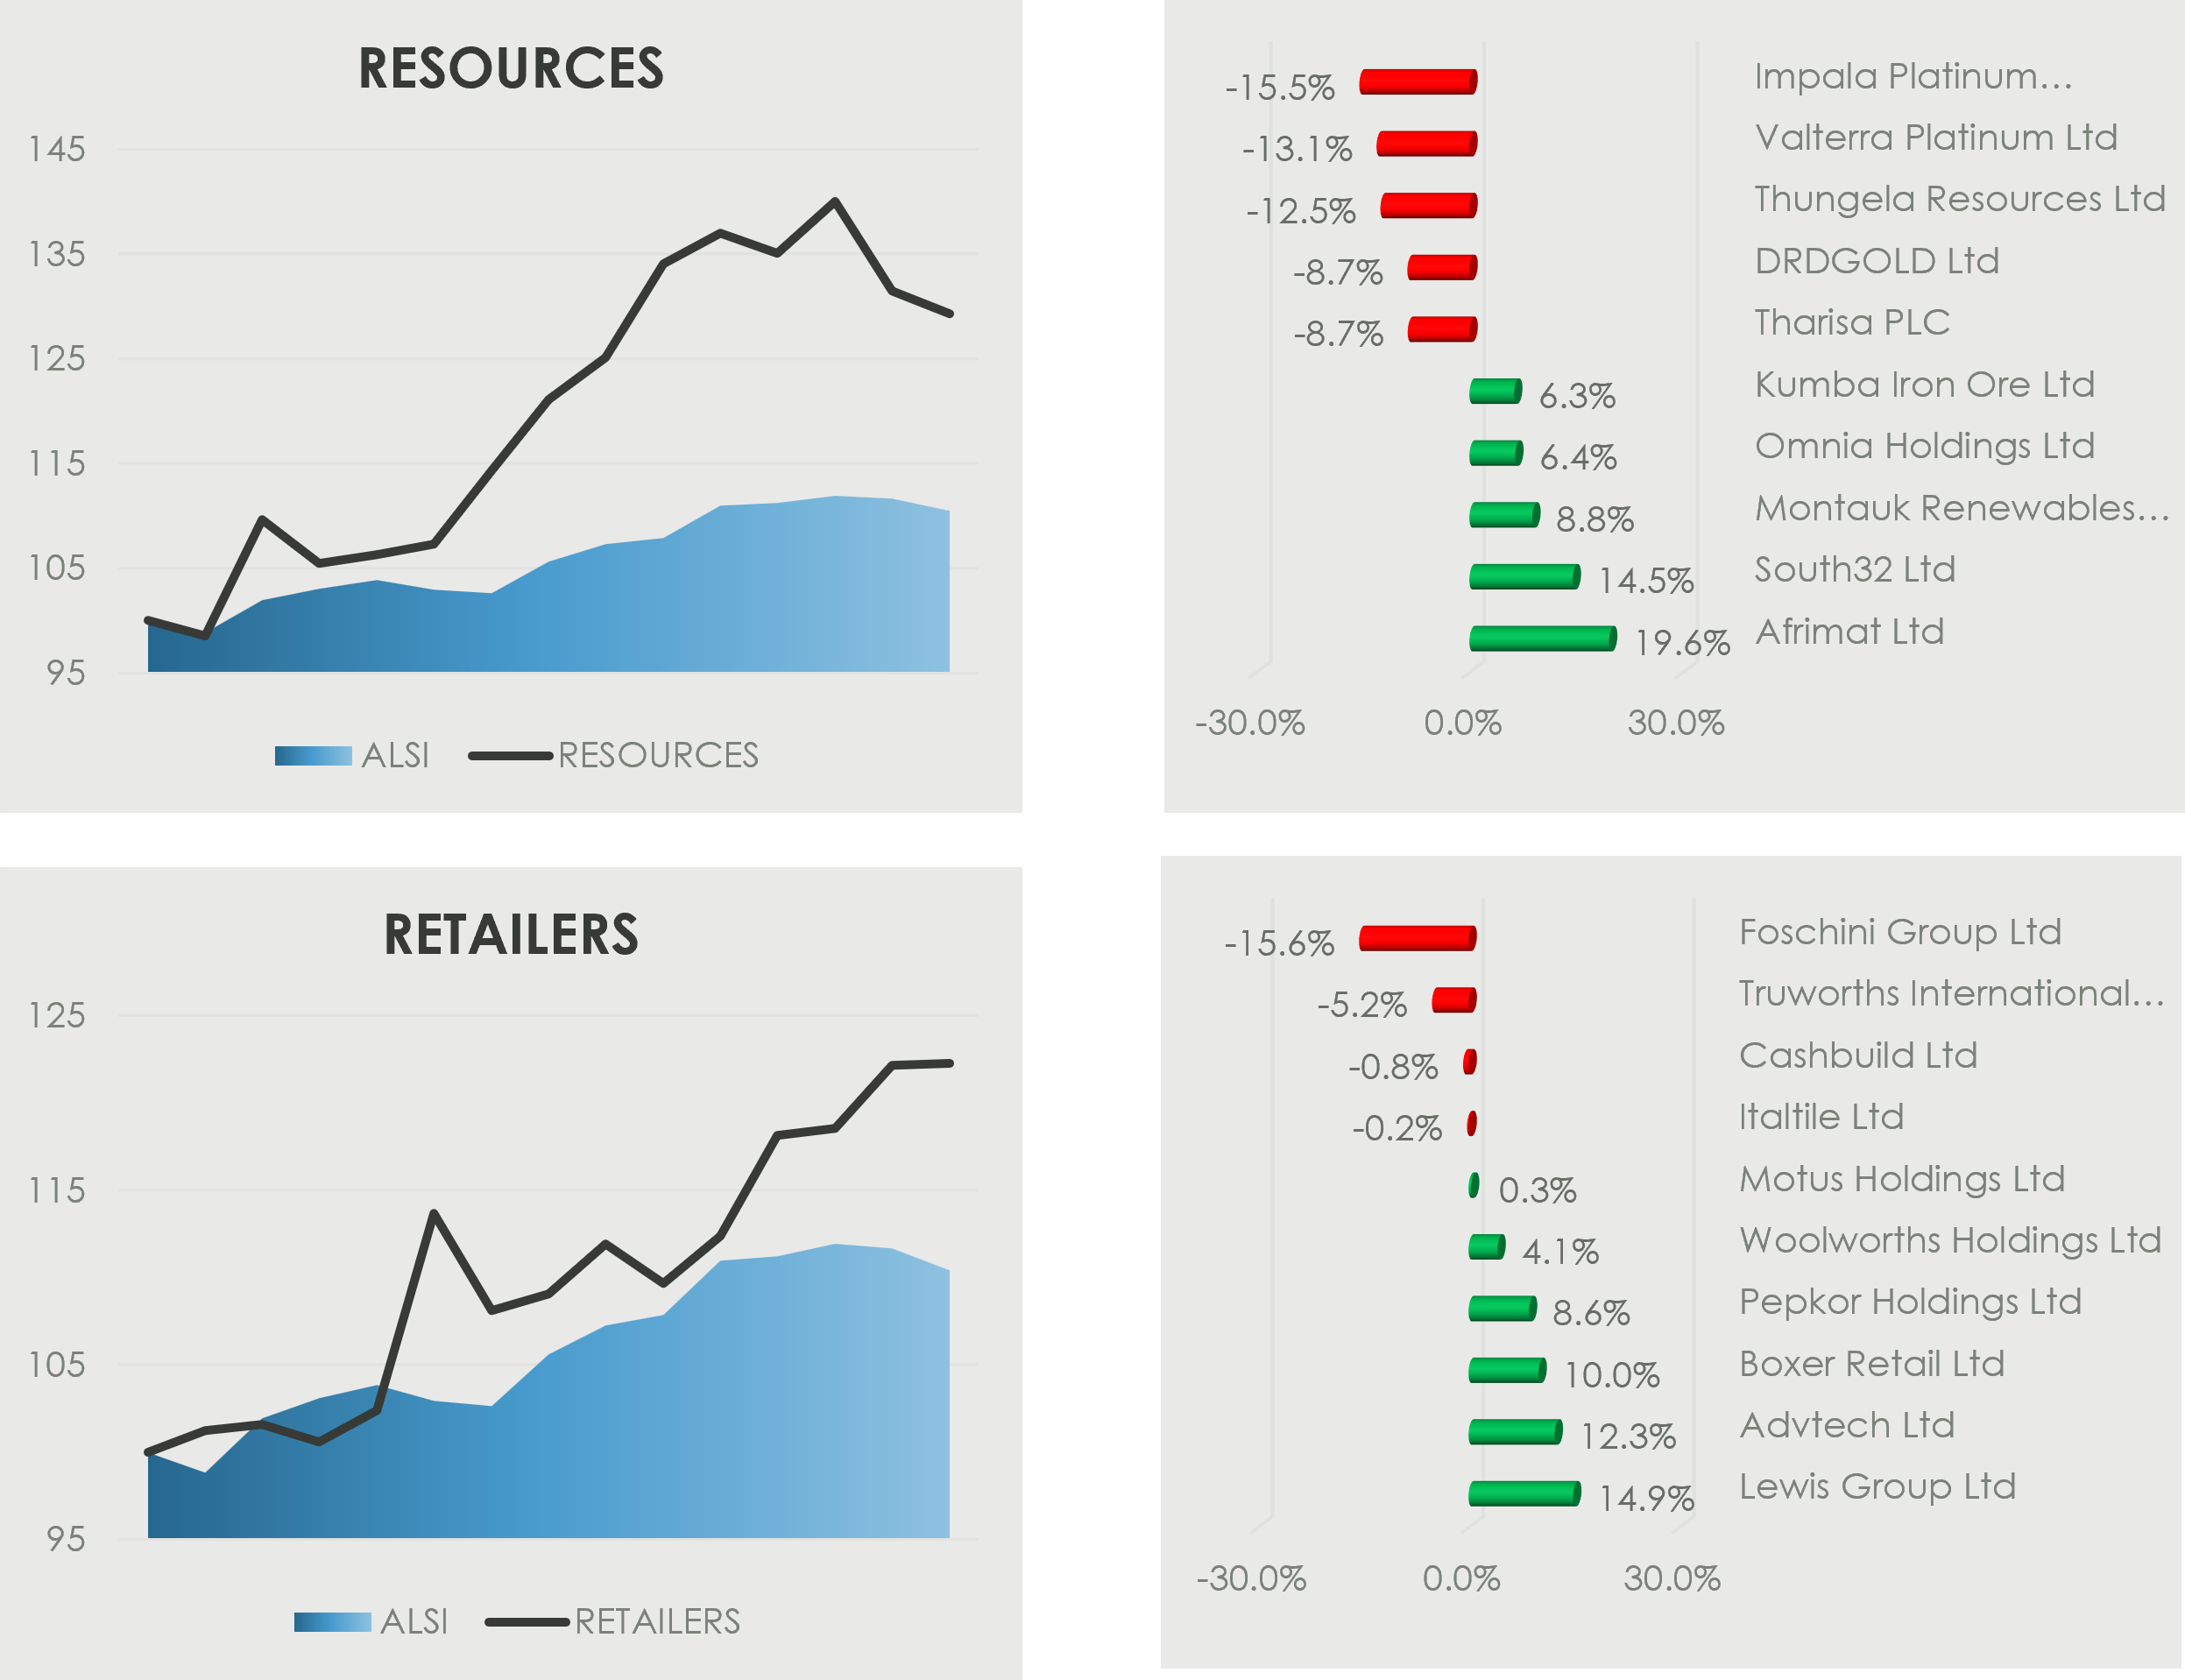
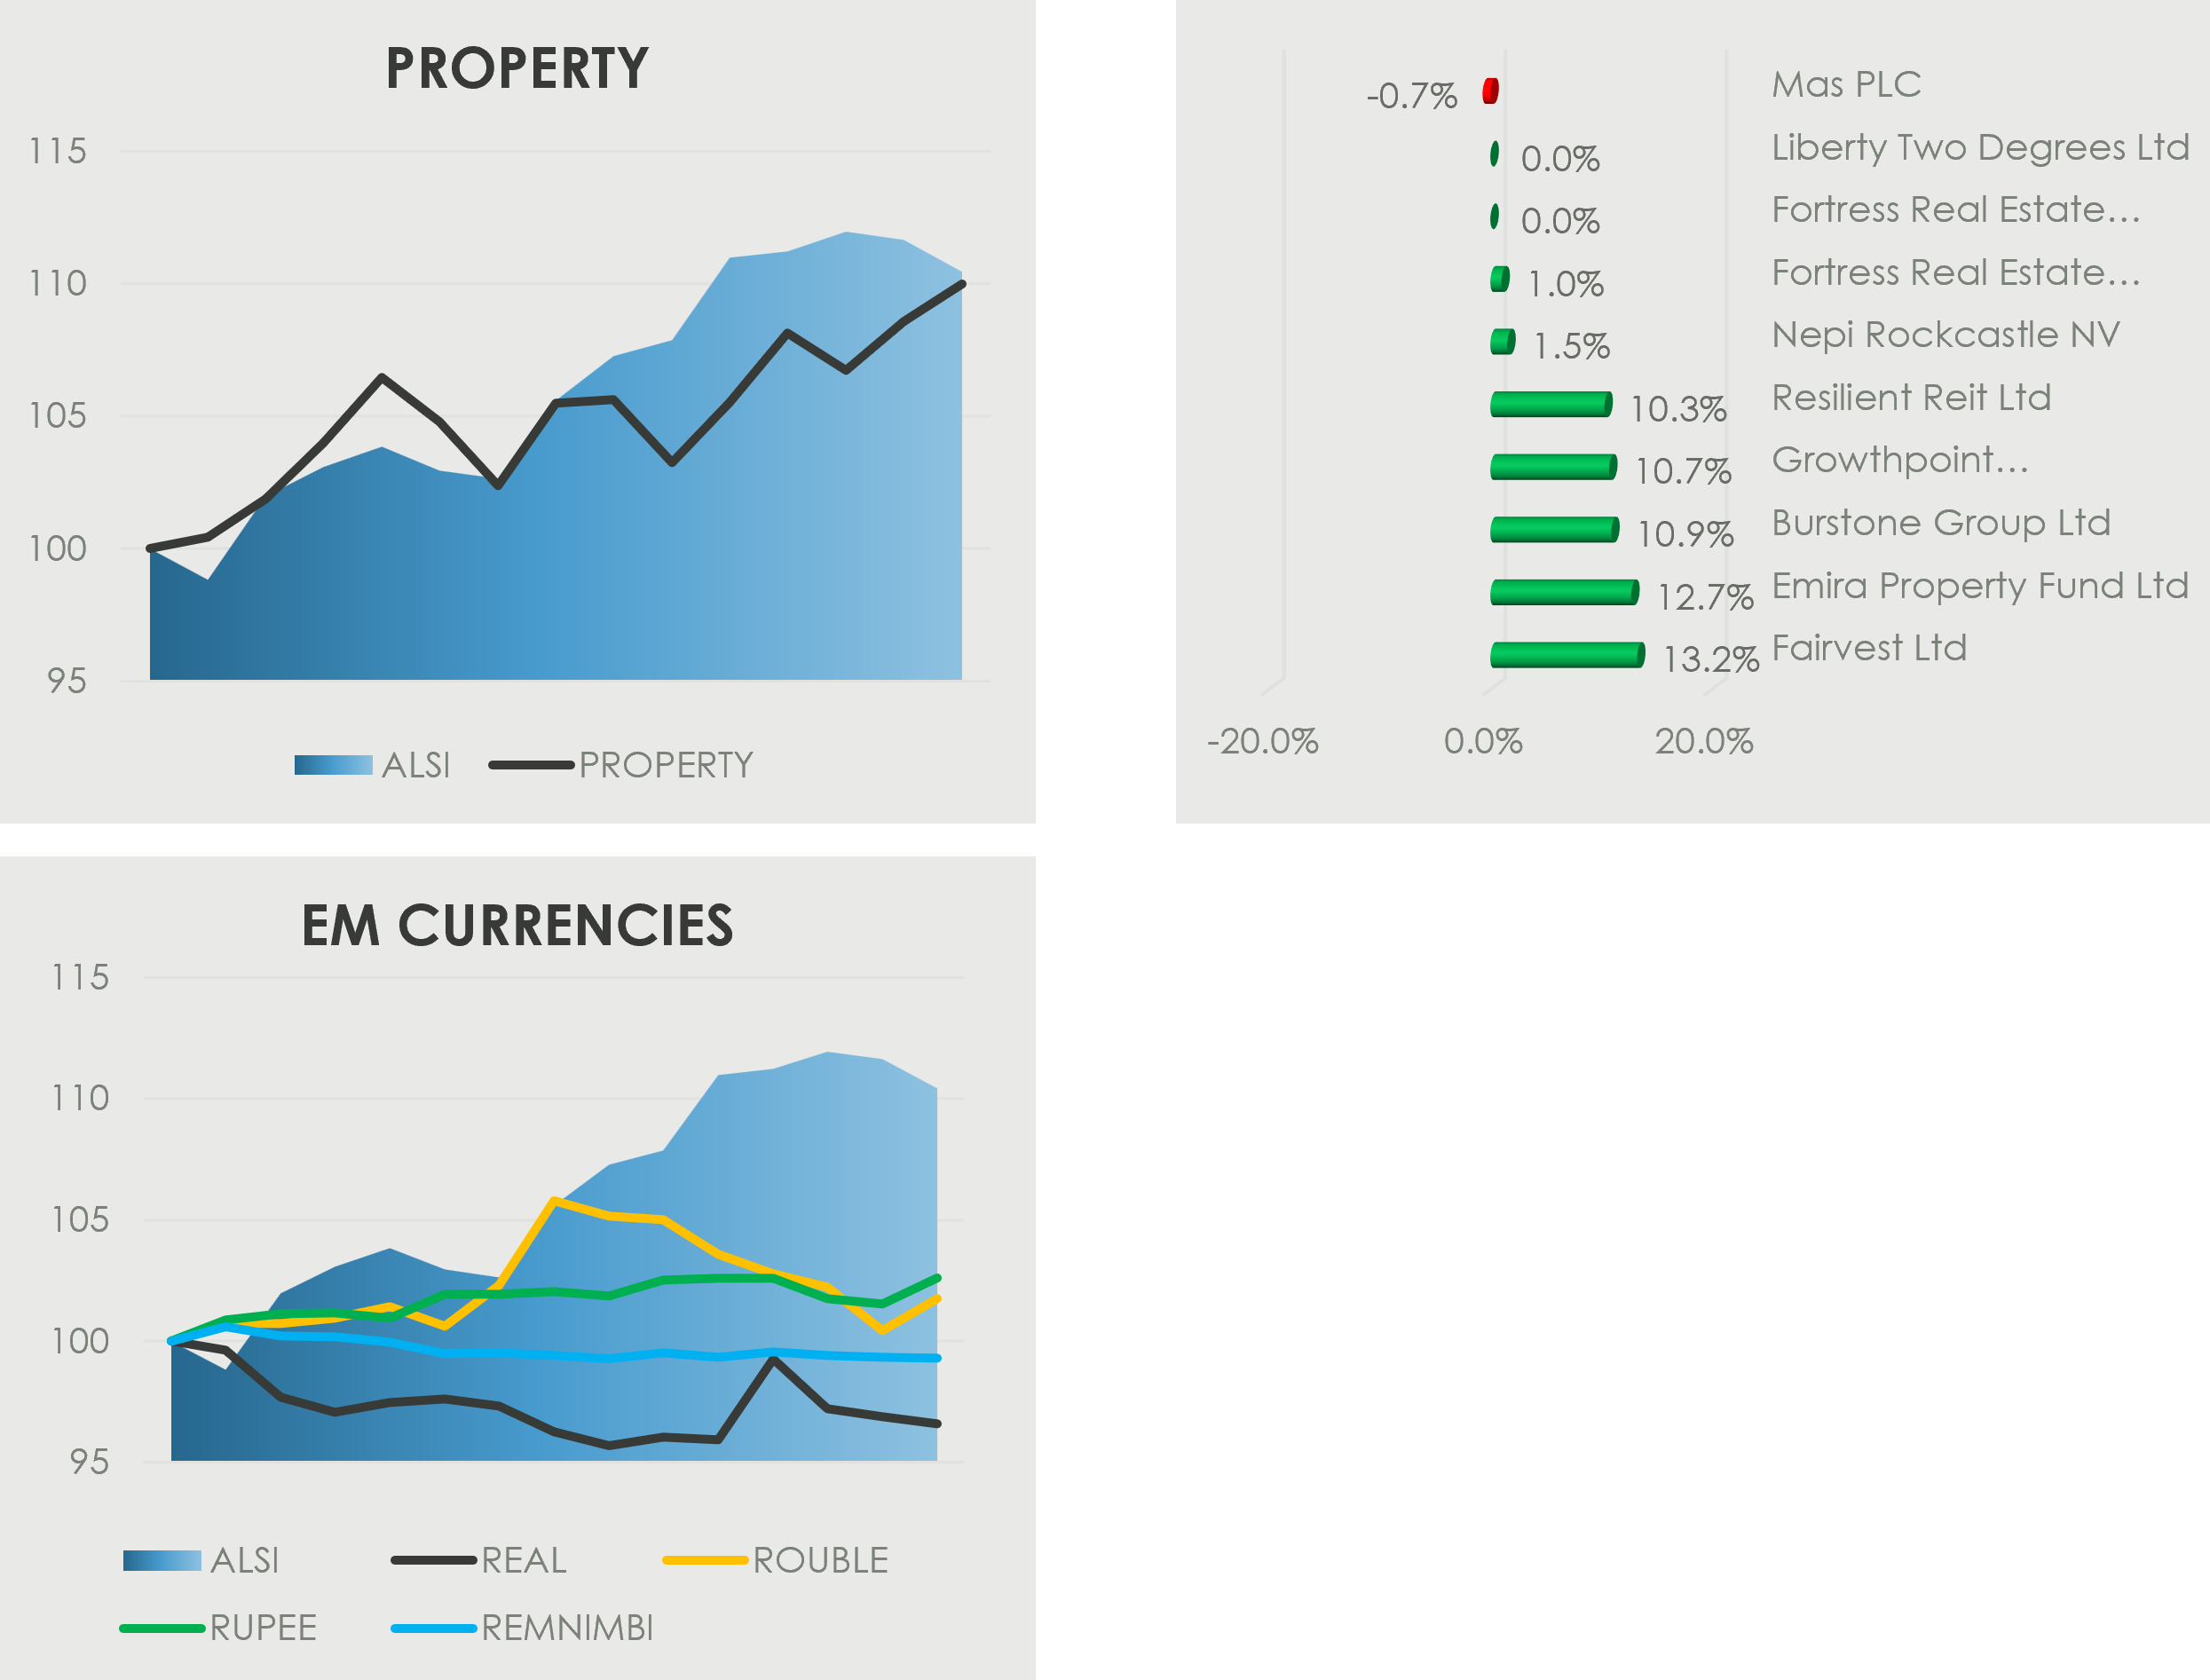
South African equities posted broad gains in October, with the ALSI up 1.2%, led by Financials (+7.3%), followed by Property (+6.3%) and Industrials (+1.5%), while General Retailers (-2.5%) and Resources (-5.4%) lagged.
Financials rebounded strongly, led by asset managers Ninety One Ltd (+13.5%), Ninety One PLC (+12.2%), and Coronation (+10.7%), which benefited from improved inflows and a firmer rand. Banks also advanced on the back of the broader SA Inc. rally, with Nedbank (+10.6%) and Discovery (+10.6%) gaining, while Nutun (–4.0%) was the only notable laggard.
Property stocks remained in favour amid ongoing improvement in sector fundamentals. Fairvest (+13.2%) led the gains, followed by Emira (+12.7%), Burstone (+10.9%), Growthpoint (+10.7%), and Resilient (+10.3%), all delivering double-digit returns.
Industrials were lifted by logistics and telecoms. Super Group (+26.4%) surged on improved sentiment following restructuring progress, while Datatec (+19.7%) rallied on strong interim results. MTN (+19.3%) benefited from better operating conditions in Nigeria, with Grindrod (+12.8%) and AdvTech (+12.3%) adding support. Karooooo (–18.8%) was the sector’s weakest performer after disappointing 1H26 results and slower subscriber growth.
Retailers were mixed but generally stable. Lewis (+14.9%), AdvTech (+12.3%), and Boxer (+10.0%) led on positive consumer trends, while Pepkor (+8.6%) and Woolworths (+4.1%) posted moderate gains. In contrast, Foschini (–15.6%) slumped after disappointing results as margins came under pressure, while Truworths (–5.2%) also softened.
Resources delivered a mixed performance. Afrimat (+19.6%) rallied on strong interim results, supported by a successful turnaround in its Lafarge cement assets. South32 (+14.5%) gained as its Australian manganese unit executed its operational recovery plan, while Montauk (+8.8%), Omnia (+6.4%), and Kumba (+6.3%) benefited from firmer commodity and energy prices.
However, PGMs and coal remained under pressure, with Impala (–15.5%), Valterra (–13.1%), and Thungela (–12.5%) all weaker on lower volumes and softer prices. Mondi (–18.3%) fell sharply after warning of weak demand and falling paper prices.
Gold miners extended recent losses amid profit-taking and lower bullion prices. DRDGOLD (–8.7%), Harmony (–7.5%), Gold Fields (–7.0%), and AngloGold (–1.0%) all retreated following strong prior-month performances.
Property Sector Still has Room to Run
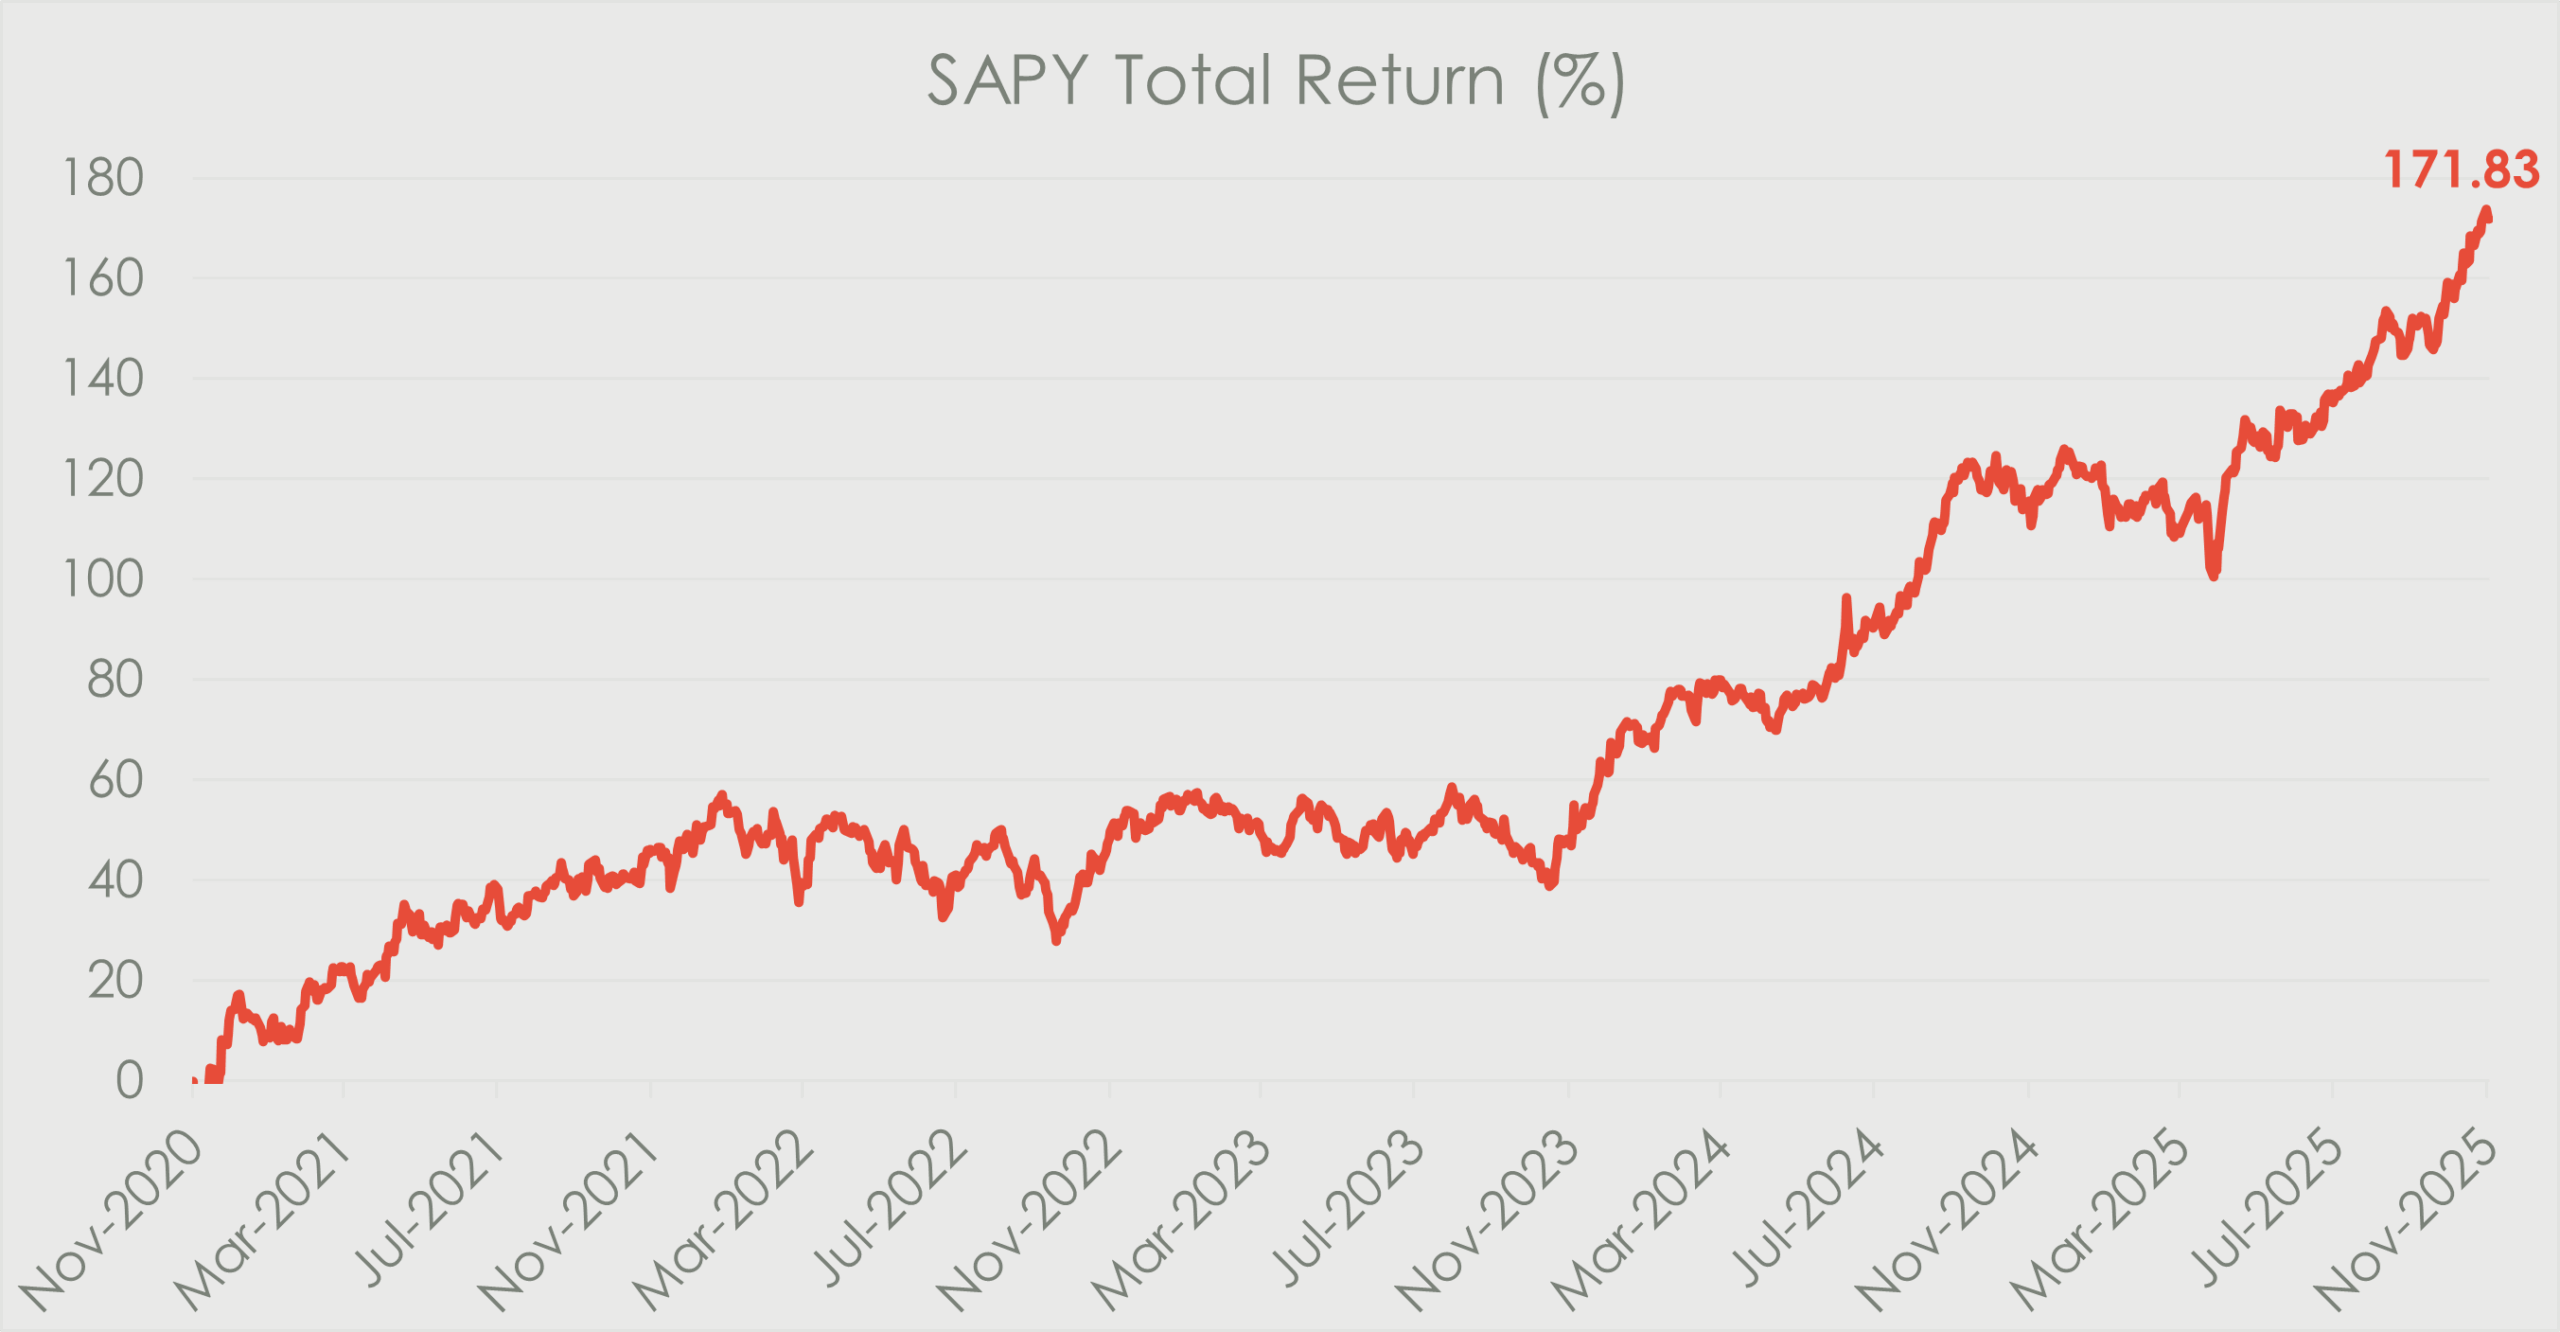
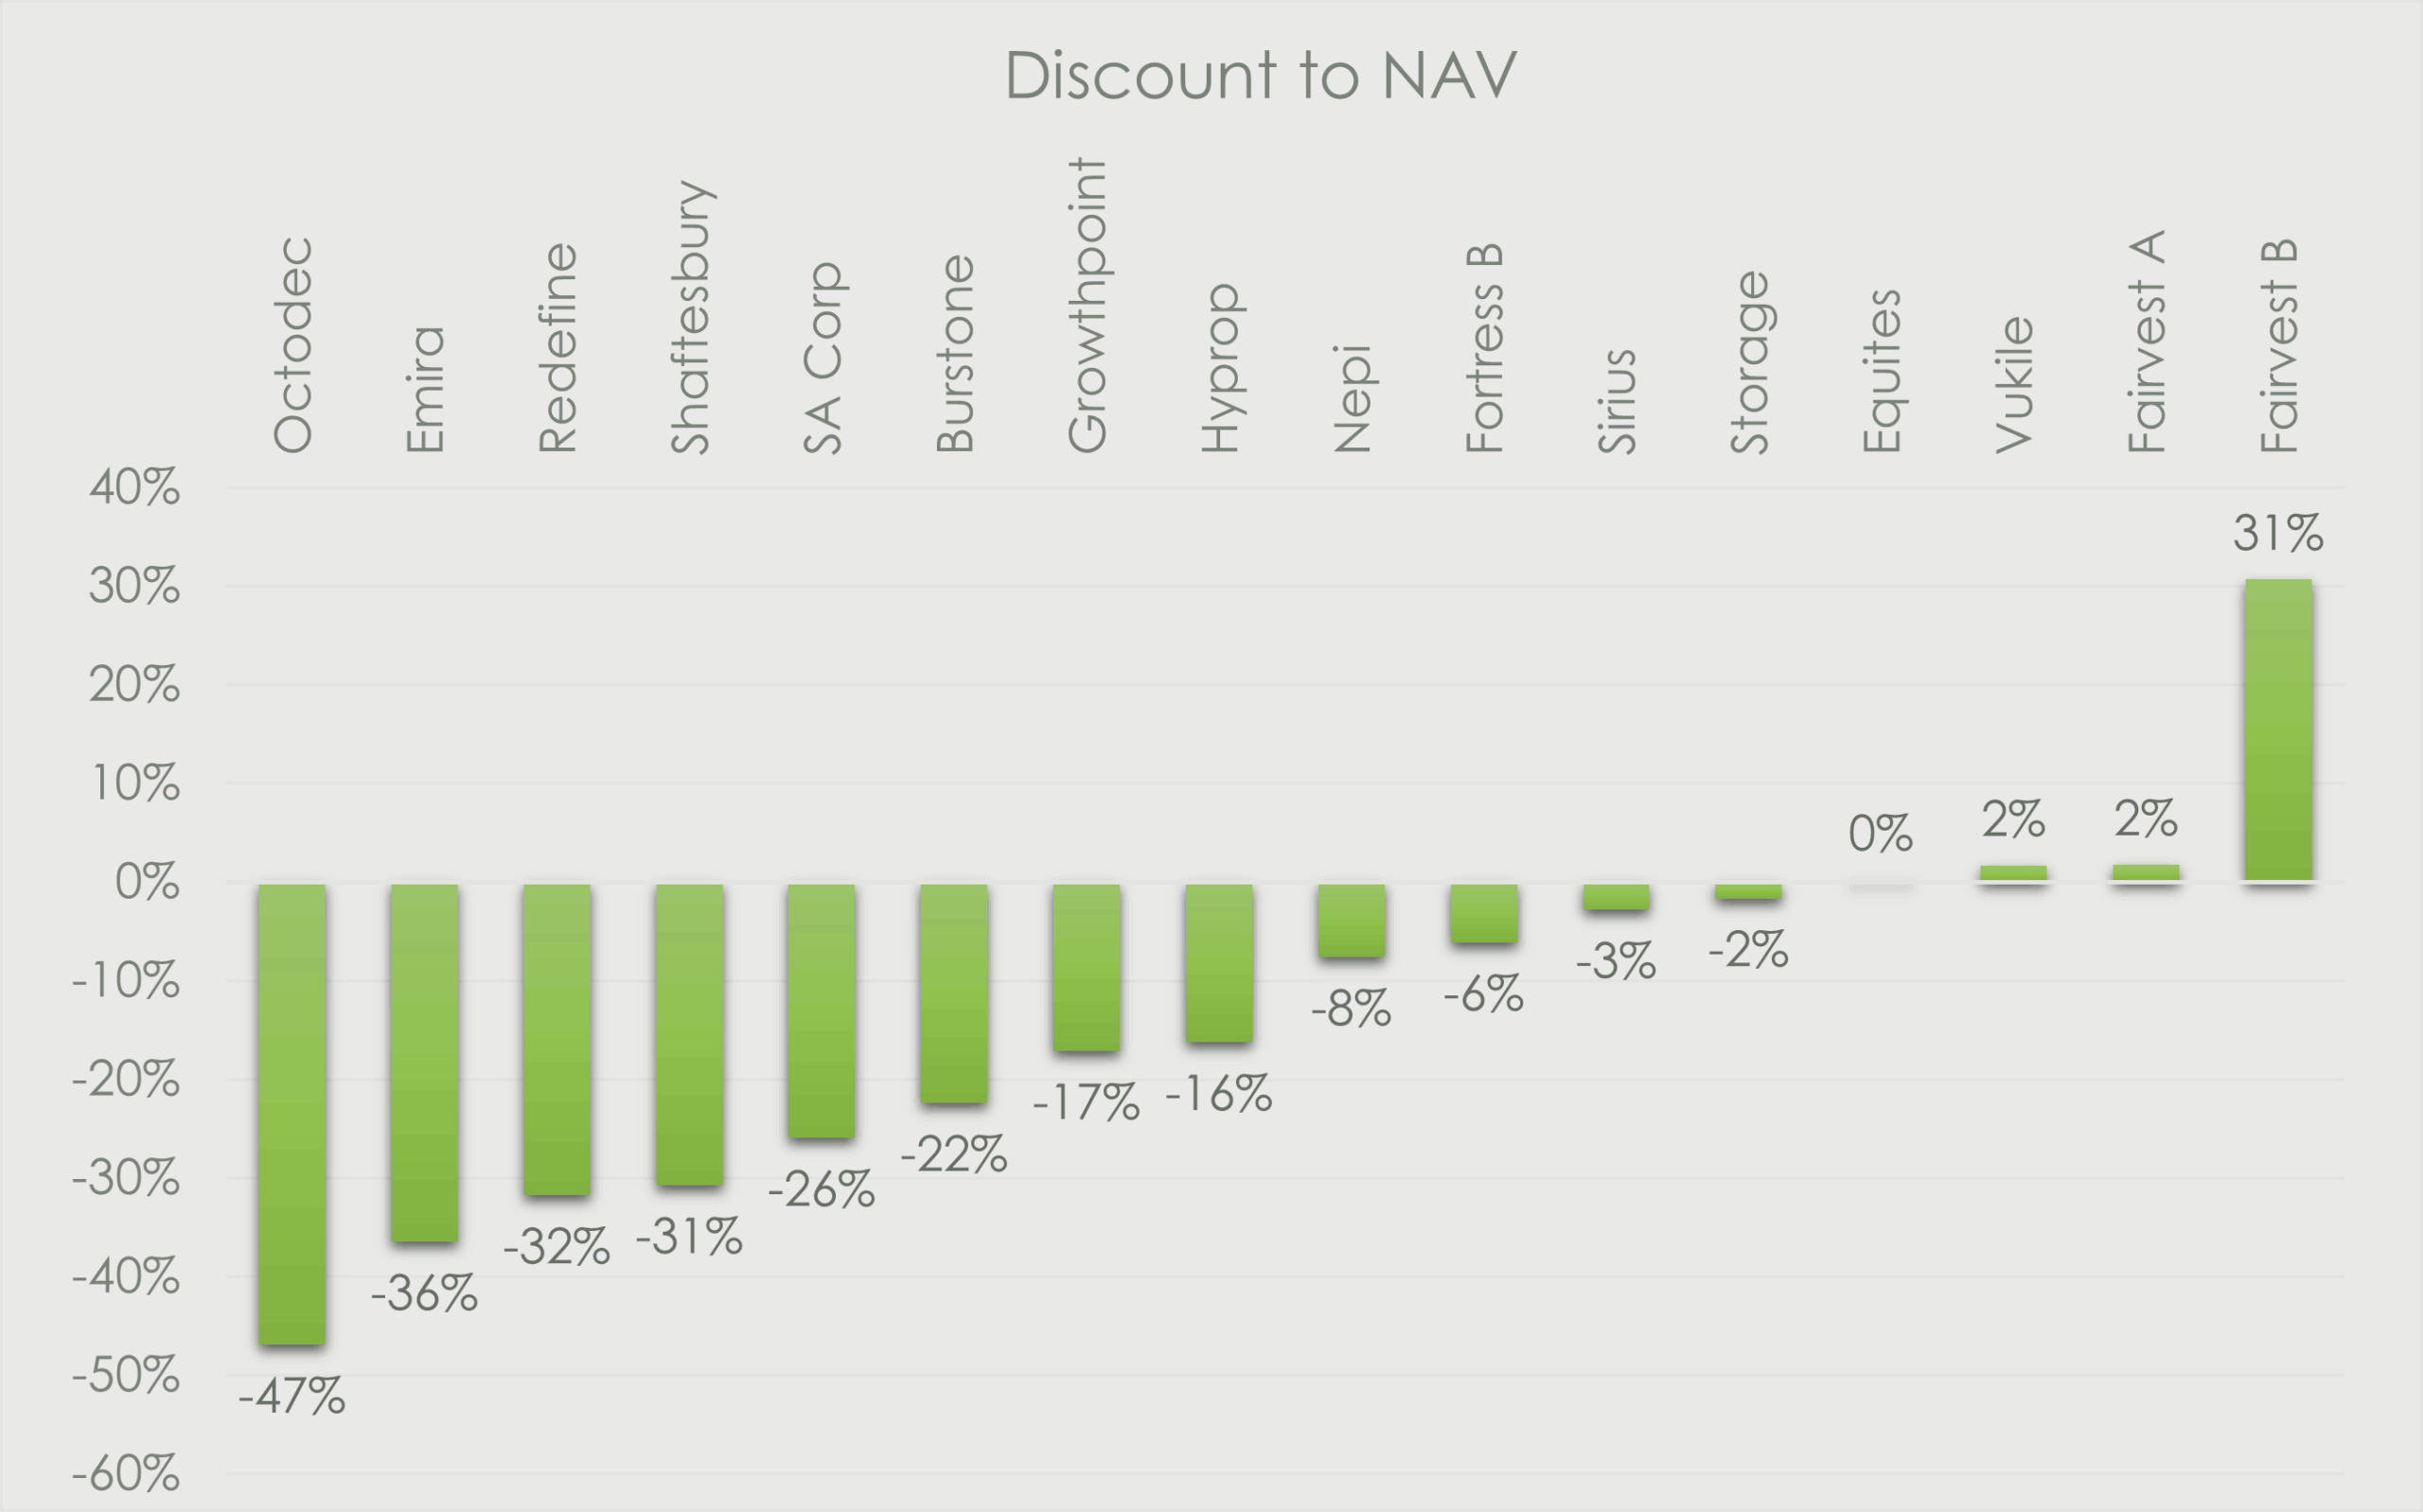
Given that the property sector provides a key point of differentiation across our suite of portfolios, we take a closer look at the sector’s valuations. The sector has performed consistently in the post-Covid period, culminating in a 25% year-to-date return in 2025, on the back of improving fundamentals.
- Balance sheets are strong, after management’s recycled portfolio exposures and a favourable rate market led to increases in asset valuations and moderating Loan-to-Value ratios (LTV’s).
- Topline growth is returning, driven by firming rental reversion trends and trading density uplift.
- Finance costs are moderating, driven by debt renewals at lower rates.
The above factors have resulted in a growth in distributions across the sector. This is something we have not seen in the last decade, and which should provide a key underpin to the return profile going forward.
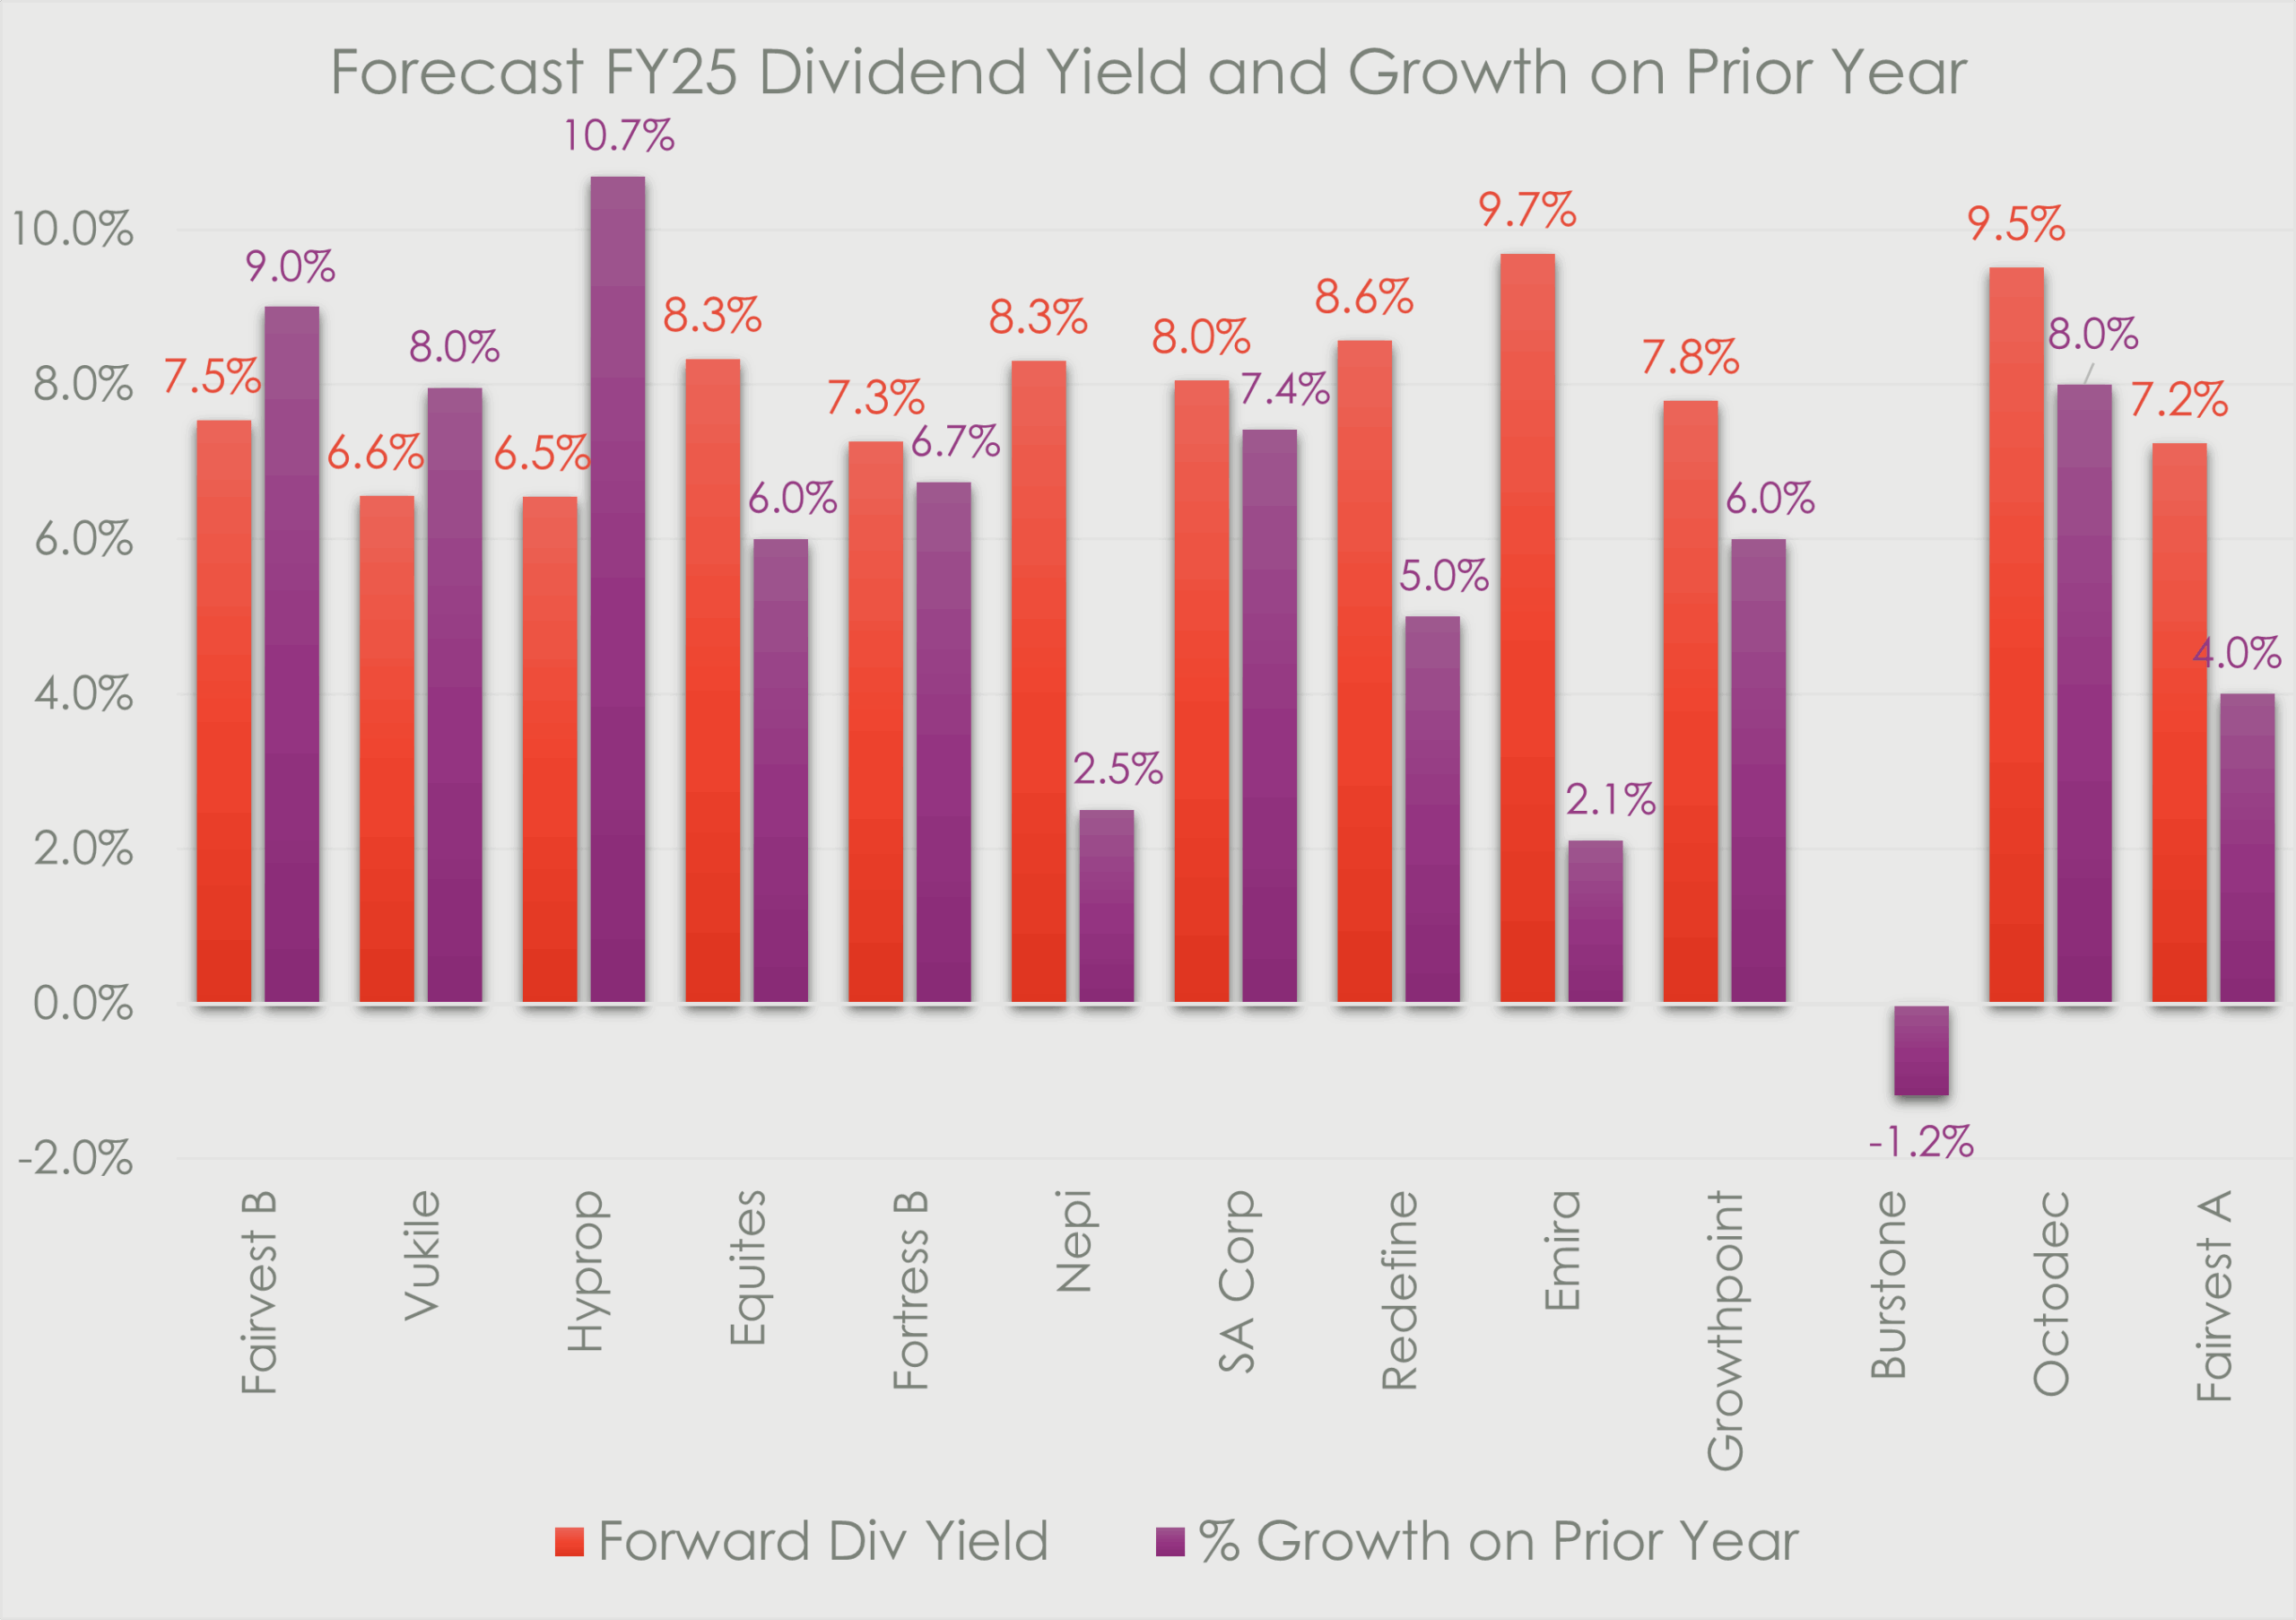
Though the sector has experienced an extended period of share price appreciation, valuations are still offering upside for investors. A combination of high single-digit yields, and mid-single digit distribution growth provides mid-teens return potential for the sector. Add to that a further compression of discounts to net asset values, and it is reasonable to pencil in a continuation of the recent 20% annual returns from the sector.