

Wind in Our Sails
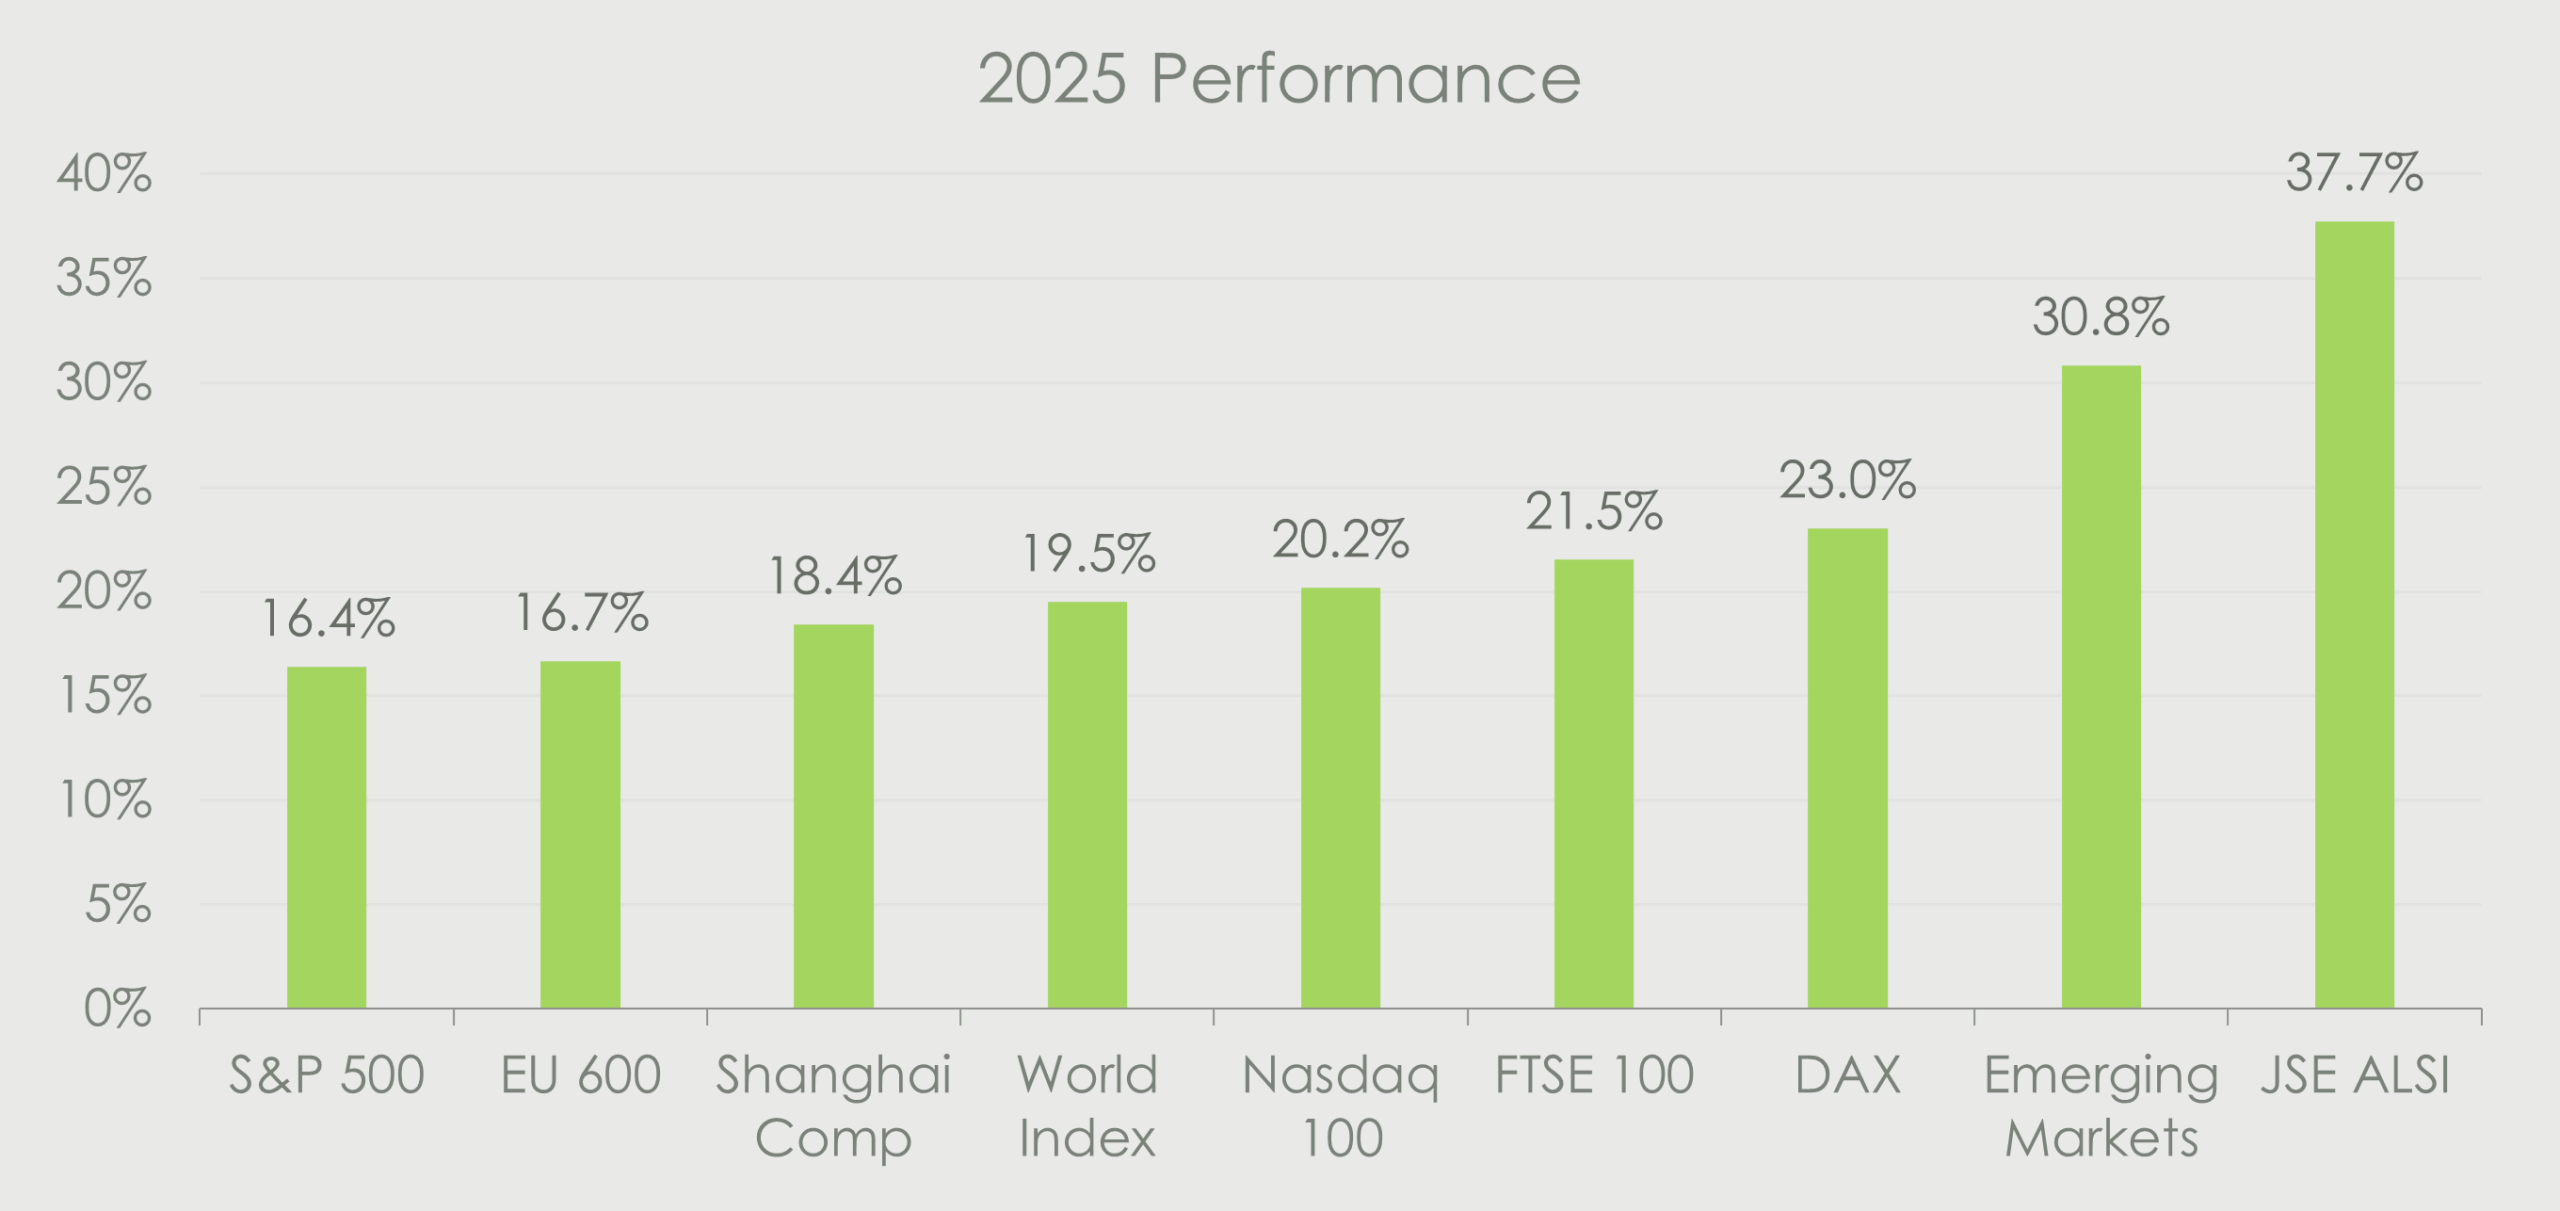
2025 marked the third consecutive year of double-digit gains for U.S. equities. The S&P 500 was up circa 17%, despite this year’s solid performance it underperformed other major markets, with the South African ALSI and the Emerging Markets leading the bunch delivering 37.7% and 30.8% respectively.
As we head into 2026, can we continue to see strong equity market appreciation?
We think we can…
From a macroeconomic perspective, numerous economic data points indicate we are still in the early stage of the economic cycle, suggesting that the environment remains conducive to strong equity market performance.

Several key data points strengthen our conviction that the economic foundation remains positive and is set to provide the tailwind to equity markets:
Benign Credit Spreads:
The bond market provides an early indicator of the health of the economy. Any concerns are quickly reflected in the amount of yield investors require to lend money to corporations. As things currently stand, yield spreads are at 5-year lows, suggesting the bond markets are sanguine to the risk of a slowing economy pressuring corporate’s ability to repay their debt
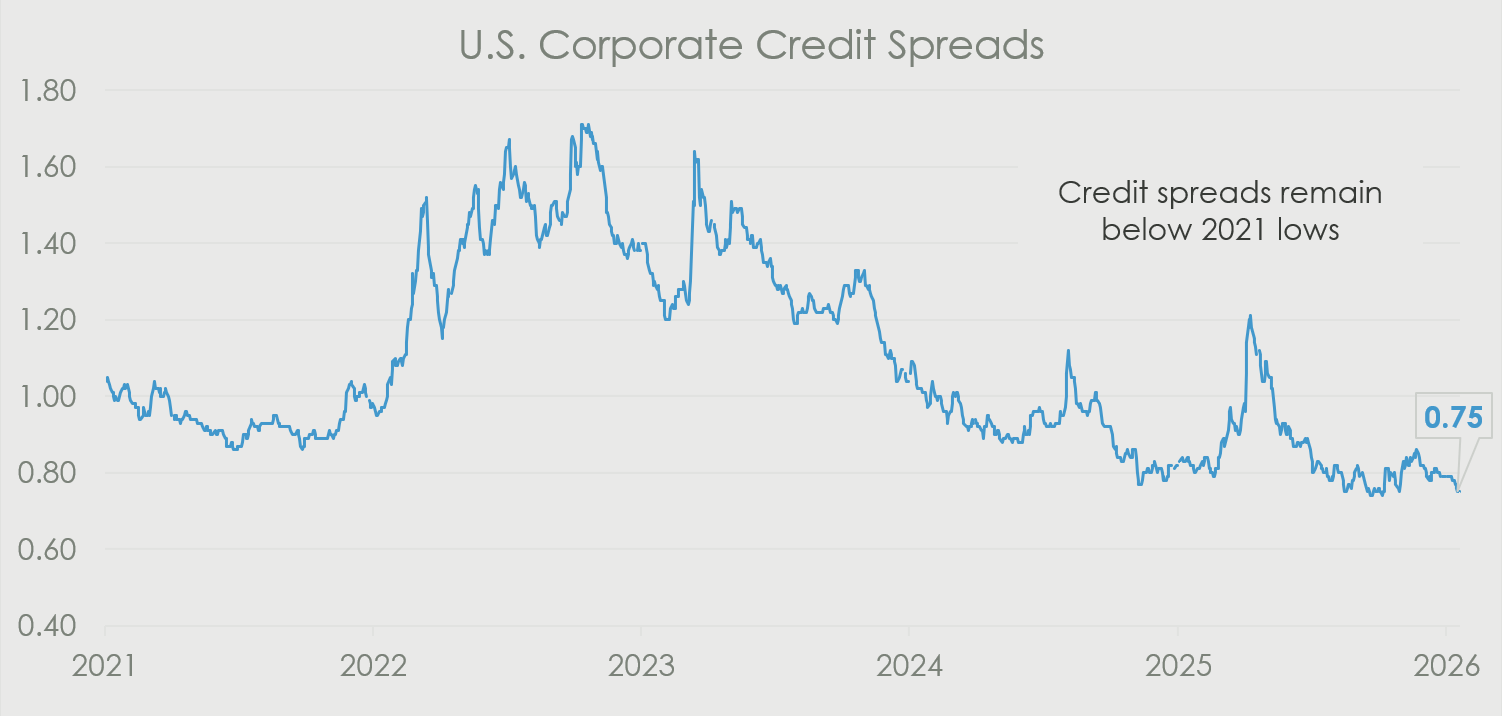
Supporting these low yields is the fact that default rates remain significantly below 5-year average levels.

Easy Monetary Policy:
Major central banks have been cutting rates for the last 12 months. Rate cuts typically provide a tailwind for global equity markets.

Currently, the majority of the top 25 global central banks are in a rate cutting cycle, the exceptions being Japan and Brazil.
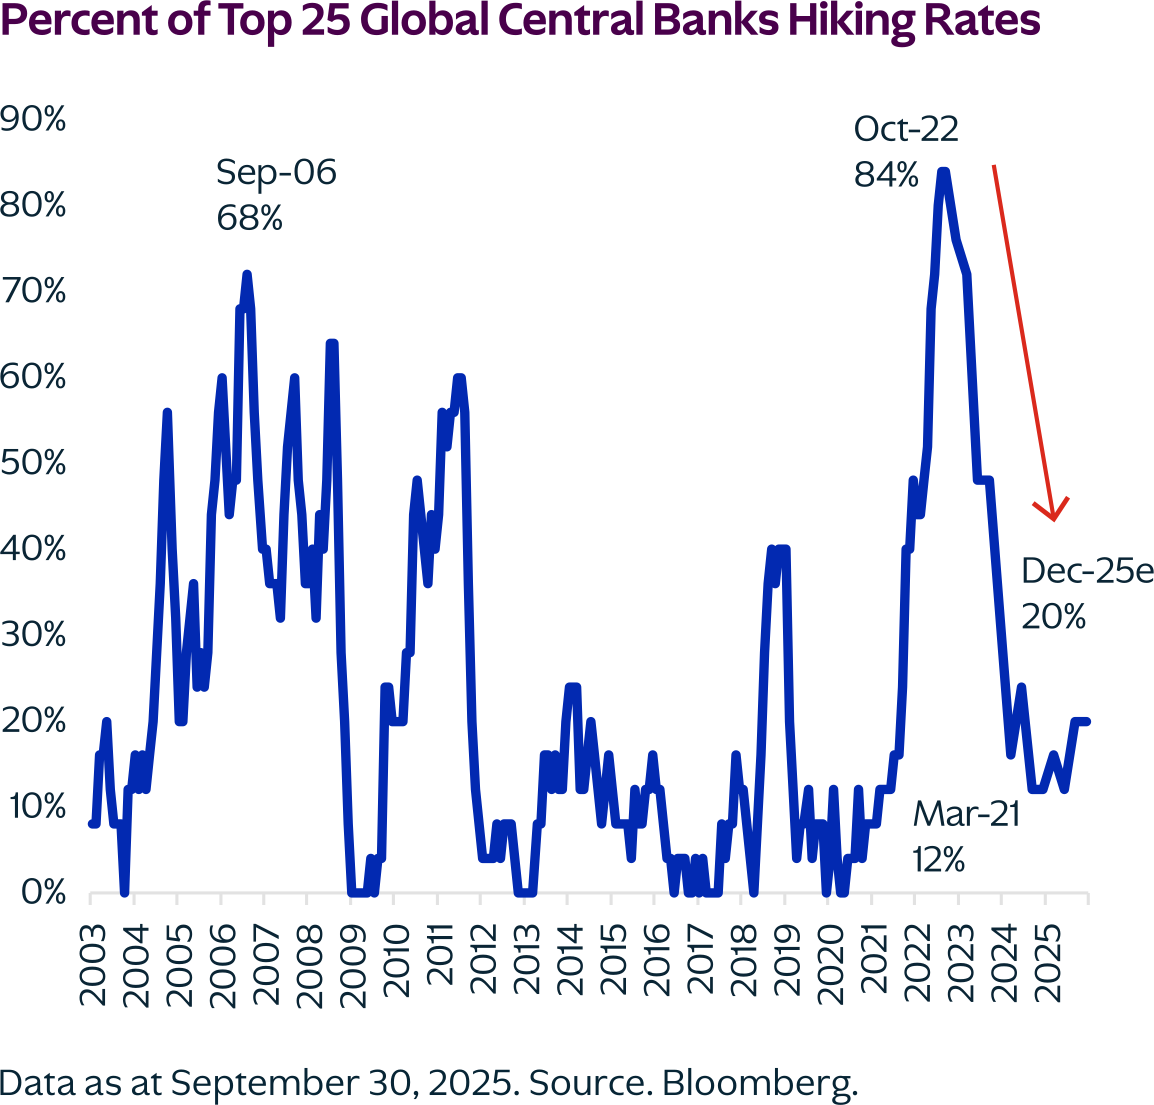
For 2026, we are expecting the U.S. Fed to cut 2-3 more times, the BoE twice, and the ECB is likely to stay put.
Fiscal Stimulus:
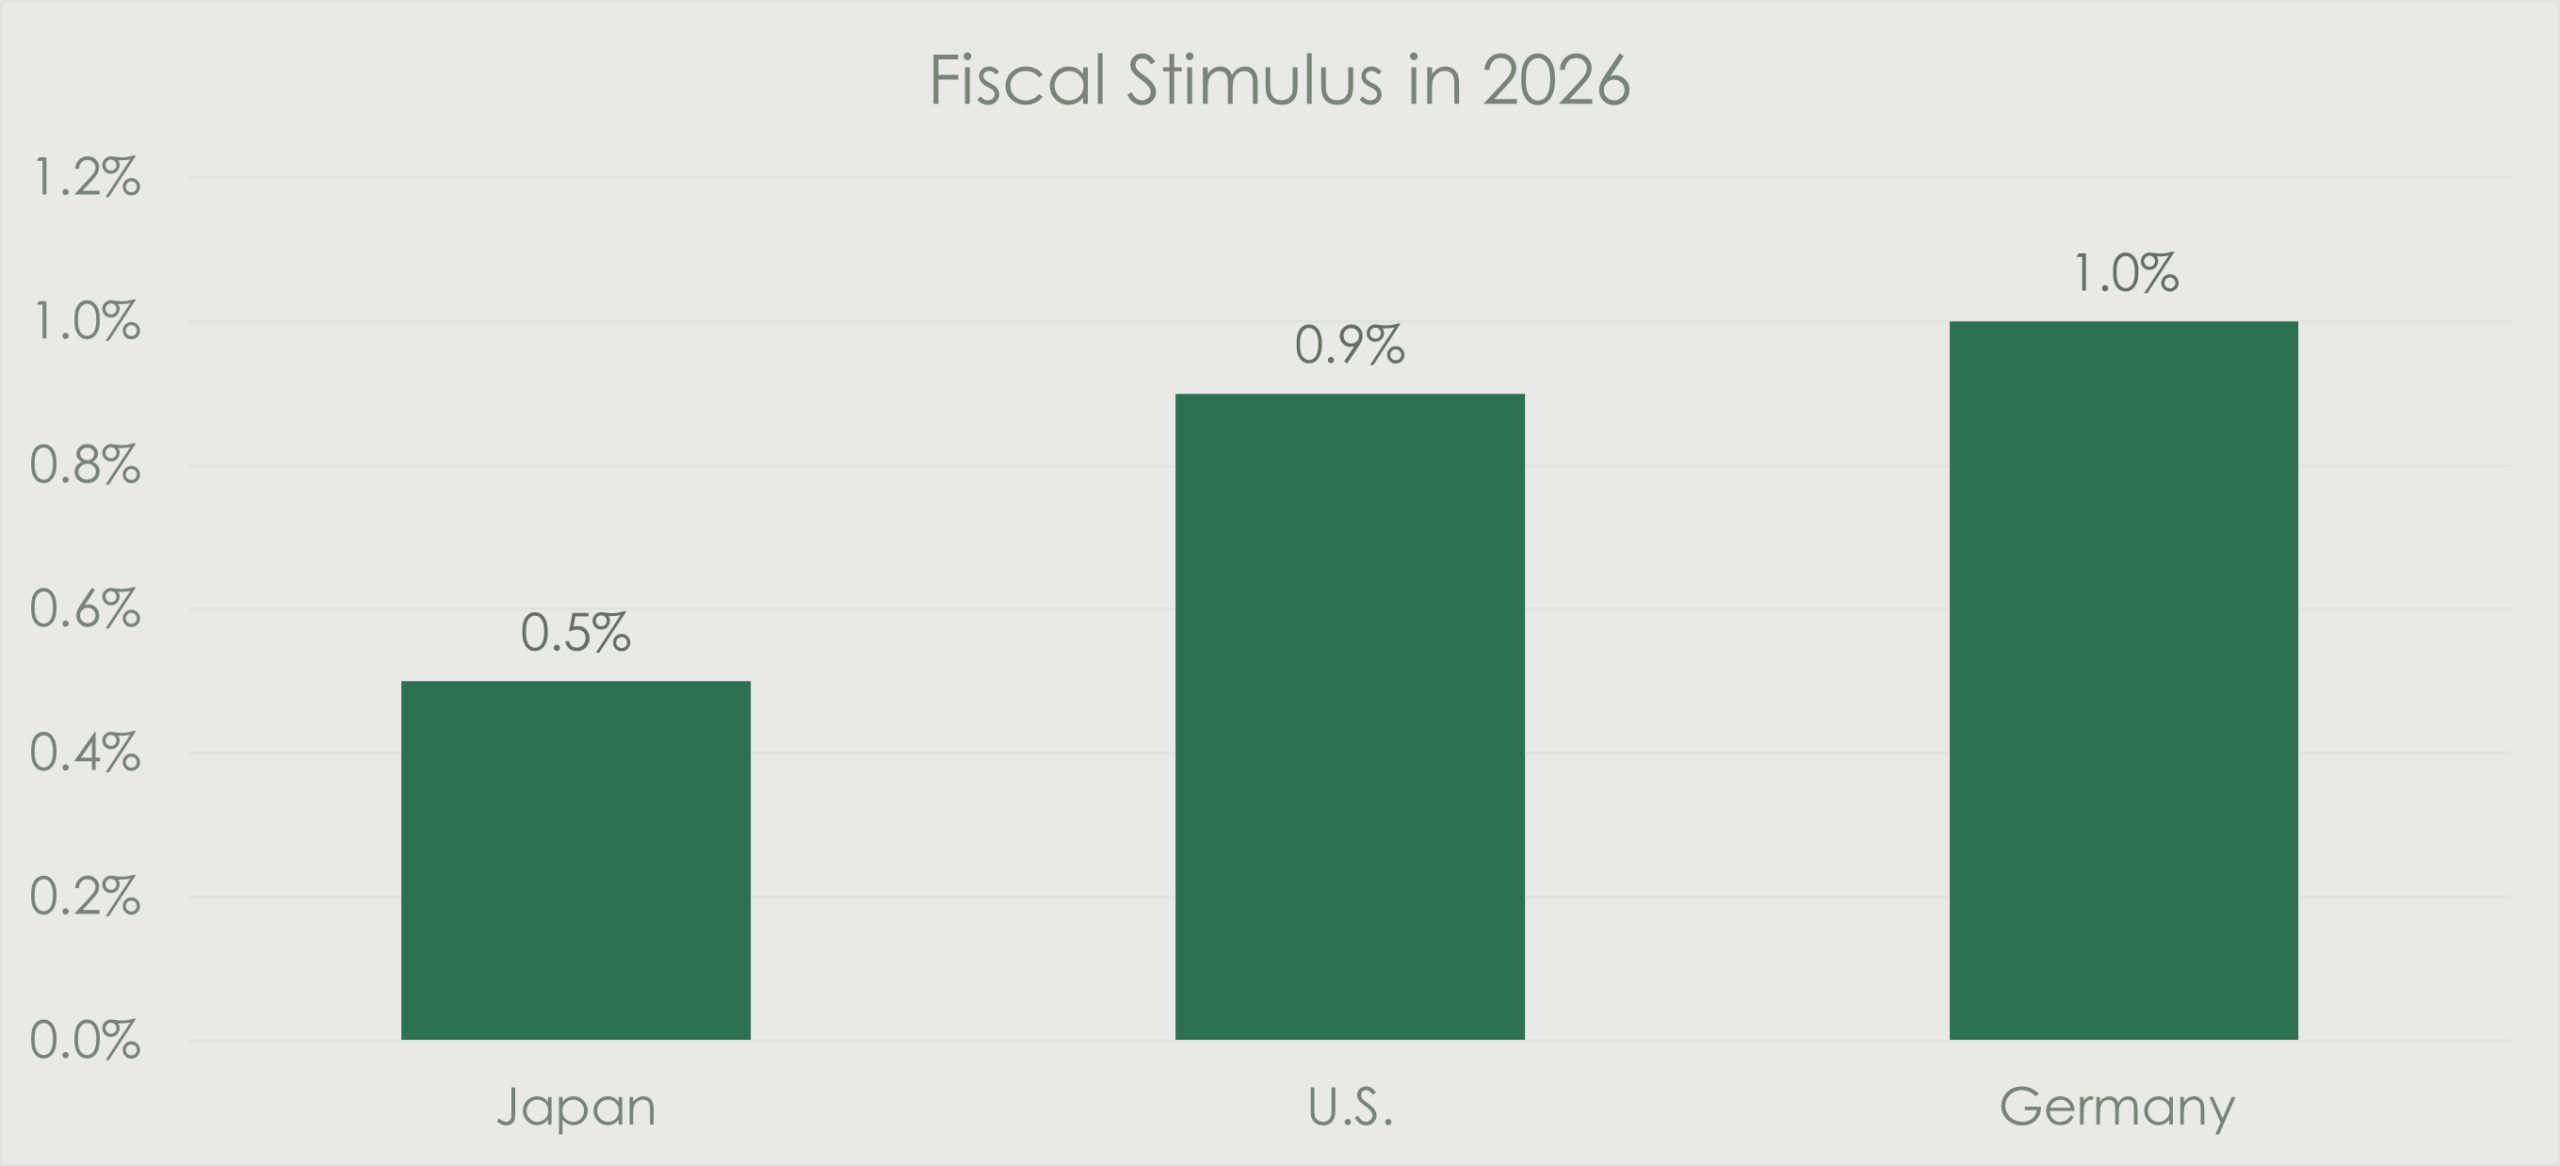
If 2025 was the year of the Tariff, 2026 is set to the year of Fiscal Stimulus, as the OBBB (One Big Beautiful Bill) begins to provide support to the economy in the form of tax cuts, SALT (tax deductions), increased government spending on Defense and Security, and other investment incentives. Fiscal Stimulus is set to add 90bps to U.S. GDP growth in 2026.
Fiscal stimulus is not limited to the U.S.; in Germany we will begin to see the benefits of their increase in defense and infrastructure spend which is forecast to add 1 ppt to GDP growth. We expect to see other EU countries follow suit.
Across the Pacific, Japan is focused on fiscally stimulating their economy.
Households Remain in Good Shape:
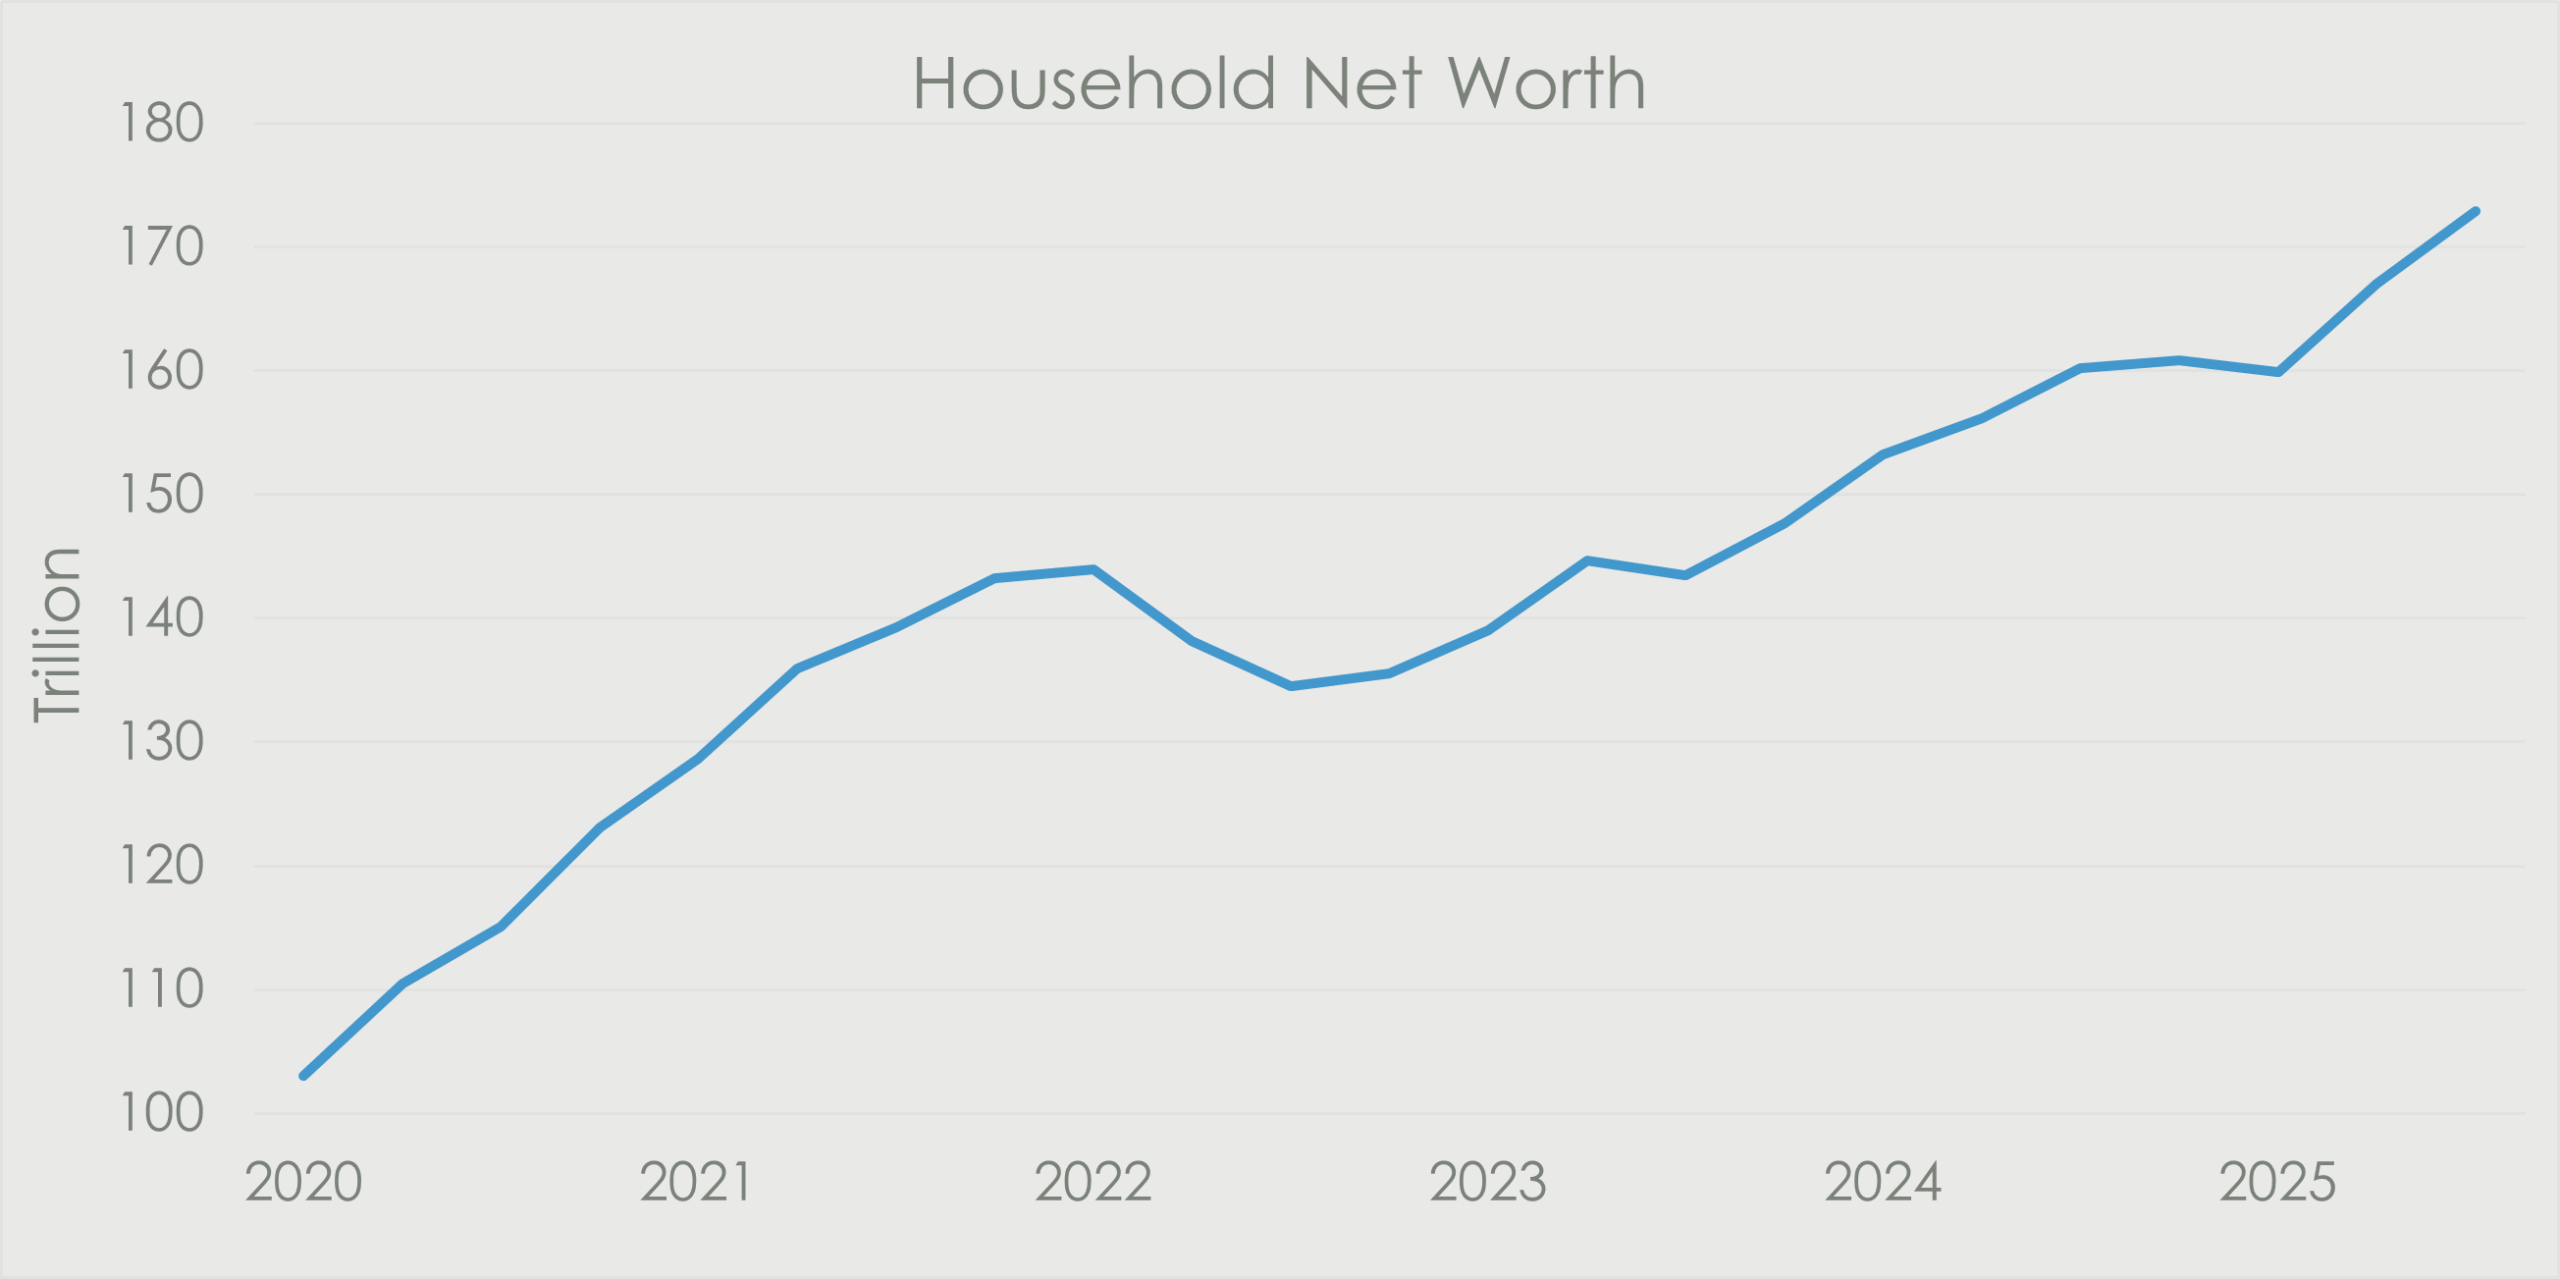
U.S. households are in great shape. Record high stock markets coupled with a strong housing market has meant U.S. households have never been worth more.
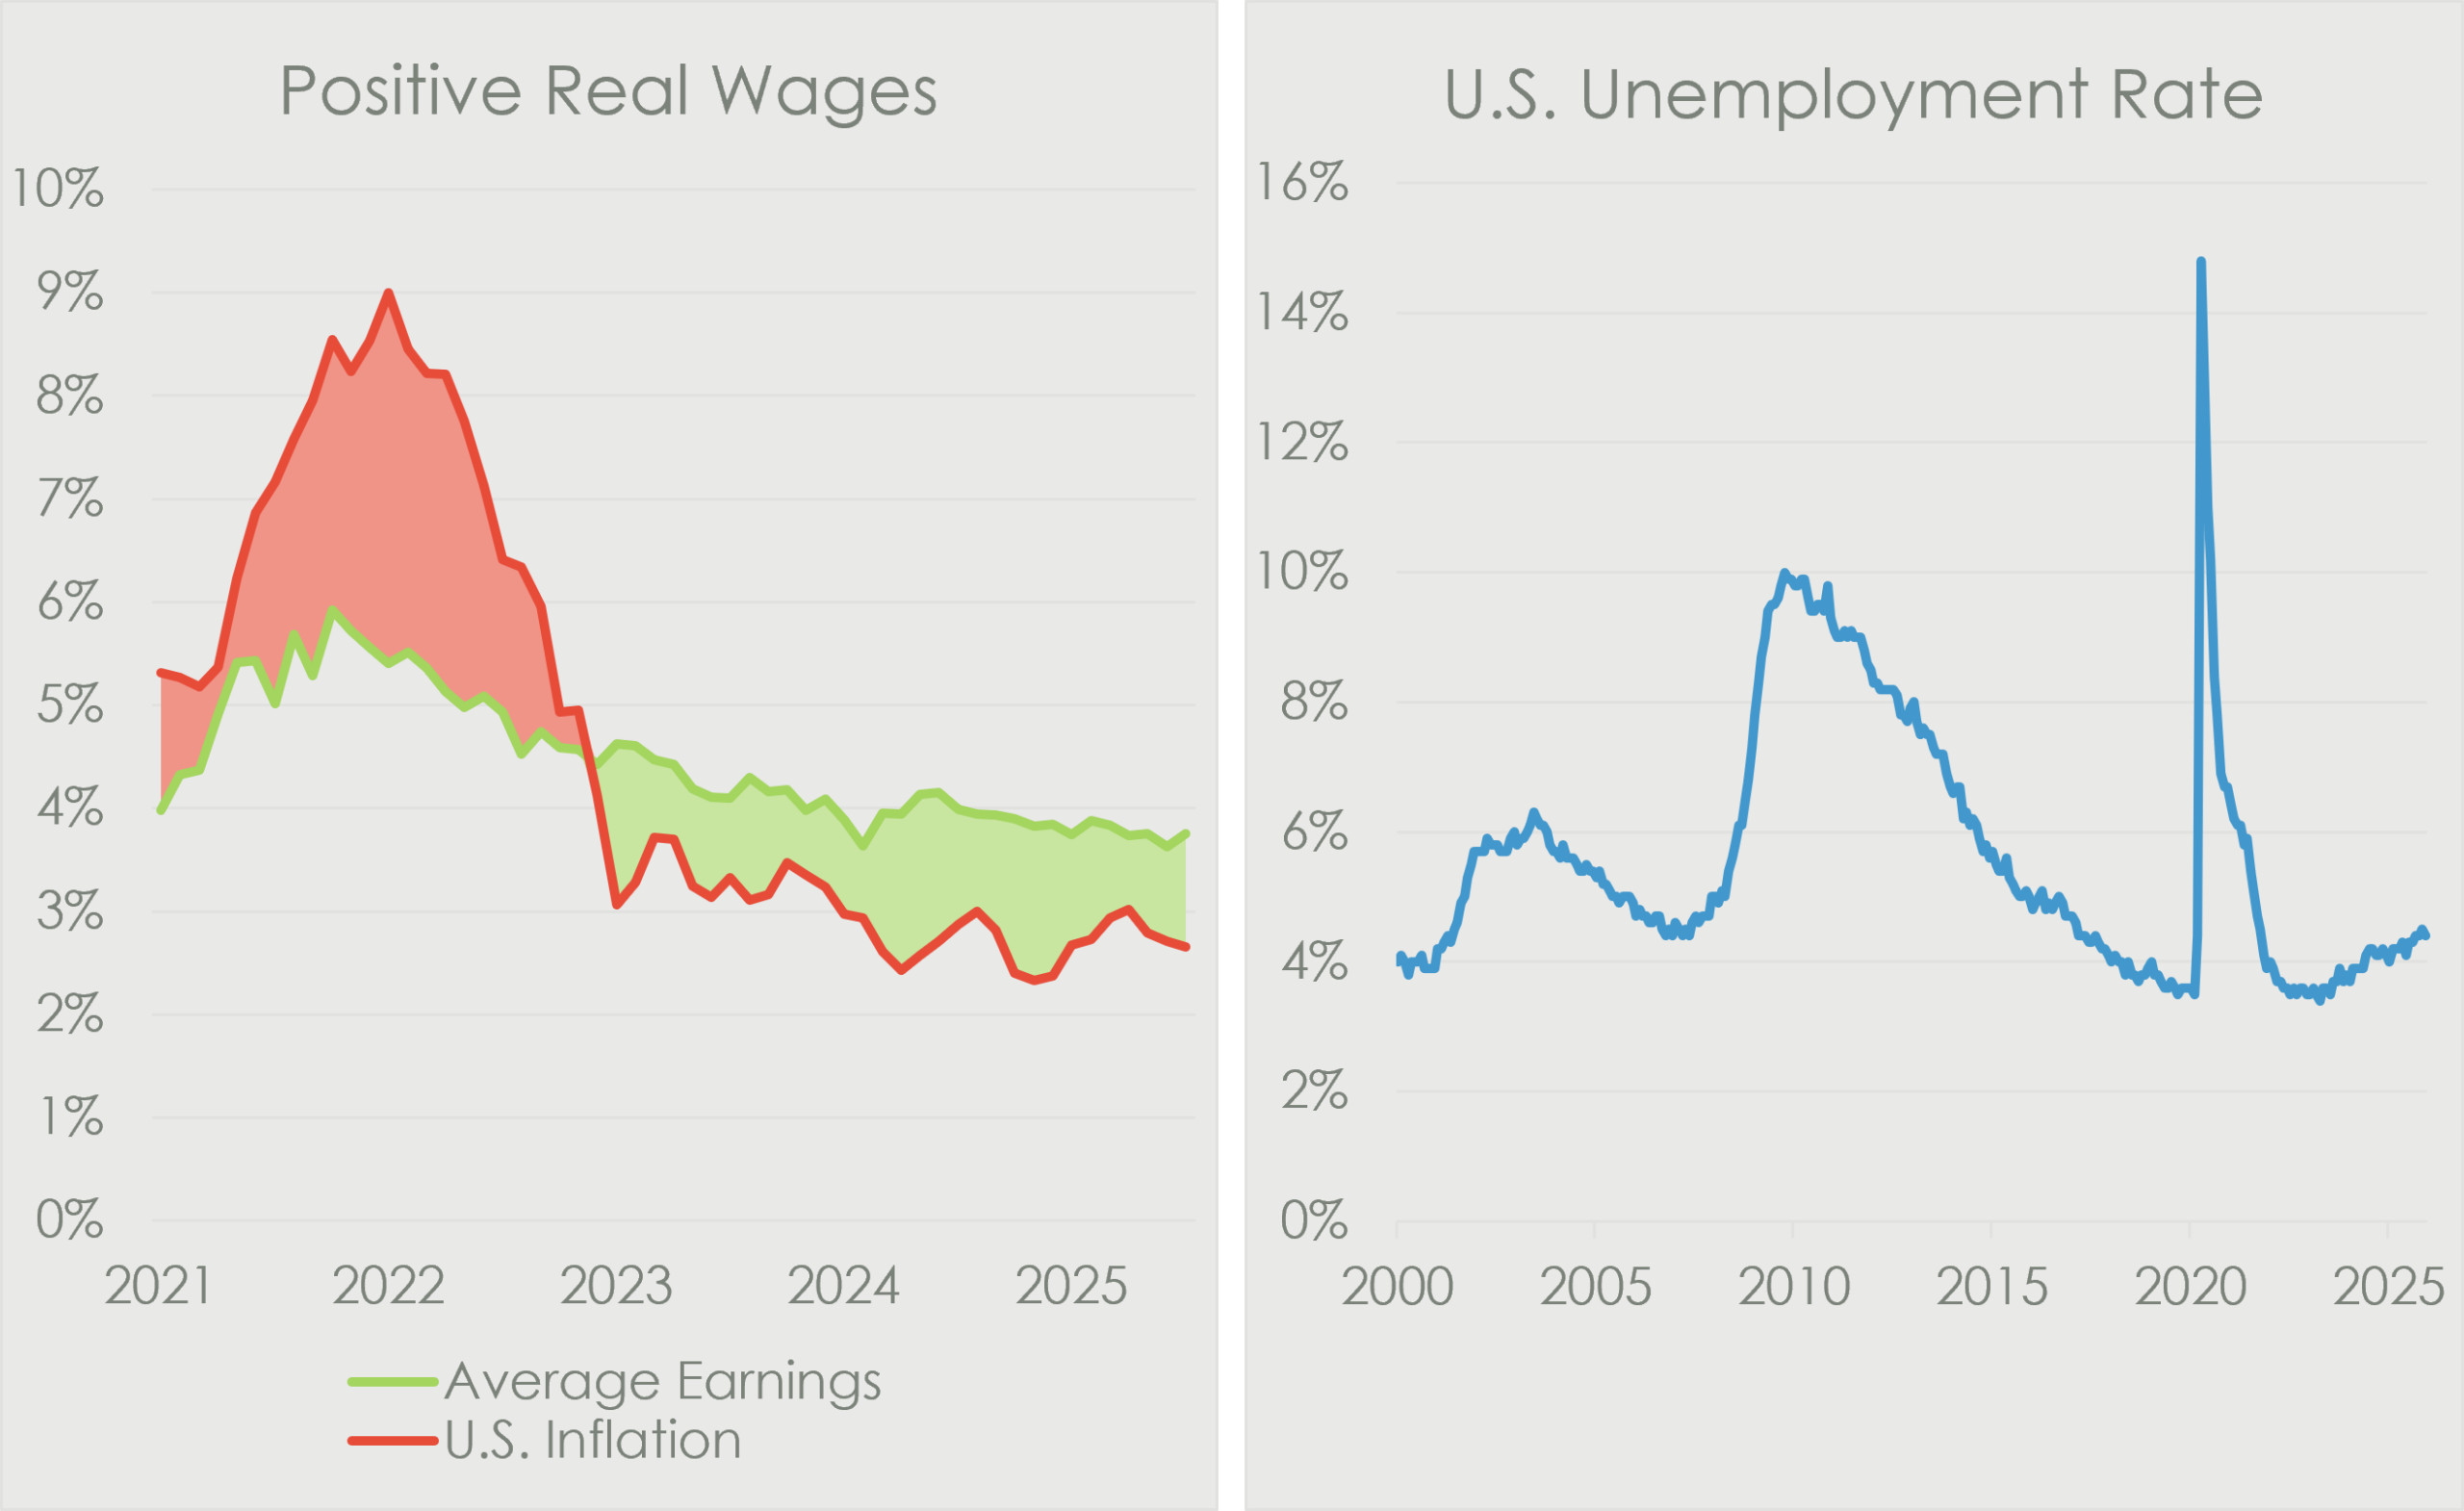
Unemployment rates are at or near lows, saving rates are stable and rising, debt servicing costs have declined, and real wage growth remains solid. U.S. consumers are well positioned to continue to support economic growth.
Fundamentals in Place – Can Equity Markets Keep Performing?
The majority of the S&P 500’s return in 2025 was delivered from earnings growth, with valuations exiting the year at the same level it started 2025, at 22x.
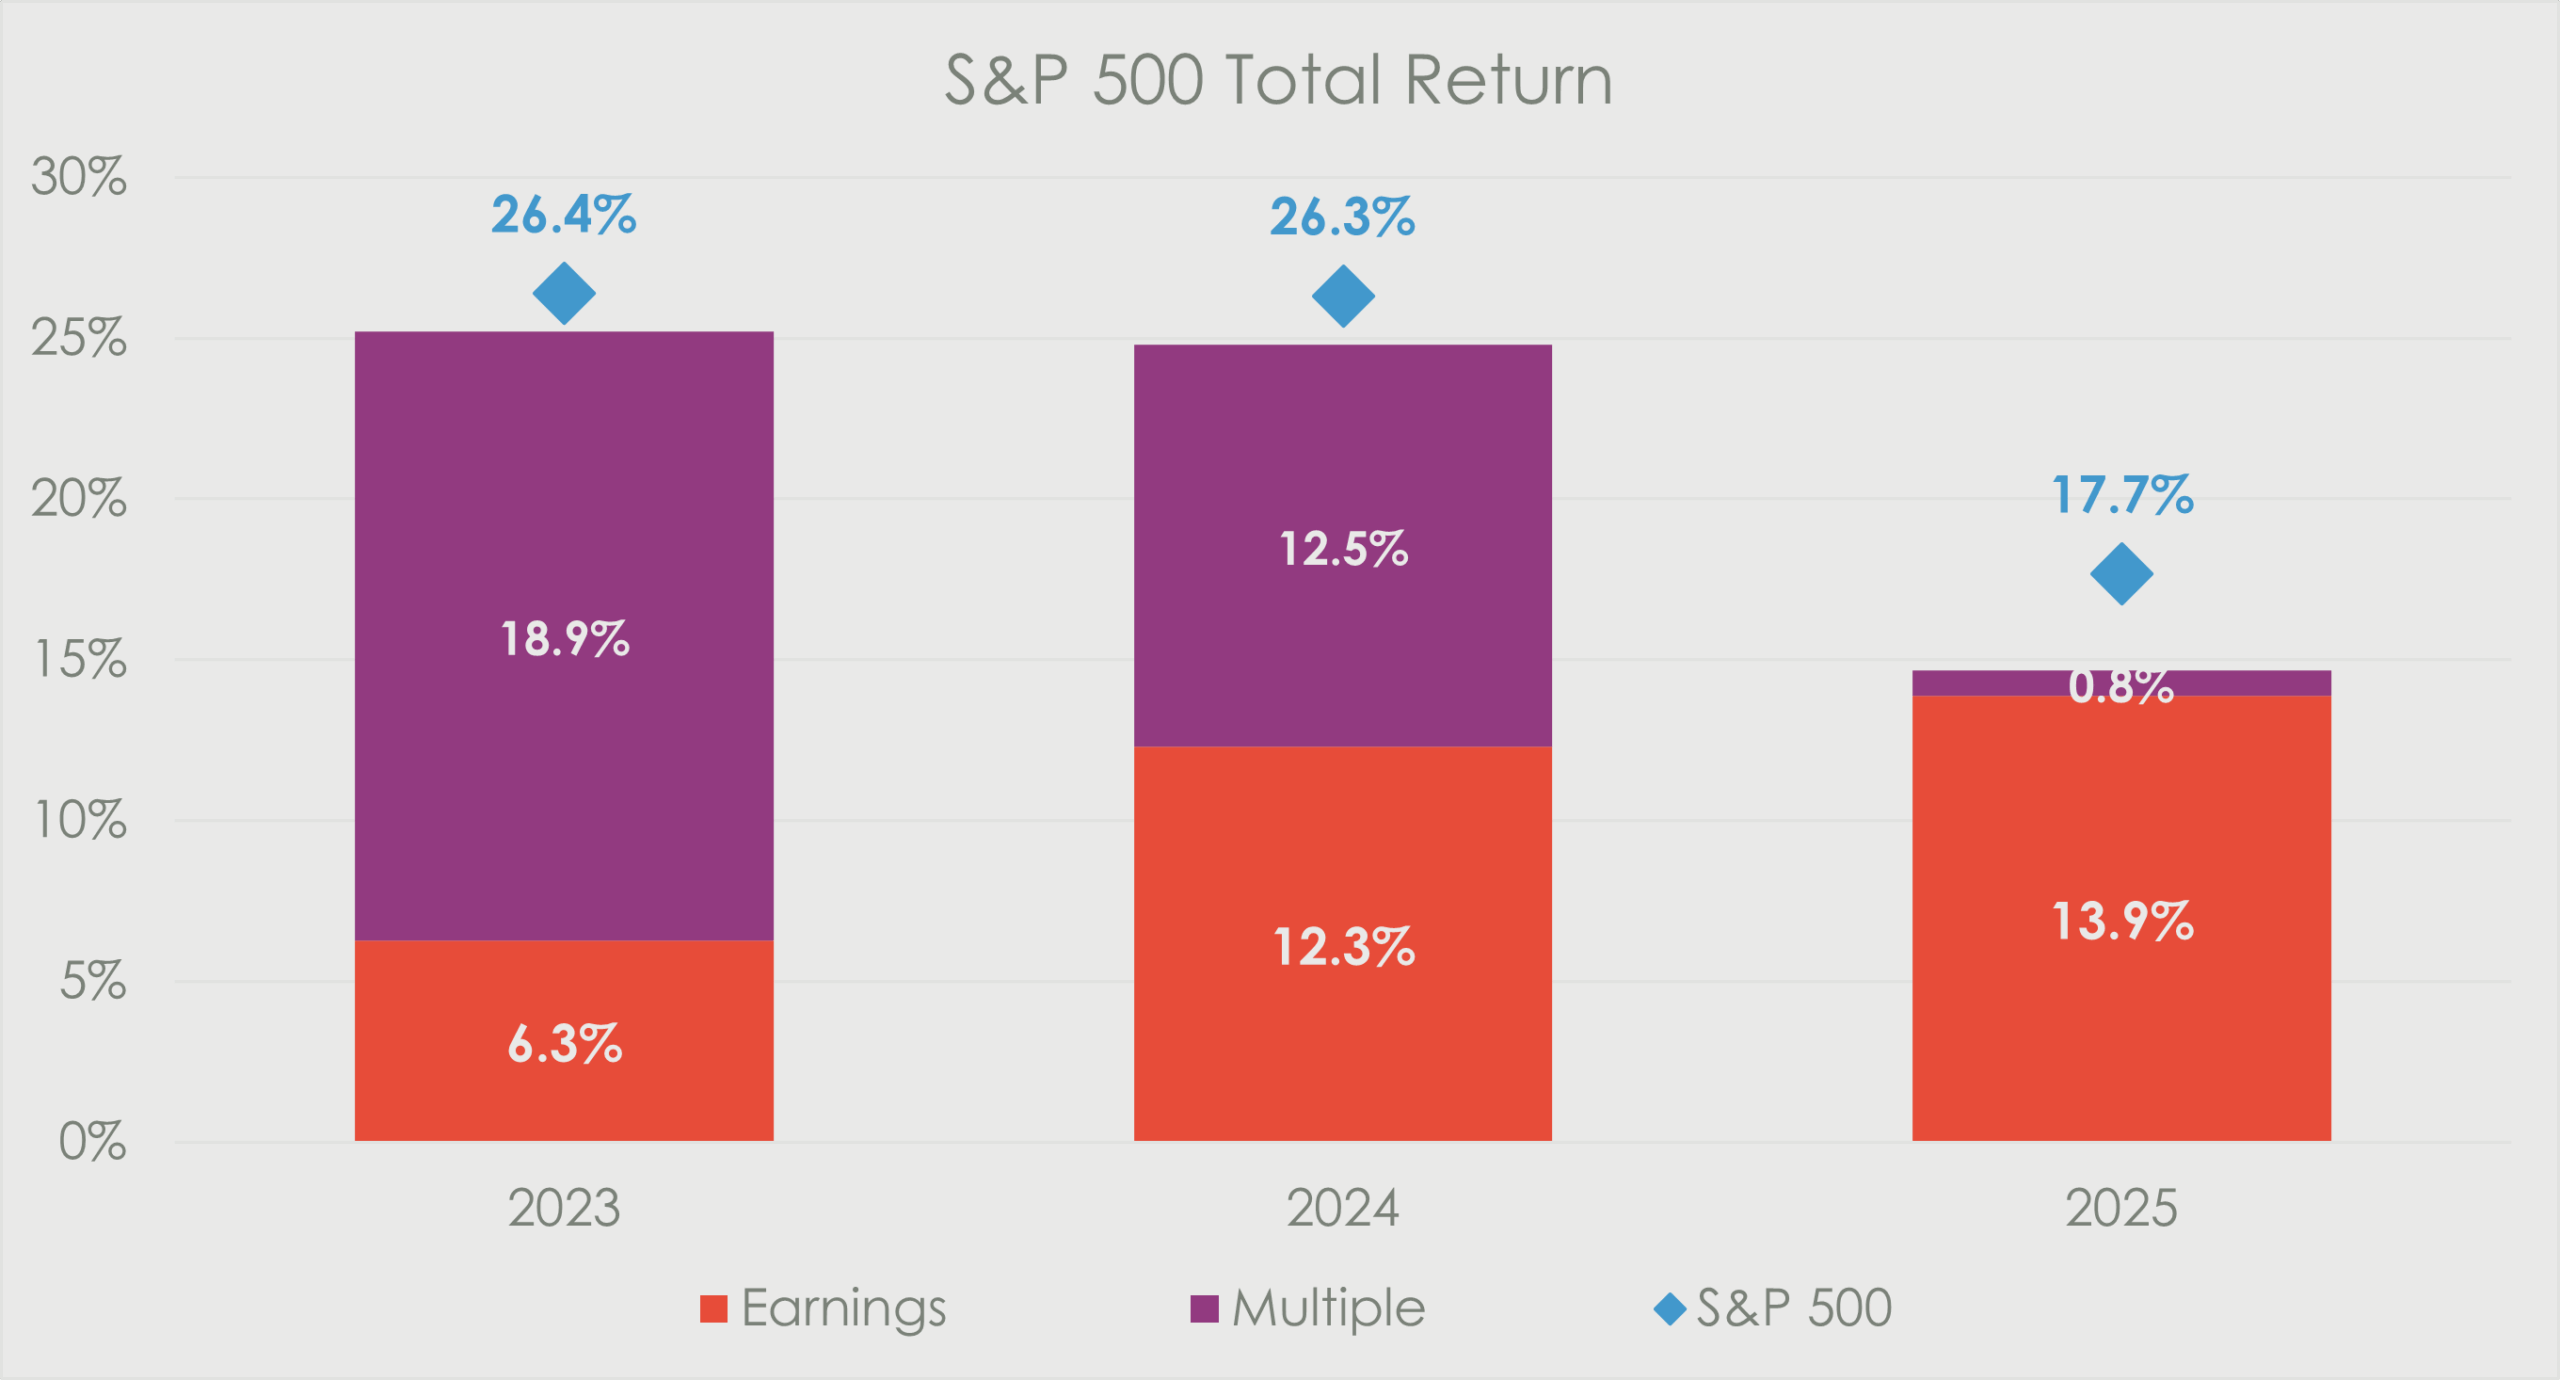
As we enter 2026, we believe earnings growth will again be responsible for the majority of return in 2026. As it currently stands Earnings for S&P 500 companies are estimated to grow circa 15% for 2026 & 2027.

Put simply, we believe the S&P 500 can deliver another year of 15% returns based on earnings growth alone.
While valuations remain historically above average, we are not as concerned as some.

As discussed on various occasions, we believe the S&P 500 make-up has drifted to being more heavily weighted towards the higher multiple, high growth technology names which are consequently driving the average S&P multiple higher
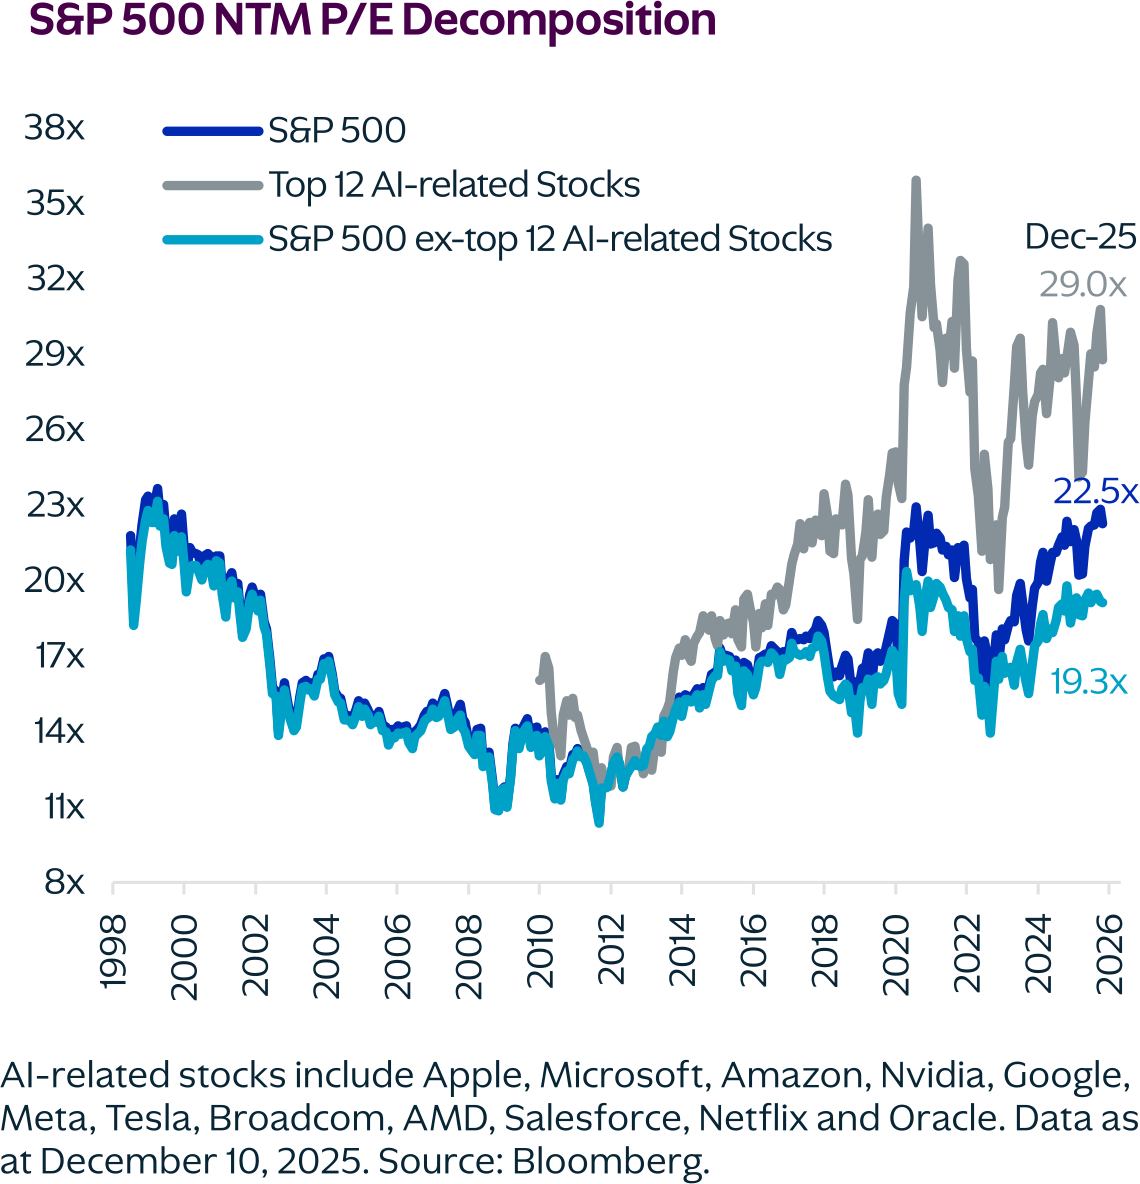
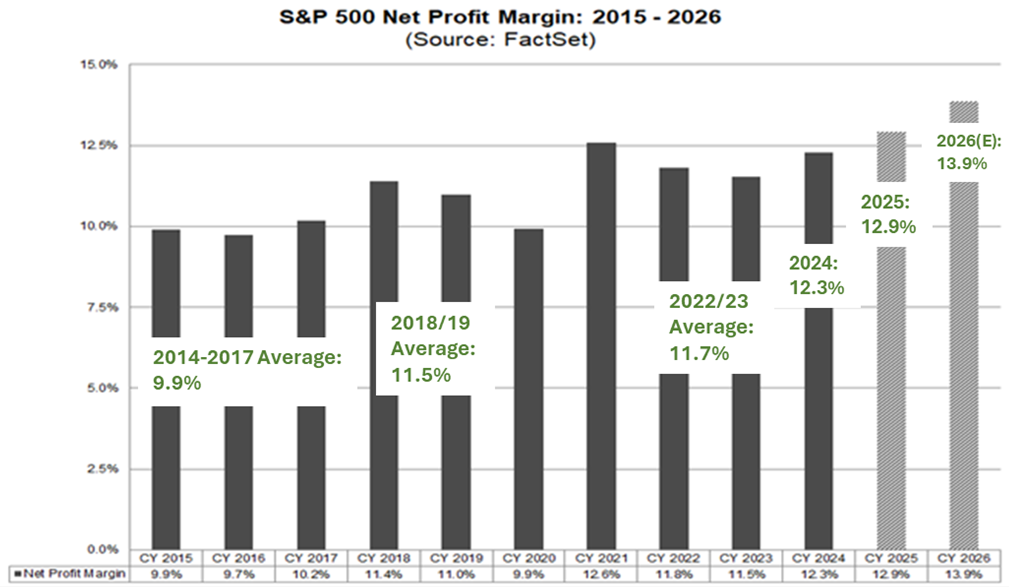
Net Margins of S&P 500 companies in 2025 reached new record levels and are set to increase again in 2026. Productivity gains – which stand to continue to benefit as AI becomes a more integral part of business operations – are driving up margins and ROEs. This increasing profitability across U.S. companies in and of itself justifies higher valuation multiples.
AI Delivering Secular Growth Across the Entire Value Chain
Within the U.S. investment landscape, we are focused on a few things. Firstly, we continue to see secular growth across the entire AI value chain. The hyperscalers are forecast to spend $527bln on developing AI data centers in 2026. While to most investors this spend is synonymous with semiconductors, in general, and Nvidia, in particular, we are seeing demand boosted across the value chain. This ranges from construction companies responsible for building the infrastructure to house data centers, the electricity providers and electrical component companies providing power, to companies providing cooling systems, server racks, power management systems and cabling. Ultimately, culminating to the actual AI servers that Nvidia and others provide to make the magic happen.
We remain fully invested in the AI space and continue to look into diversifying our exposure away from being directly invested in the large hyperscalers that have seen significant appreciation, to players further down the chain that have potential for above average upside as greenfield projects are developed.
A lot has been made on whether the AI theme is a bubble waiting to pop. We have addressed this topic in previous publication. Ultimately the AI evolution is not the 2000 Tech bubble, capex is real and funded through strong cash flows, plus return on investment is beginning to come through in order backlog. For now, we are less concerned about the risks related to a potential bubble bursting and more focused on being invested in the right areas at the right time.
Investments Outside the U.S. Becoming Increasingly Attractive
One of the consequences of President Trump’s geopolitical volatility is that globally investors have come to realize that having your entire portfolio concentrated within the U.S. has added incremental risk to the portfolio. In 2025 we began to see investment managers increasingly diversify their exposure, adding to holdings in Europe and Asia.
European equities have always traded at a discount to their U.S. counterparts, mainly because their earnings growth was stagnant versus their growthier U.S. peers.
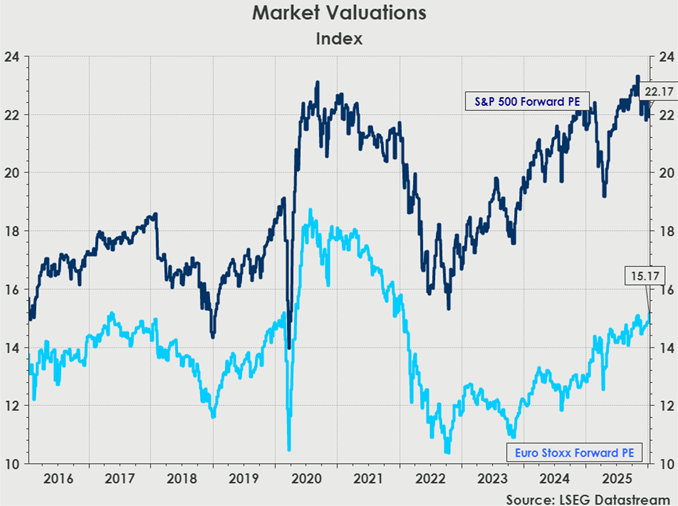
However, driven by factors such as fiscal stimulus programs in defense and infrastructure across the EU states, technology growth in Asia, and general economic growth, we are beginning to see growth outside the U.S. pick up. This should bode well for investments across these various geographies. As the growth gap between the U.S. and the rest of the world narrows, we expect to see the discounts in Ex-U.S. markets narrow.
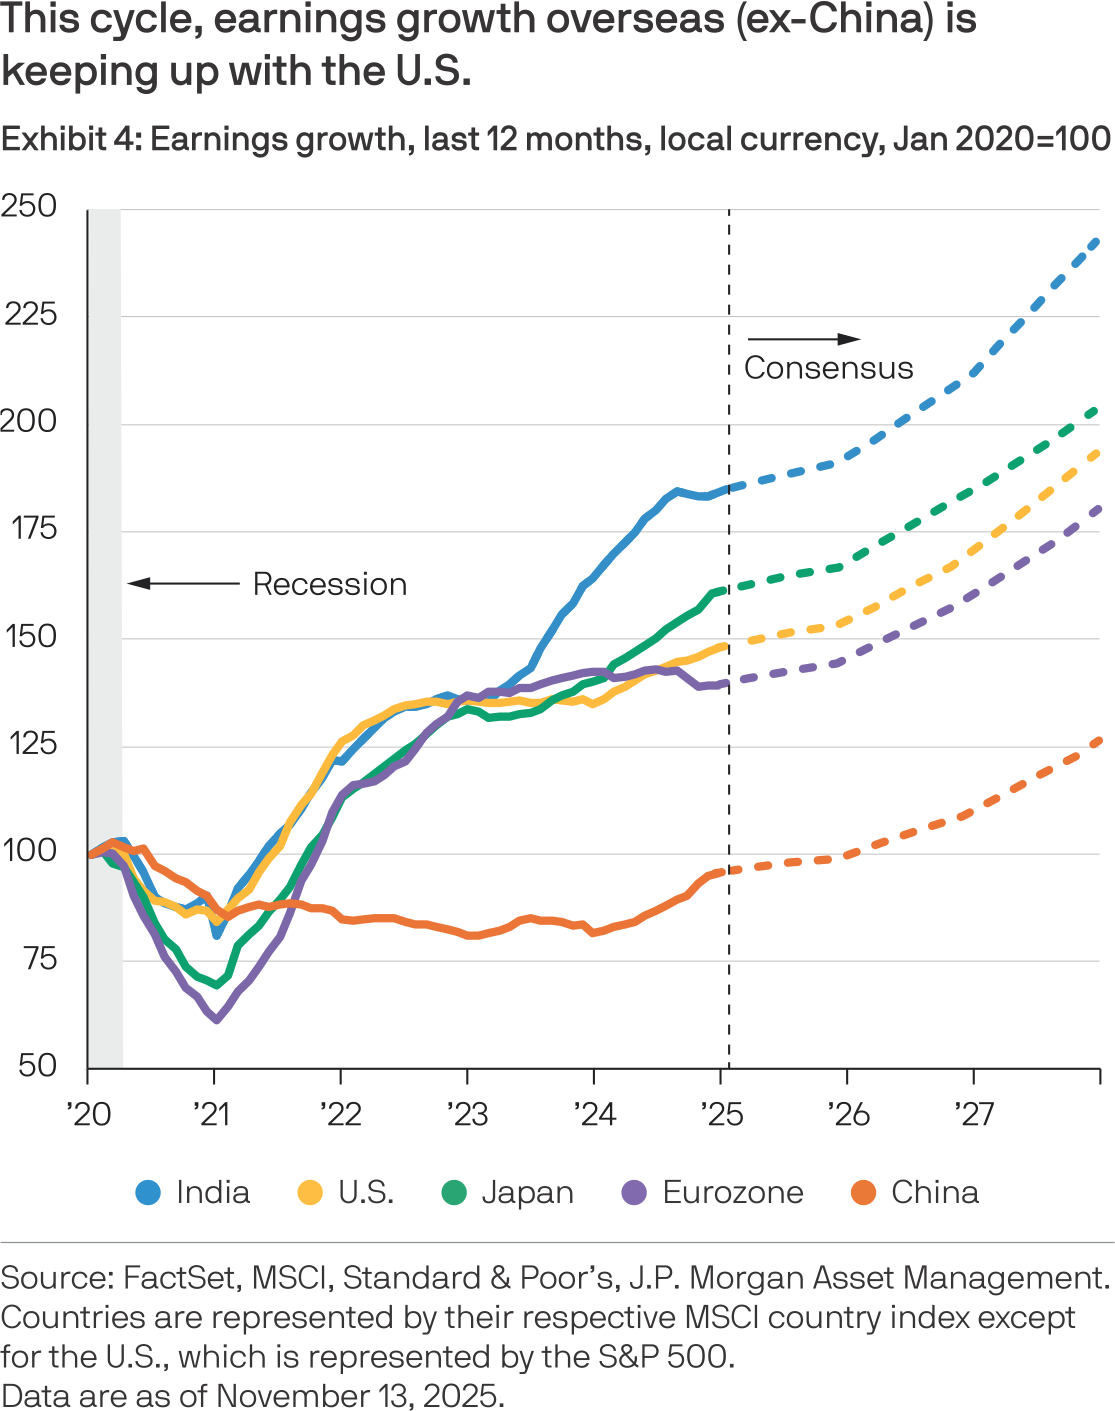
As we look outside the U.S. for investment opportunities, we find the industrial sector enticing as direct beneficiaries of the fiscal push within Europe to become more self-sufficient and less dependent on the U.S. Of particular interest are the electrical infrastructure companies. EU banks also stand to be big beneficiaries in an improving economic environment. Healthier net interest margins and strong transaction-based revenues are driving top line growth, while the reduction of capital ratios via share buybacks and dividends increases shareholder returns and increases ROEs; driving share price appreciation.
Across Asia, secular technology growth is driving exciting opportunities across the Asian technology companies. Additionally, the growing Indian middle class is set to bring with it a wave of consumer spending.
The Trump Factor
No investment outlook is complete without incorporating what we can expect from President Trump – almost an impossible task. One thing is for sure, Trump is volatile and investors should be prepared for anything. Over the last year, markets have become somewhat desensitized to Trump’s antics, becoming familiar with President Trump’s initial tough rhetoric which is subsequentially walked back.
We have put together a list of a few top Trump related factors that investors should be aware of for 2026:
- TARIFFS: Tariffs dominated 2025, as we enter 2026, we expect to get the Supreme Court’s ruling on the legality of IEEPA. Essentially, whether President Trump had the authority to enact tariffs based on economic security act. If it is ruled that Trump overstepped his authority the Tariffs enacted under IEEPA will be deemed null and void, and the U.S. government will be liable for refunds. However, tariffs could be enacted under other laws which may limit any walk back.
- FISCAL STIMULUS: In 2026 we will start to see the benefits from Deregulation and the OBBB. This could add 1ppt to U.S. GDP in 2026. This will provide a boost to businesses, particularly Financials and Healthcare. The OBBB will benefit U.S. households.
- AGE OF EMPIRES: Venezuela, Greenland, who will be next? President Trumps seems to have a new fondness of annexing countries. So far equity markets have just shrugged off these shenanigans.
- U.S. FED: More concerning for capital markets are the attacks on the independence of the U.S. Fed. Any major threat to the Feds independence will have far reaching implications for capital markets, impacting the U.S. dollar, inflation expectations, and the premium investors require to own U.S. assets. Chairperson Jerome Powell’s term comes to an end in May. All eyes will be on his successor.
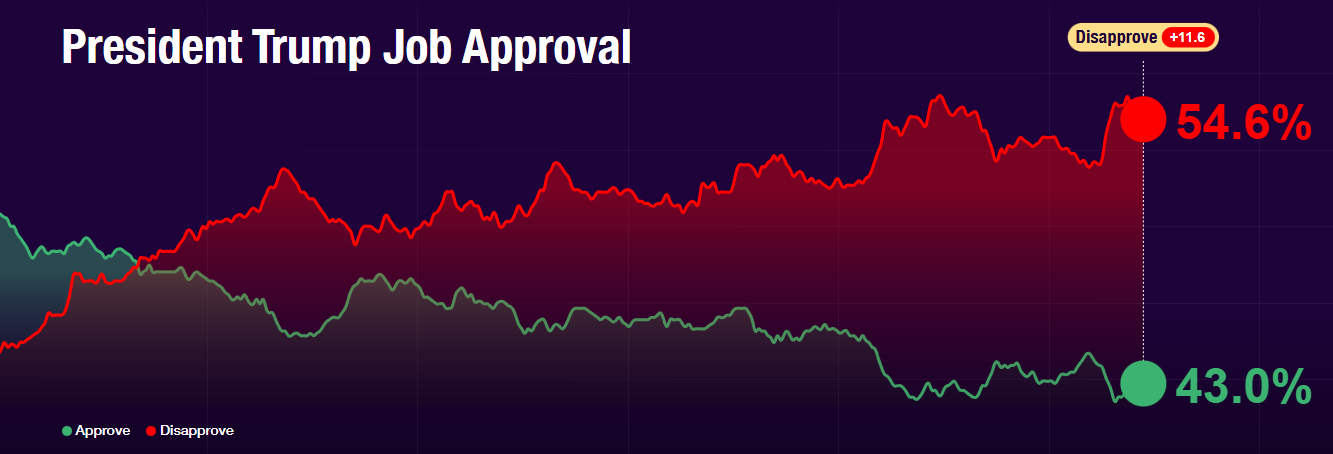
- MID-TERM ELECTIONS: The U.S. goes to the polls in November for mid-term elections. Currently the Republicans hold majorities in both the Senate (53/47) and the House (219/213), with President Trump’s popularity declining, the Republicans will be under pressure to retain both houses of congress. Polls suggest the Democratics have a big chance of regaining the House. If we do see a divided congress come November, that could significantly limit Trump’s ability to push through his authoritarian agenda.
In conclusion, we continue to feel that the wind is firmly in our sails in 2026. Looser monetary policy and fiscal stimulus remain supportive of economic growth. The continued roll out of AI adoption is driving capital flows, protecting margins and driving earnings growth. We believe upside comes from earnings over multiple expansion and see the potential for another year of low to mid teen returns.