

FEMO – Fabulous Earnings Momentum
May followed April’s strong equity market performance. From a geopolitical standpoint, May can be characterized by the on-again, off-again peace talks. While the world has its fingers crossed for the reopening of the Strait of Hormuz, Oil prices remain elevated and we have started to see higher fuel prices show up in inflation data.
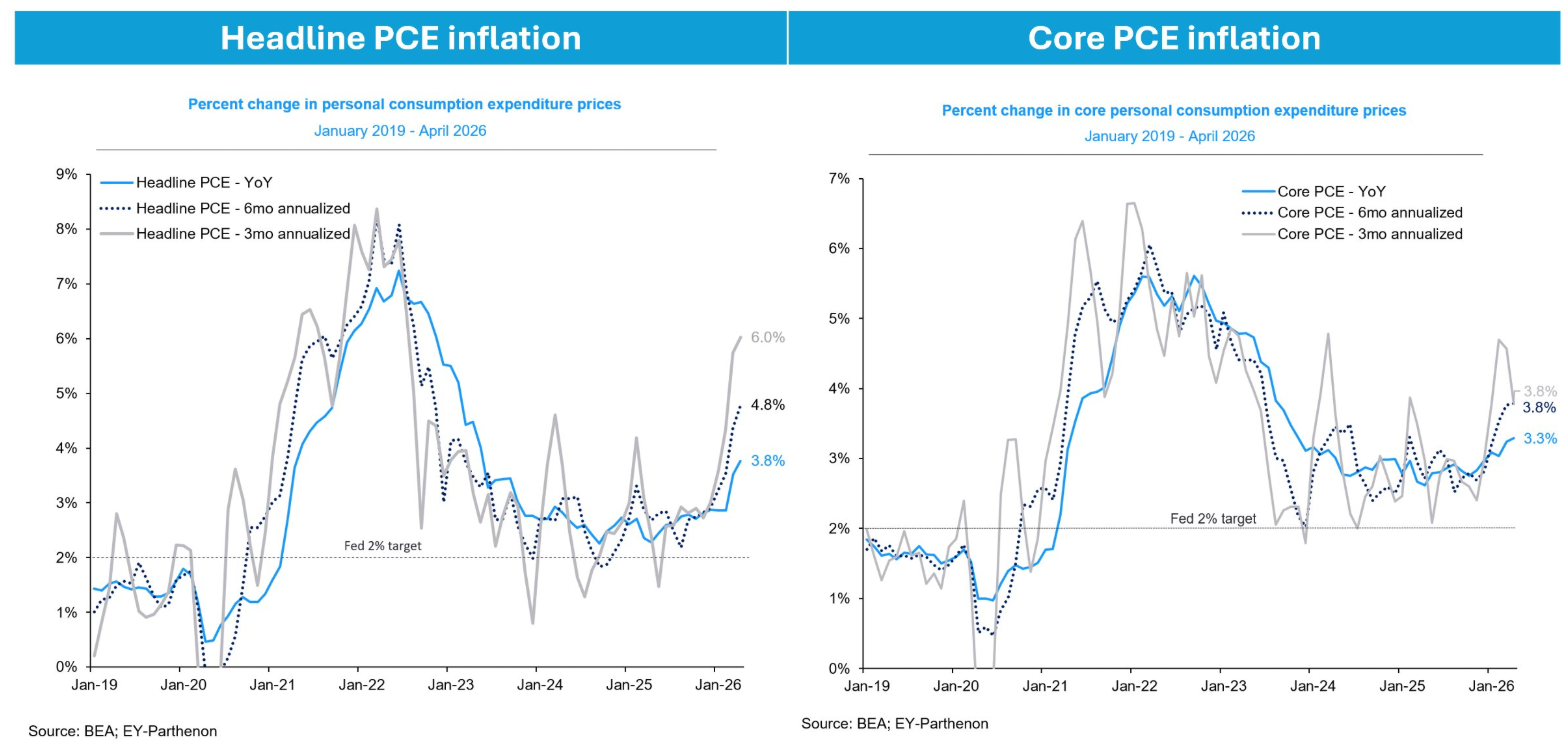
Concerns continue to linger around more permanent economic damage being caused by 96 days, and counting, of energy supply disruption. The Oil futures curve has shifted up significantly, currently pricing in >$80 oil for the rest of the year. With some forecasters painting a more dire picture the longer the supply of oil is disrupted.
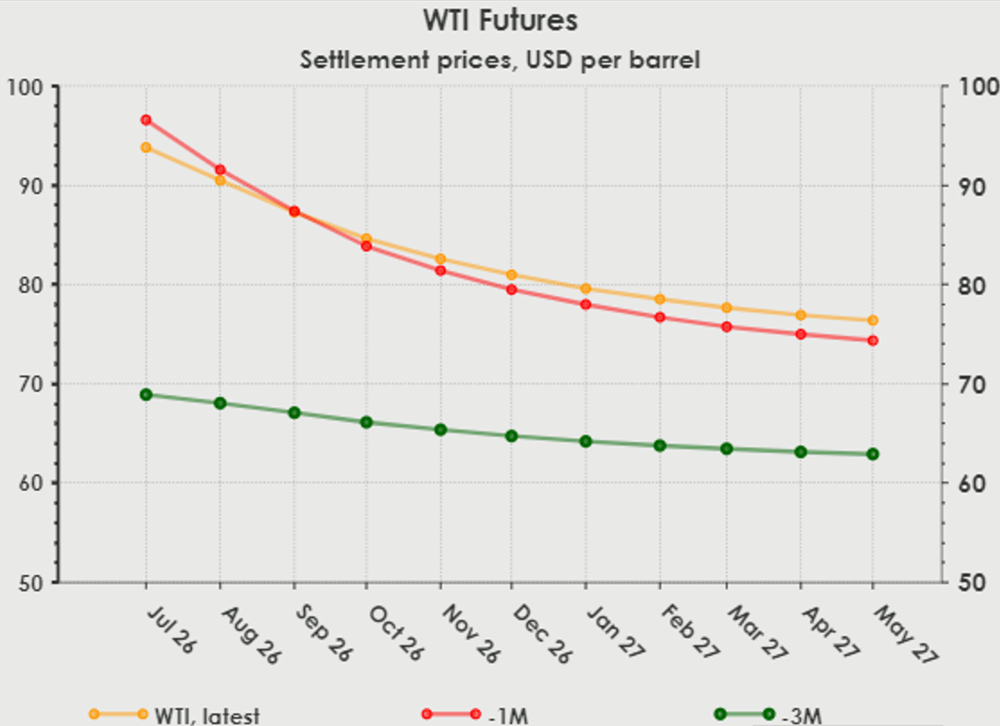
We have seen this change play out in government bond yields. Universally, government bond yields have risen as inflation expectations have increased.
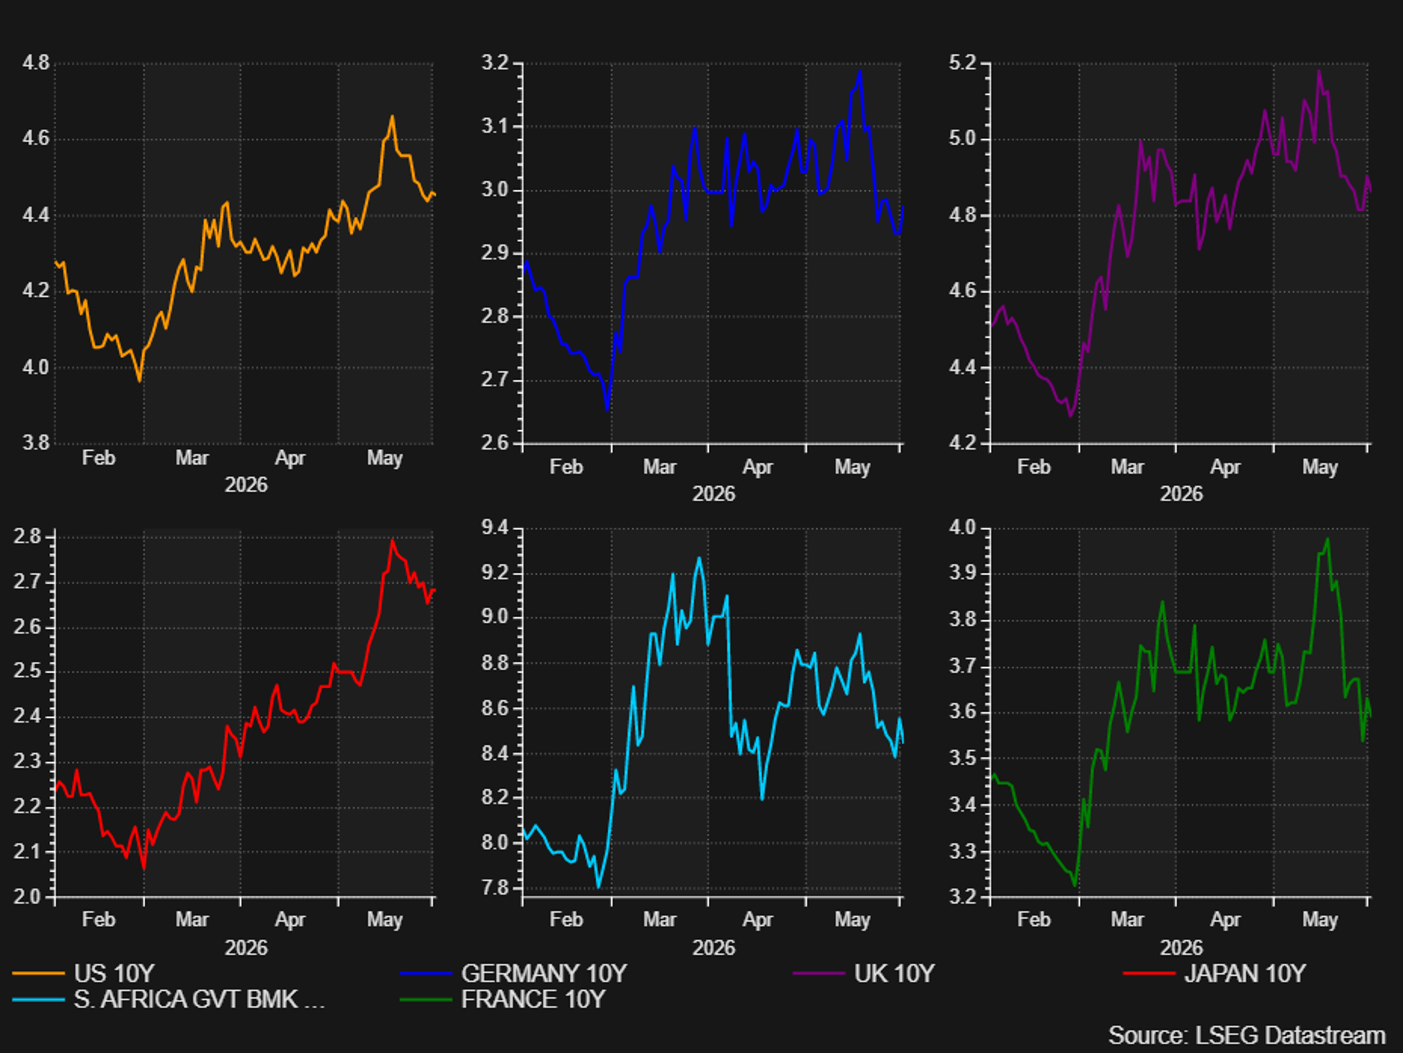
Typically, rising bond yields and increasing inflation expectations are not great for equity market returns.
Locally, South Africa has not escaped the collateral damage caused by the conflict in the Middle East. The inflationary impact of the increase in fuel prices has likely slowed the economy’s positive trajectory; putting pressure on the SA consumer. Anda and Khonie look at the impact in more detail as well as our portfolio pivot to a more defensive positioning.
FEMO NOT FOMO
The well-known market analyst, Edward Yardeni, recently coined the phrase “FEMO – Fabulous Earnings Momentum”. It is a very succinct acronym to describe what’s driving equity markets higher.
This year has been all about FEMO: “Fabulous Earnings Momentum. FOMO is based on hope & hype. FEMO is based on Fundamentals”. Ed Yardeni
Equity markets across the world continue to hit all-time highs as investors remain focused on earnings growth and ignore all the geopolitical noise.
1Q earnings reporting season concluded in May and delivered an extraordinary set of results.
- 85% of S&P 500 companies reported positive earnings surprise
The average beat was 16.7% - 1Q EPS growth rate came in at 28.6% Y/Y – the highest growth rate since 4Q21
- 1Q revenue growth was 11.6% Y/Y
- Profit Margins continue to improve, with 1Q Profit Margins increased to a record 14.8%, up 120bps Q/Q and 200bps Y/Y
While AI spending is without a doubt the driving force behind much of this acceleration in growth, the beneficiaries are widespread with 8 of the 11 S&P 500 sectors seeing greater than 15% Y/Y EPS growth. Understandably, the Mag 7 has seen their growth explode, but the other 493 companies have seen EPS growth jump up to a very impressive 17.4%.
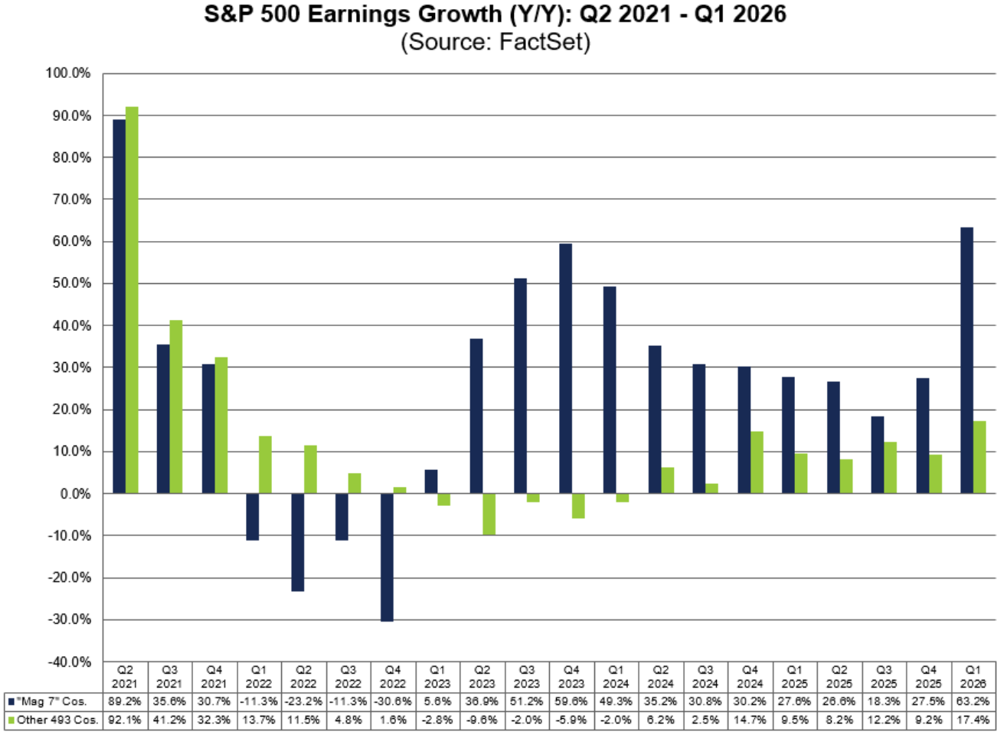
Looking forward to 2026 & 2027, we have seen earnings growth expectations move up to 24% Y/Y and 17% Y/Y, respectively.
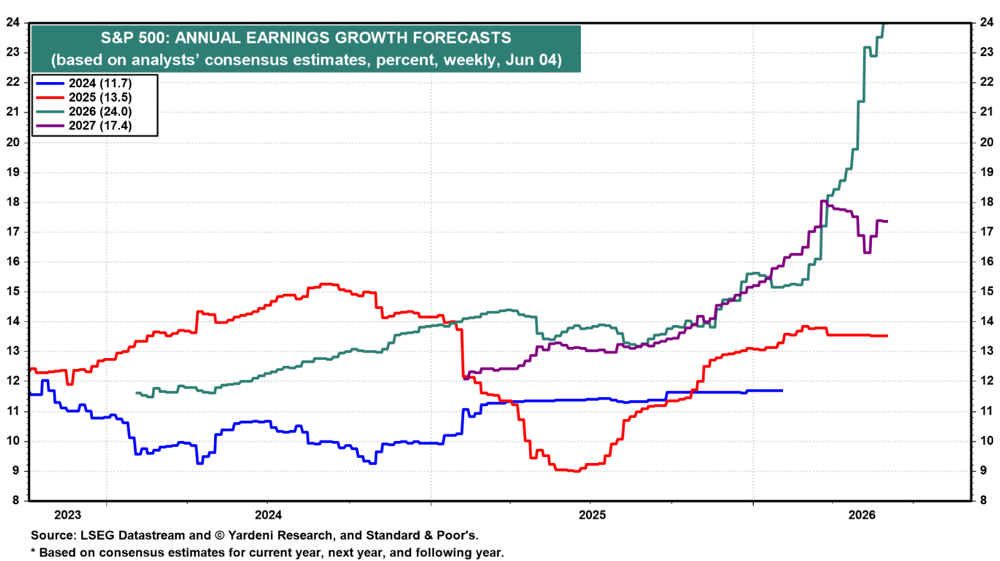
Liza takes us through 1Q earnings in more detail, focusing on our portfolio stocks and their outlooks.
It’s this acceleration in earnings growth that is driving equity markets higher, leaving valuations at a reasonable 21x.
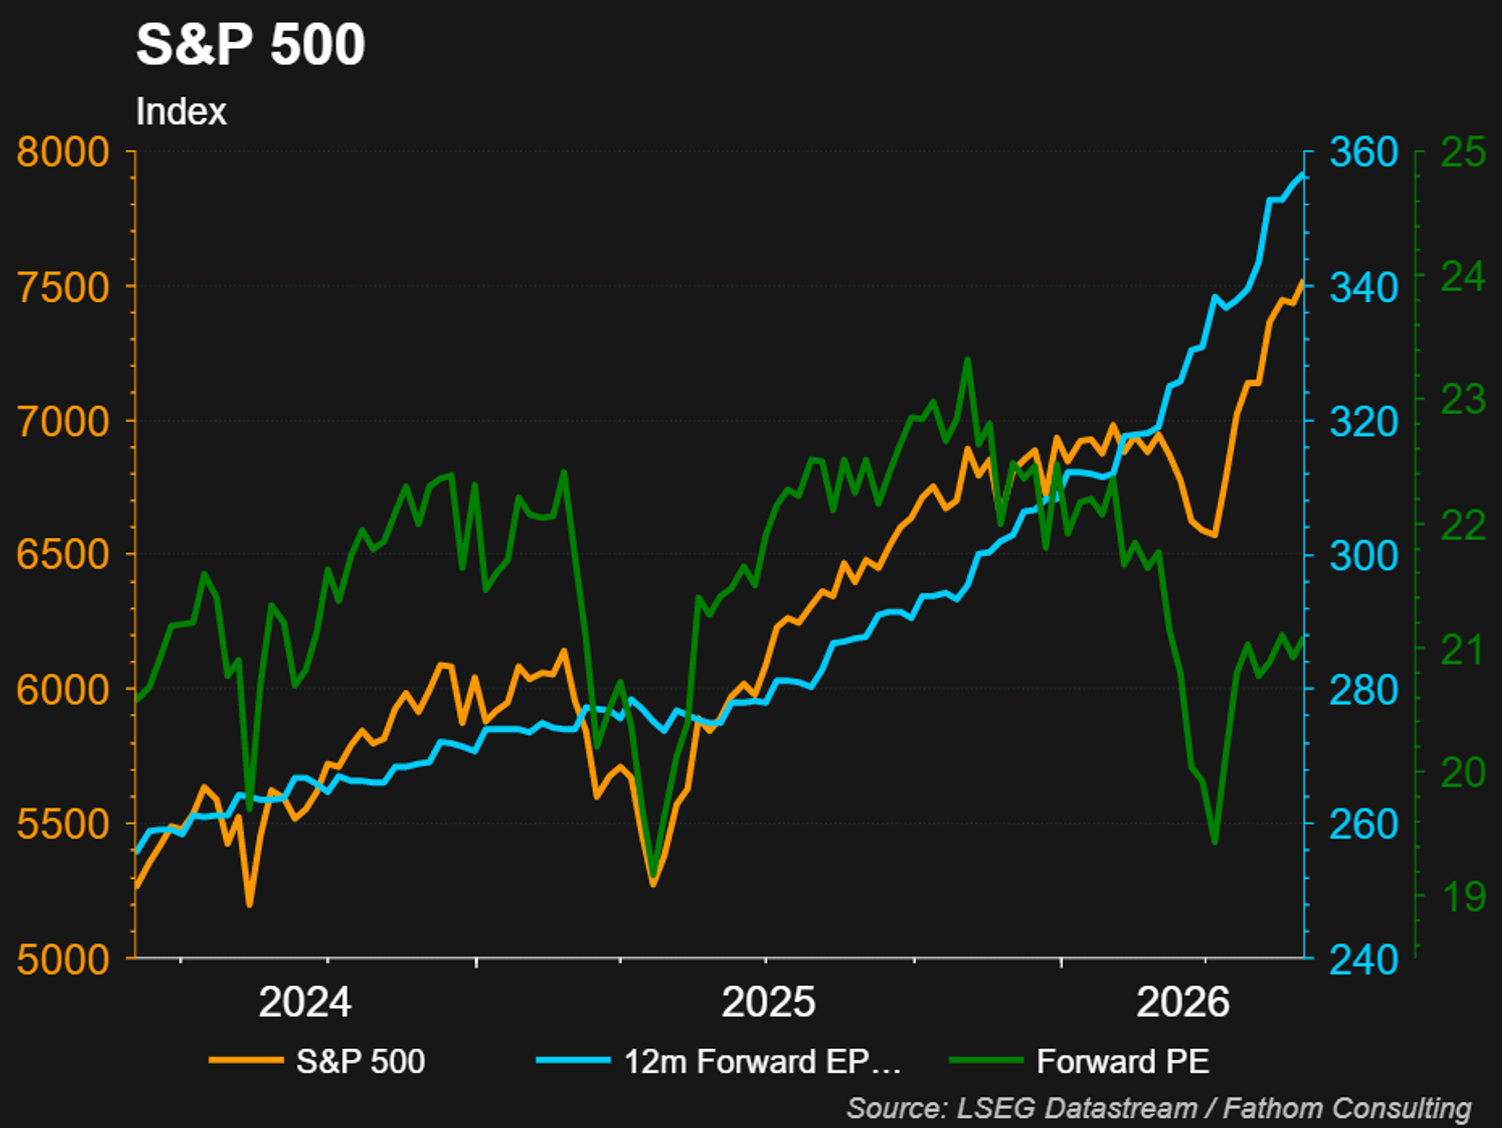
Moving ahead into the second half of the year – despite the obvious risks embedded in the continuing Middle East conflict – there remains enough earnings momentum to keep fuelling the global equity rally.
Lastly, with the hype surrounding the upcoming SpaceX IPO picking up, we walk you through our thoughts and how we are taking advantage of what stands to be the biggest IPO in history.
International section

By the Numbers
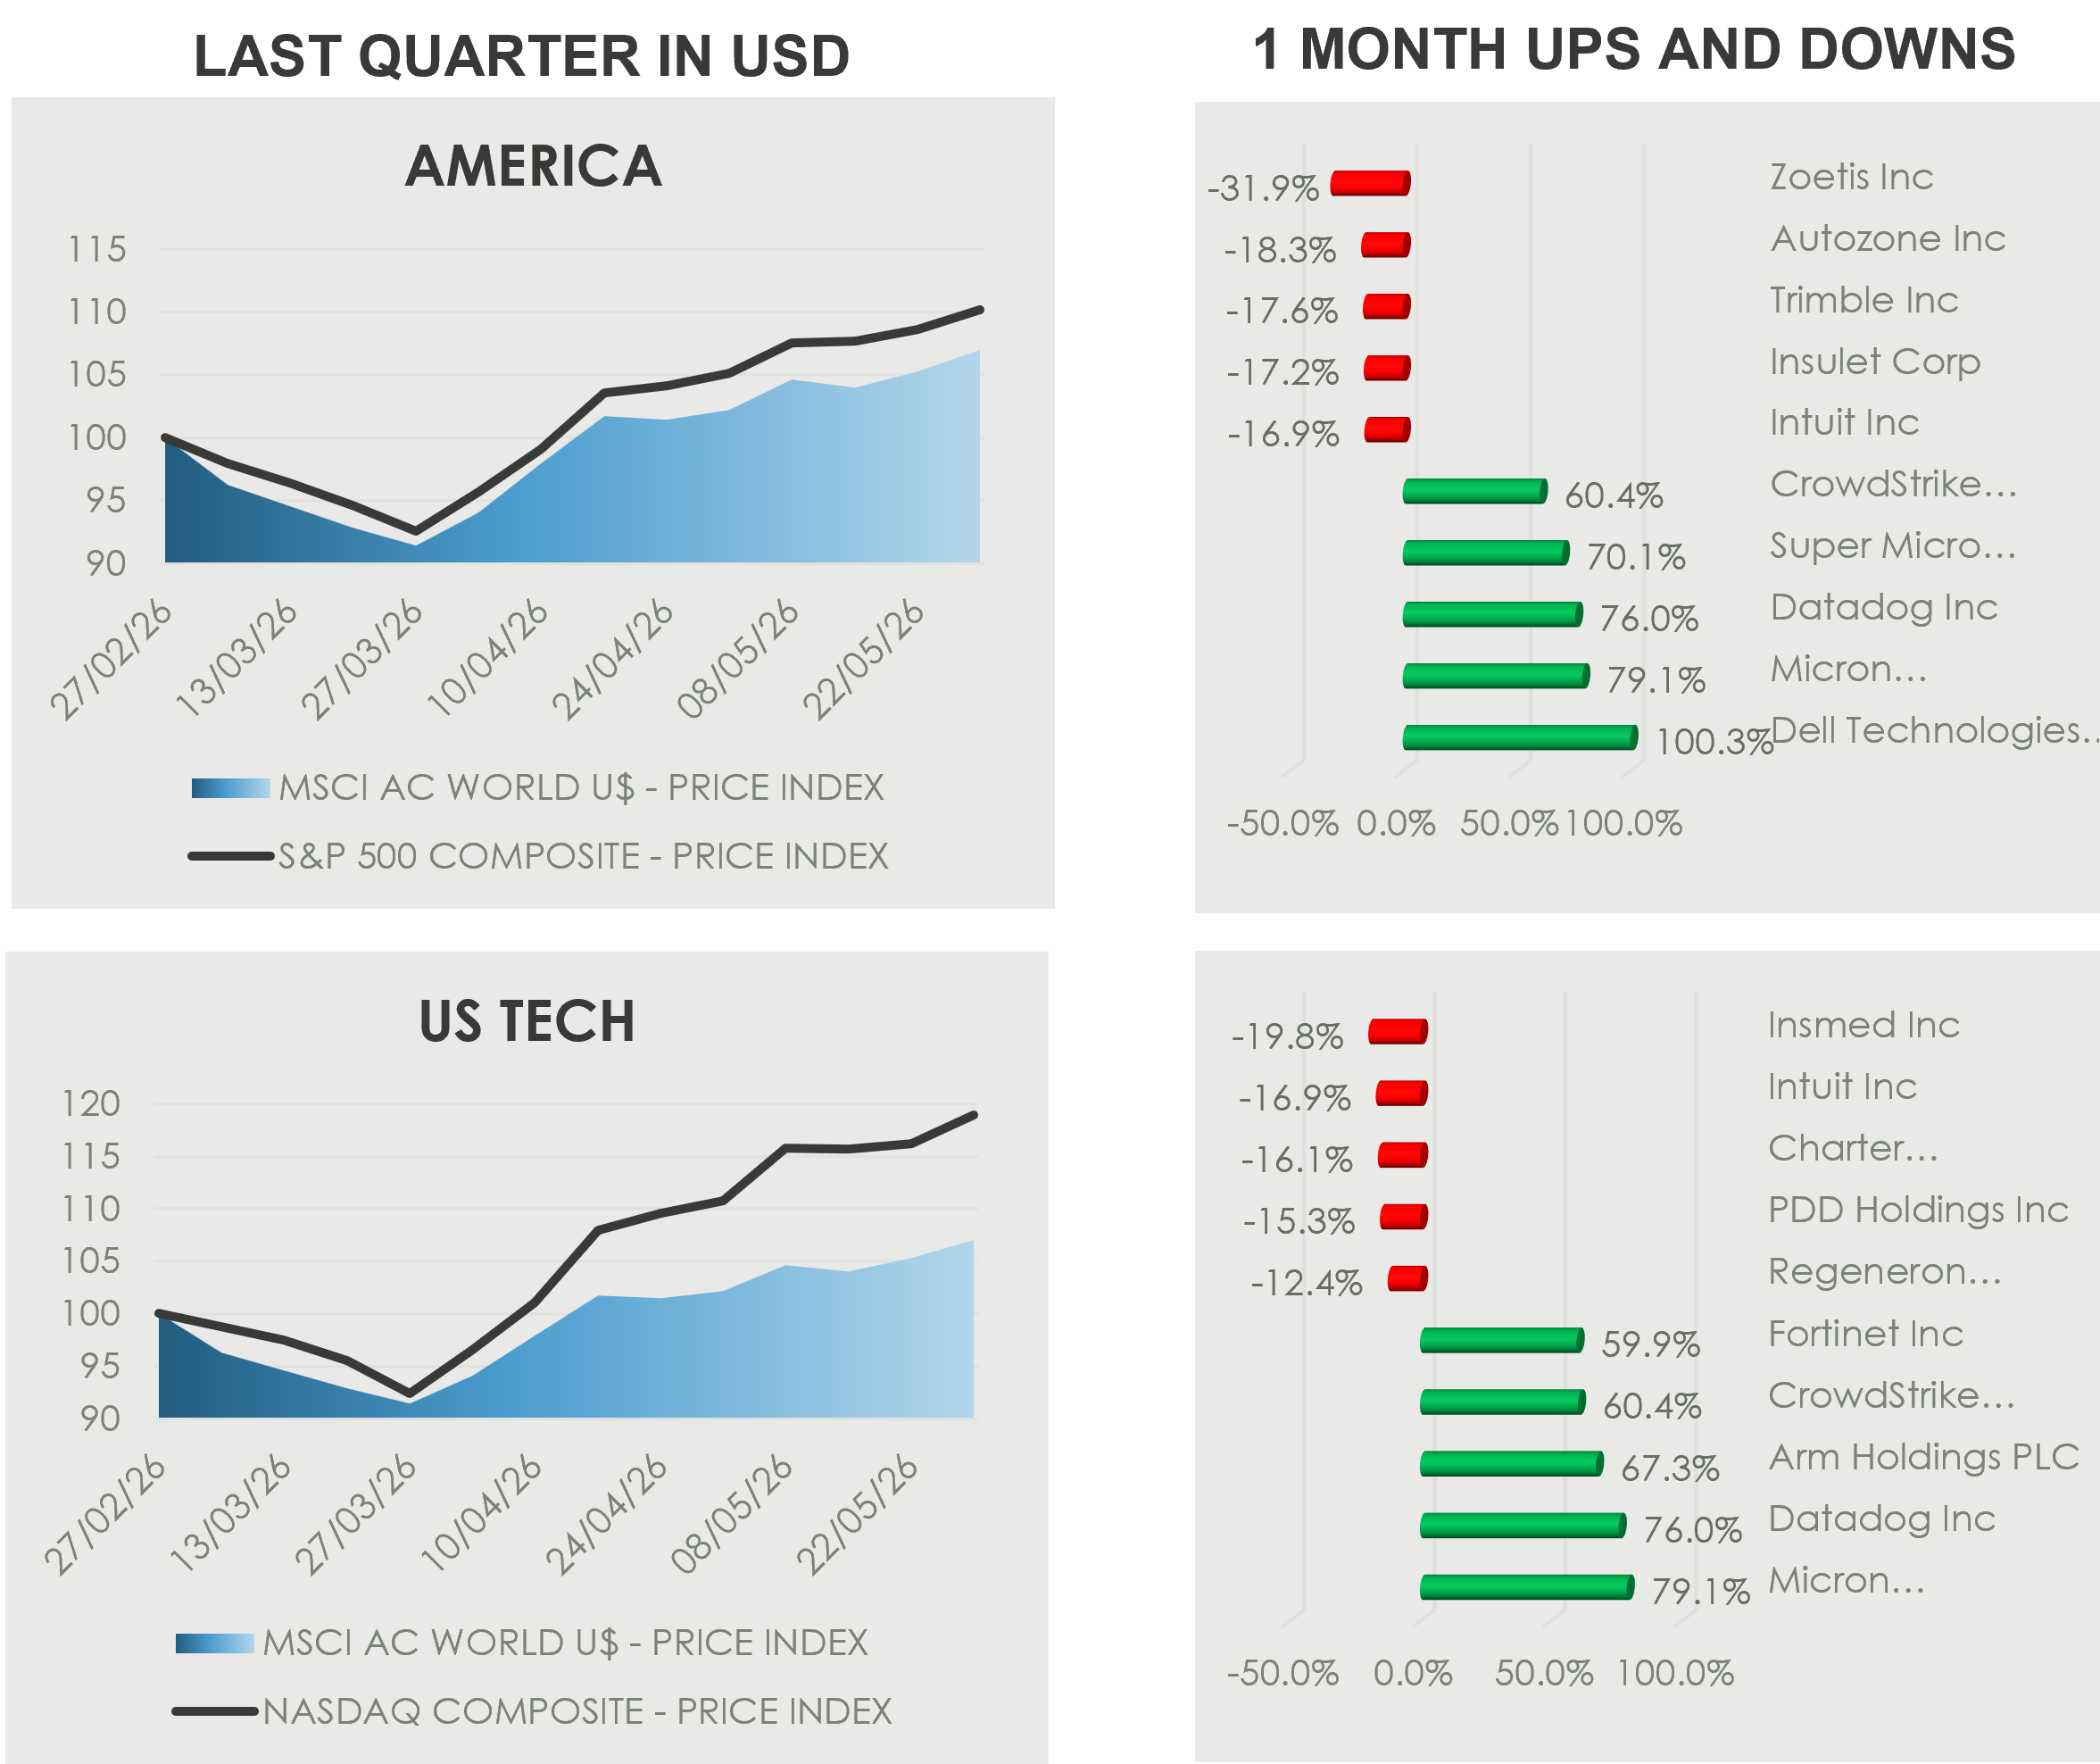
Global equities moved higher during the month, driven by continued strength in semiconductors and AI infrastructure. In the U.S., Dell (+100.3%), Micron (+79.1%), Super Micro Computer (+70.1%) and Arm (+67.3%) surged on strong AI-related demand and upbeat earnings momentum, while Datadog (+76.0%), CrowdStrike (+60.4%) and Fortinet (+59.9%) also benefitted from robust cloud and cybersecurity spending trends. By contrast, Zoetis (-31.9%) fell after the animal health company cut guidance, AutoZone (-18.3%) earnings revealed sluggish growth, and Insulet (-17.2%) after guiding to weaker-than-expected sales.
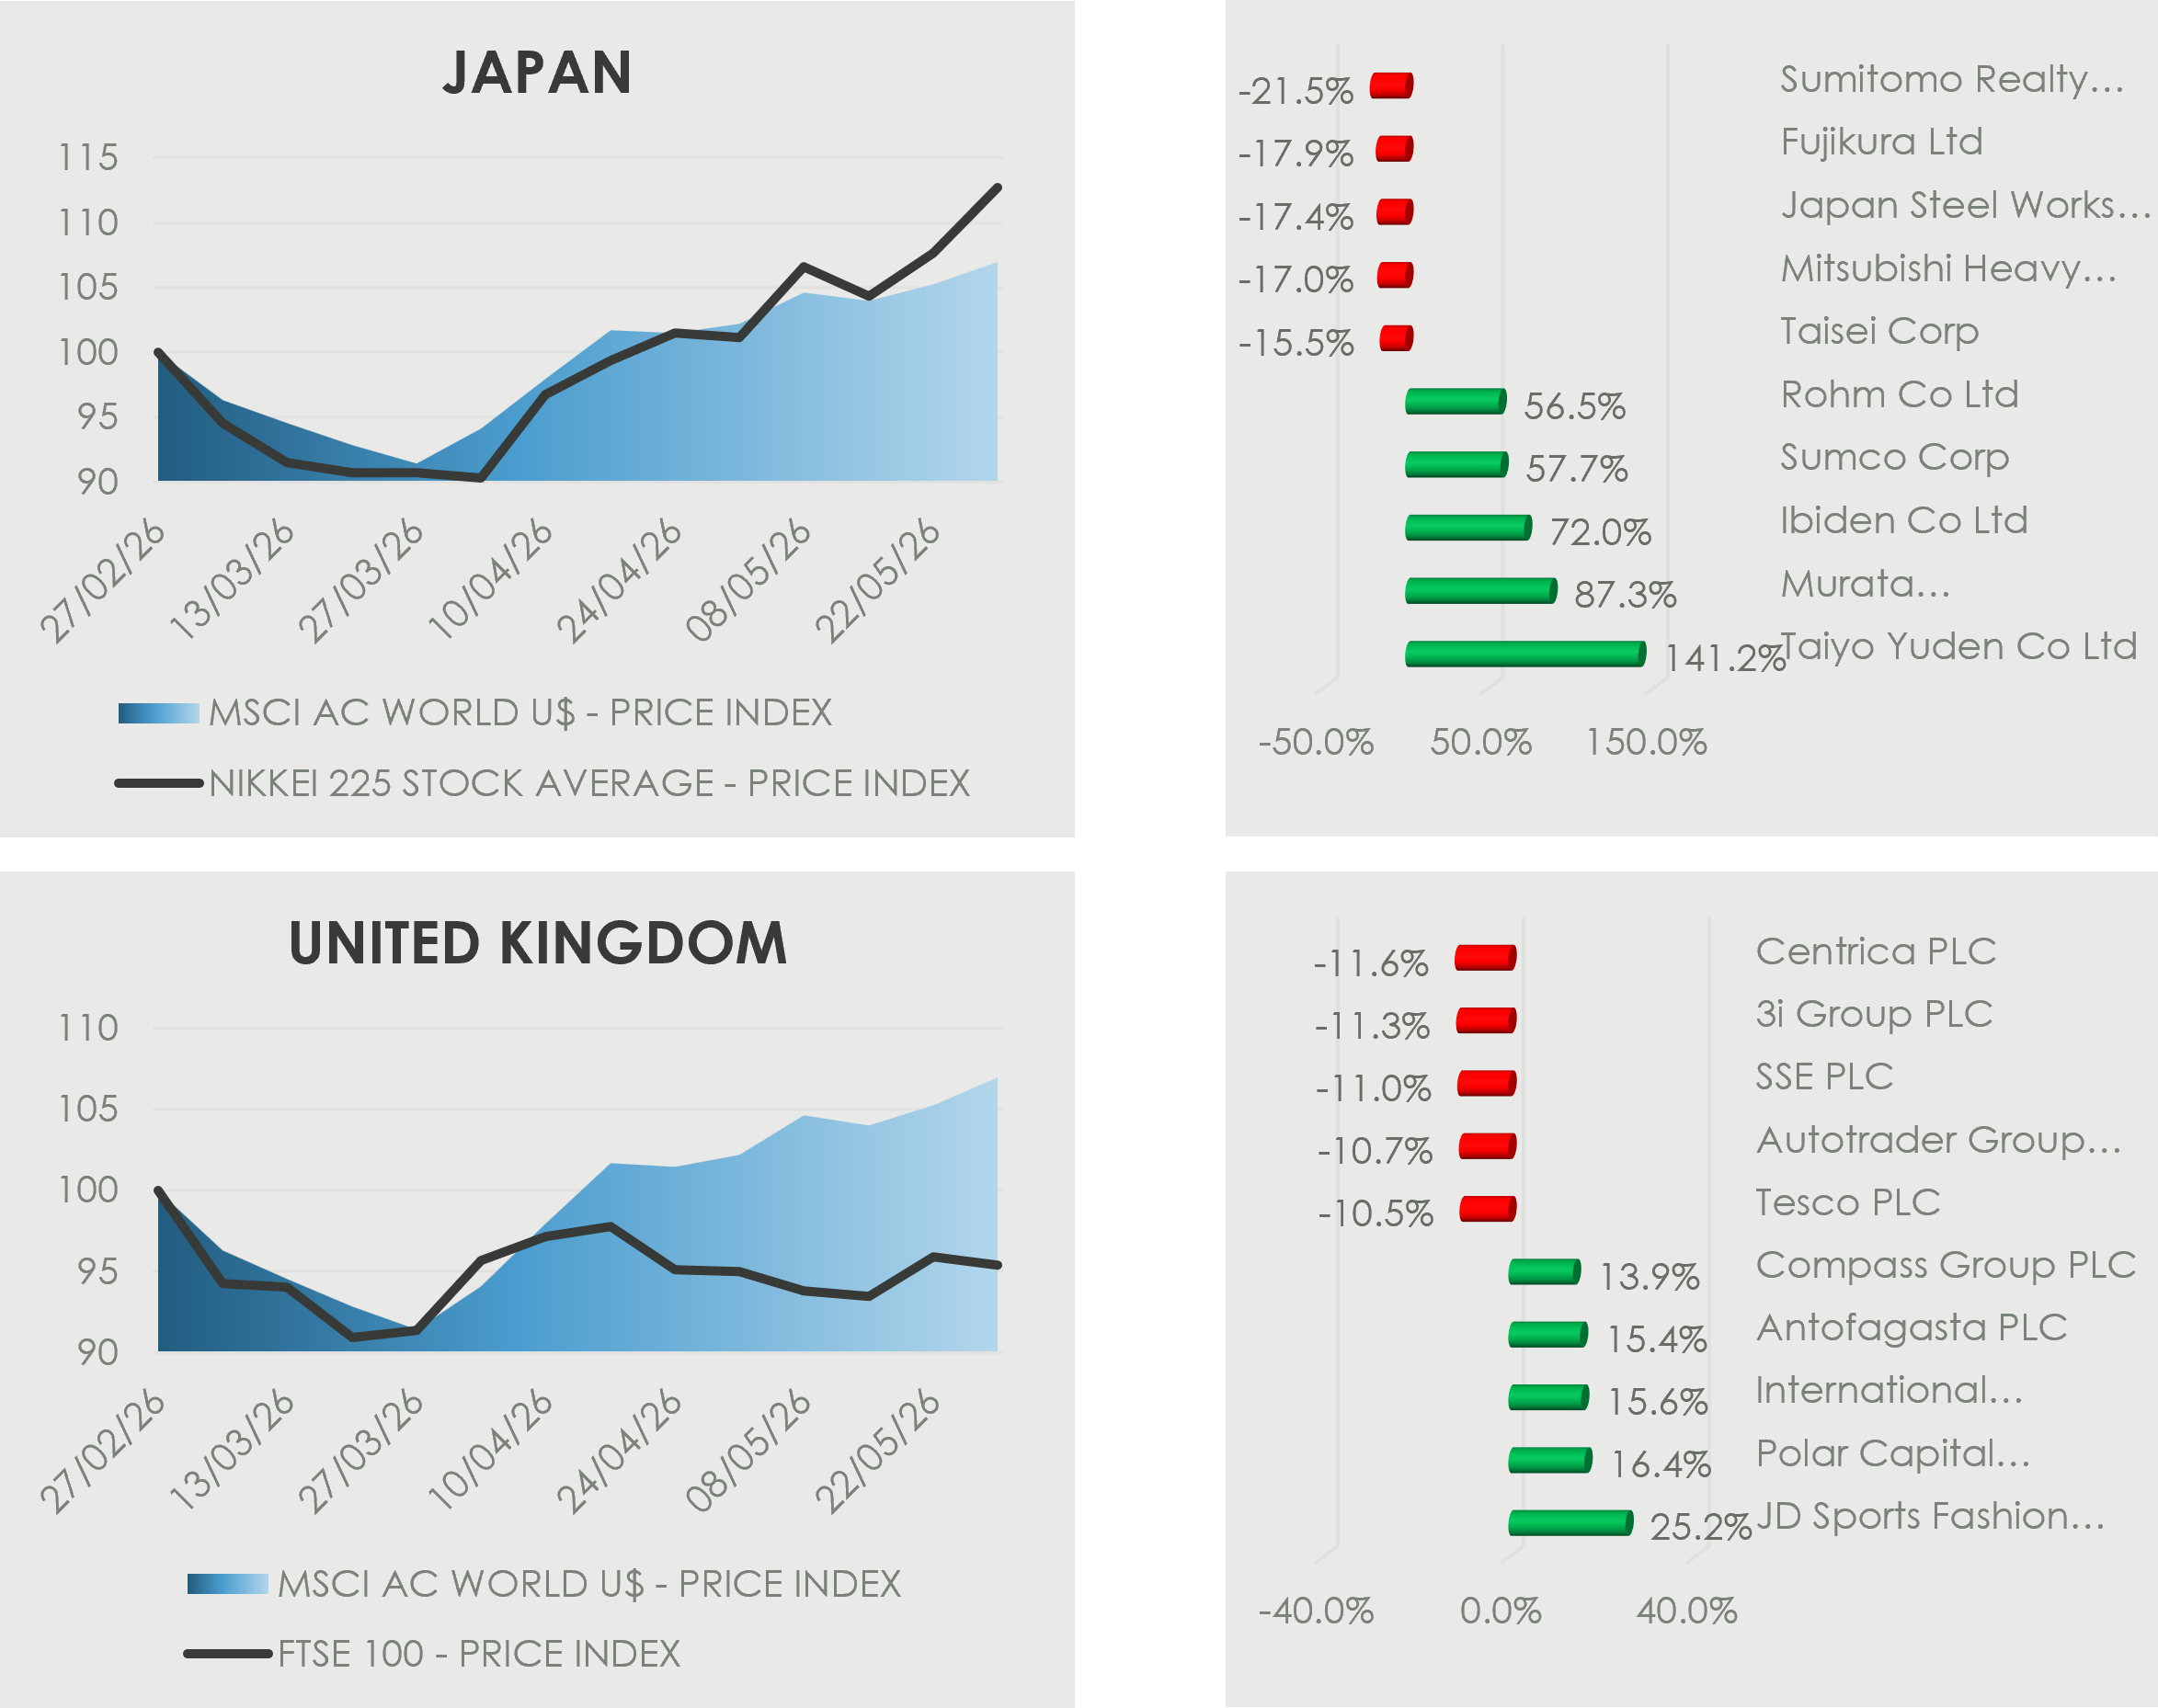
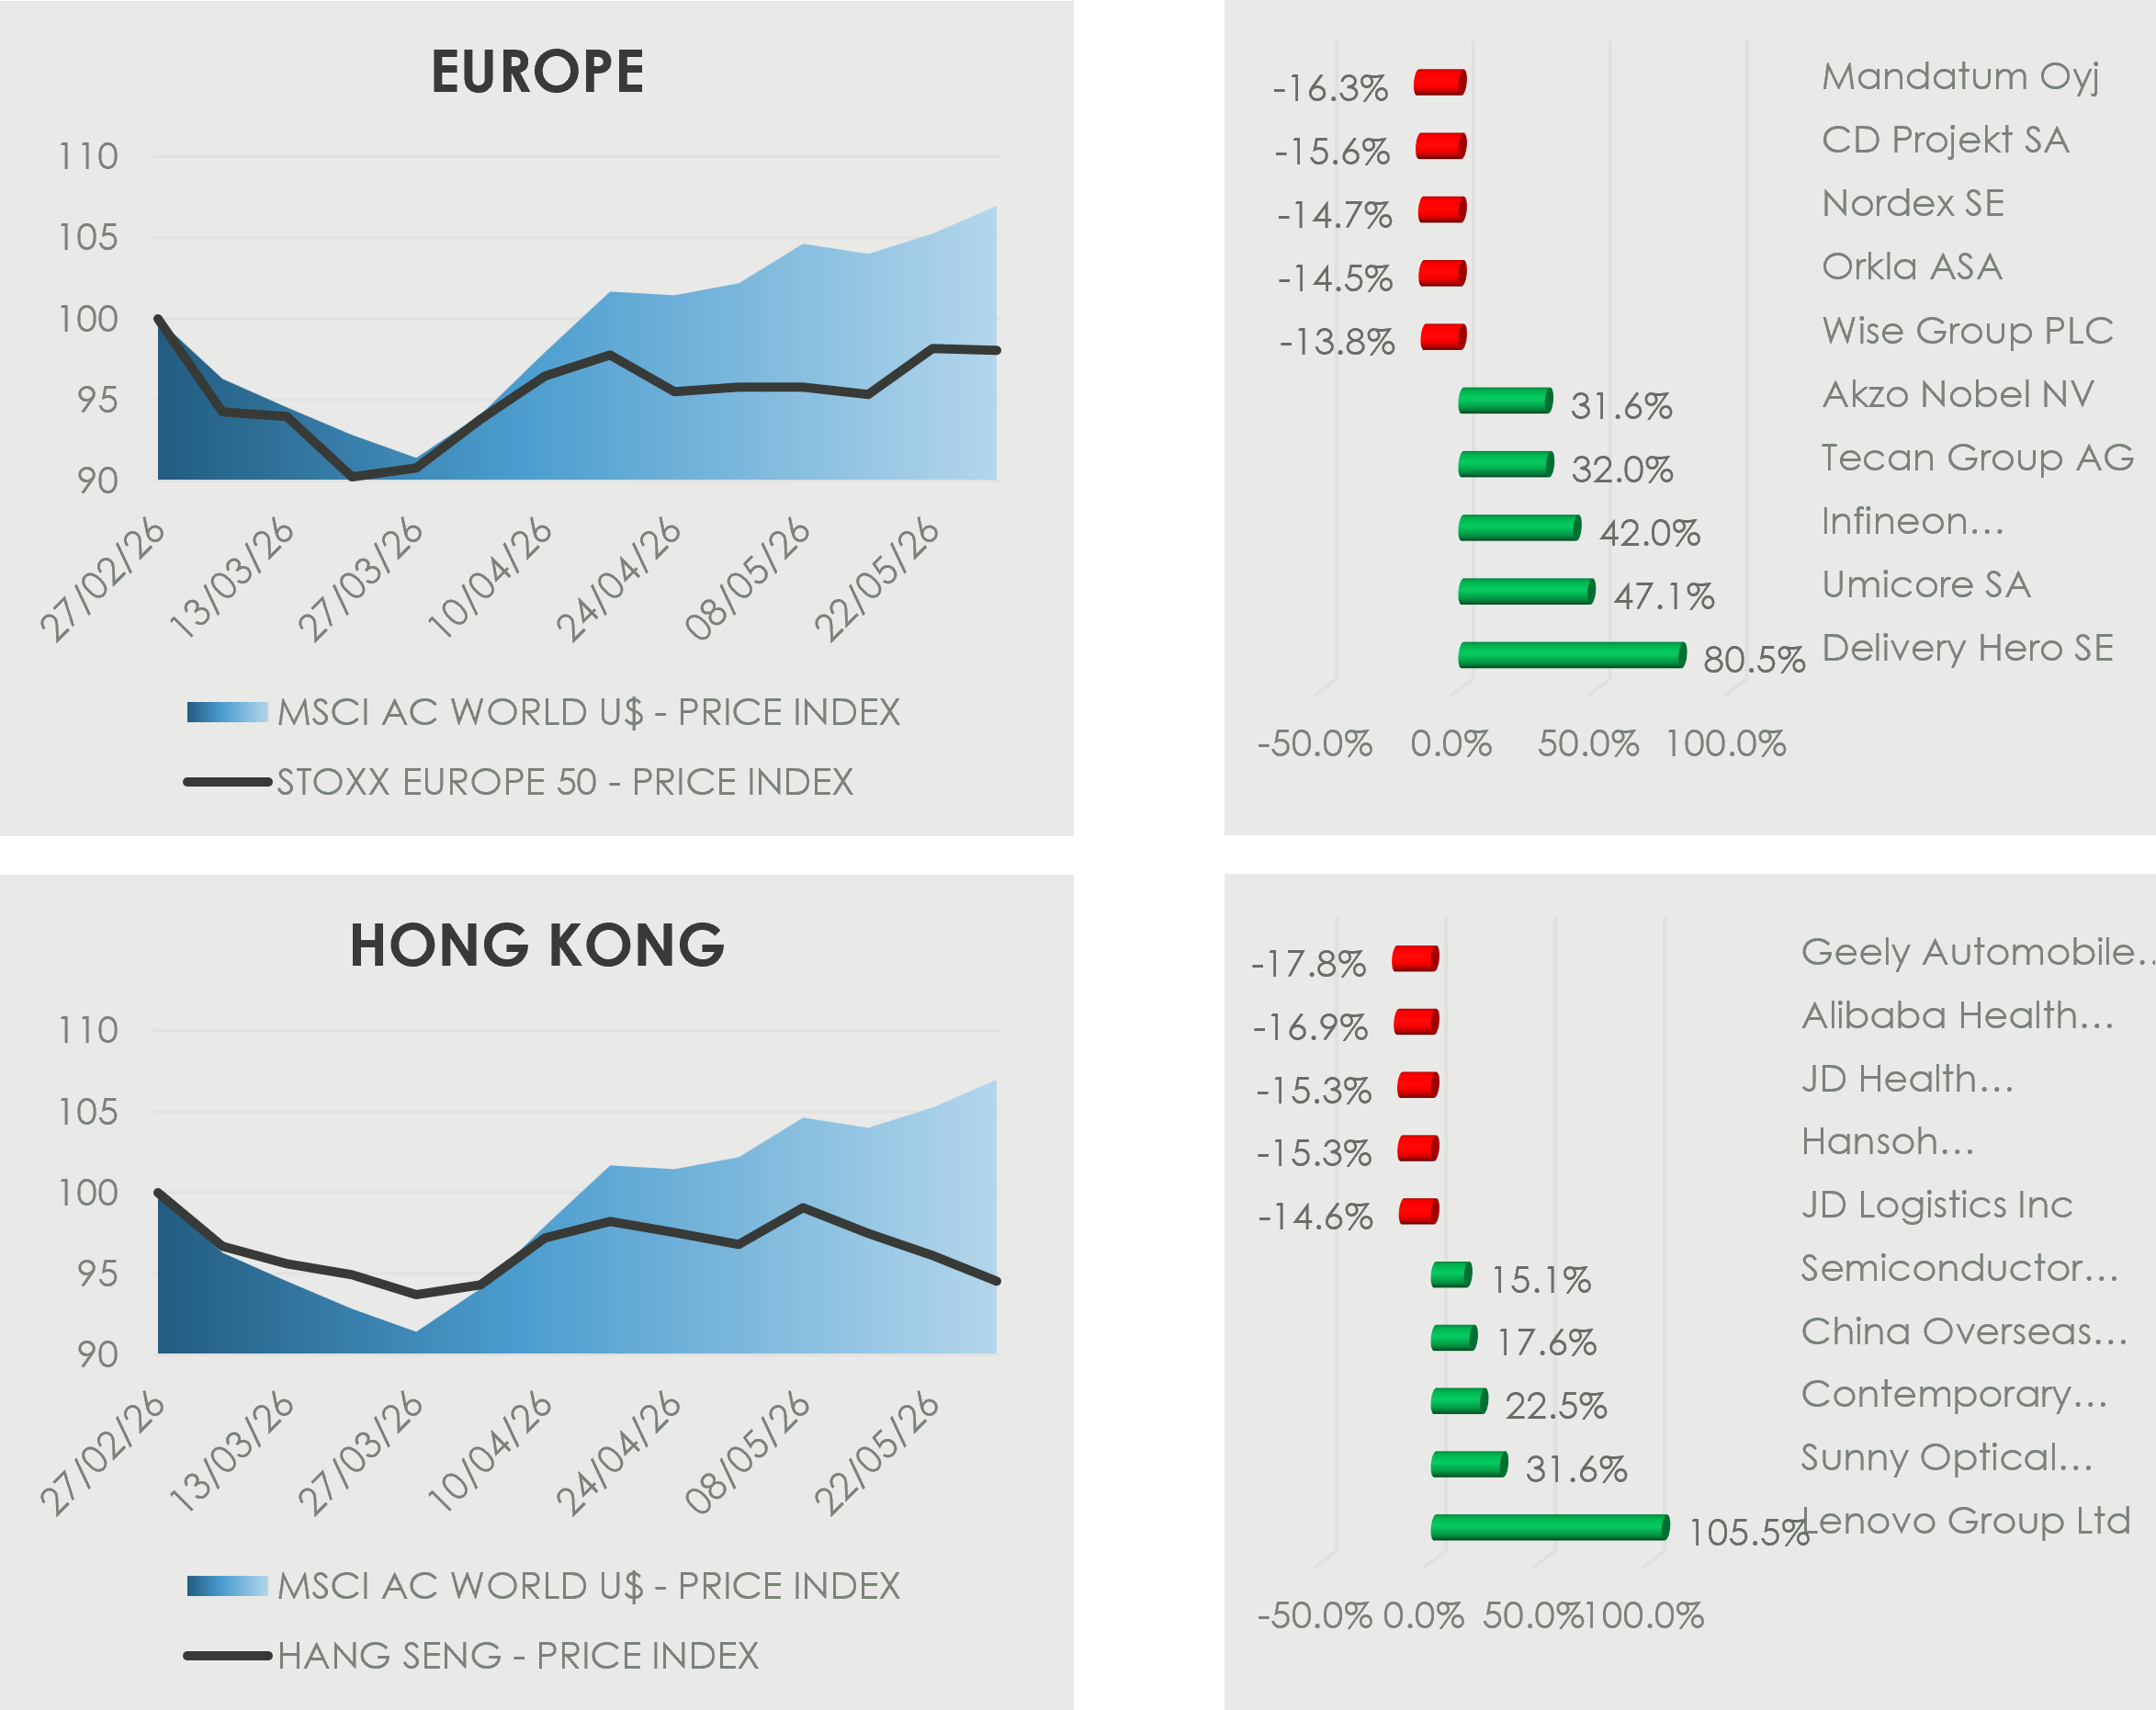
In the UK and Europe, Delivery Hero (+80.5%) rallied after a takeover bid from Uber, Infineon (+42.0%) hit record highs as semi stocks rallied on AI optimism, and JD Sports (+25.2%) rose after showing signs of improvement.
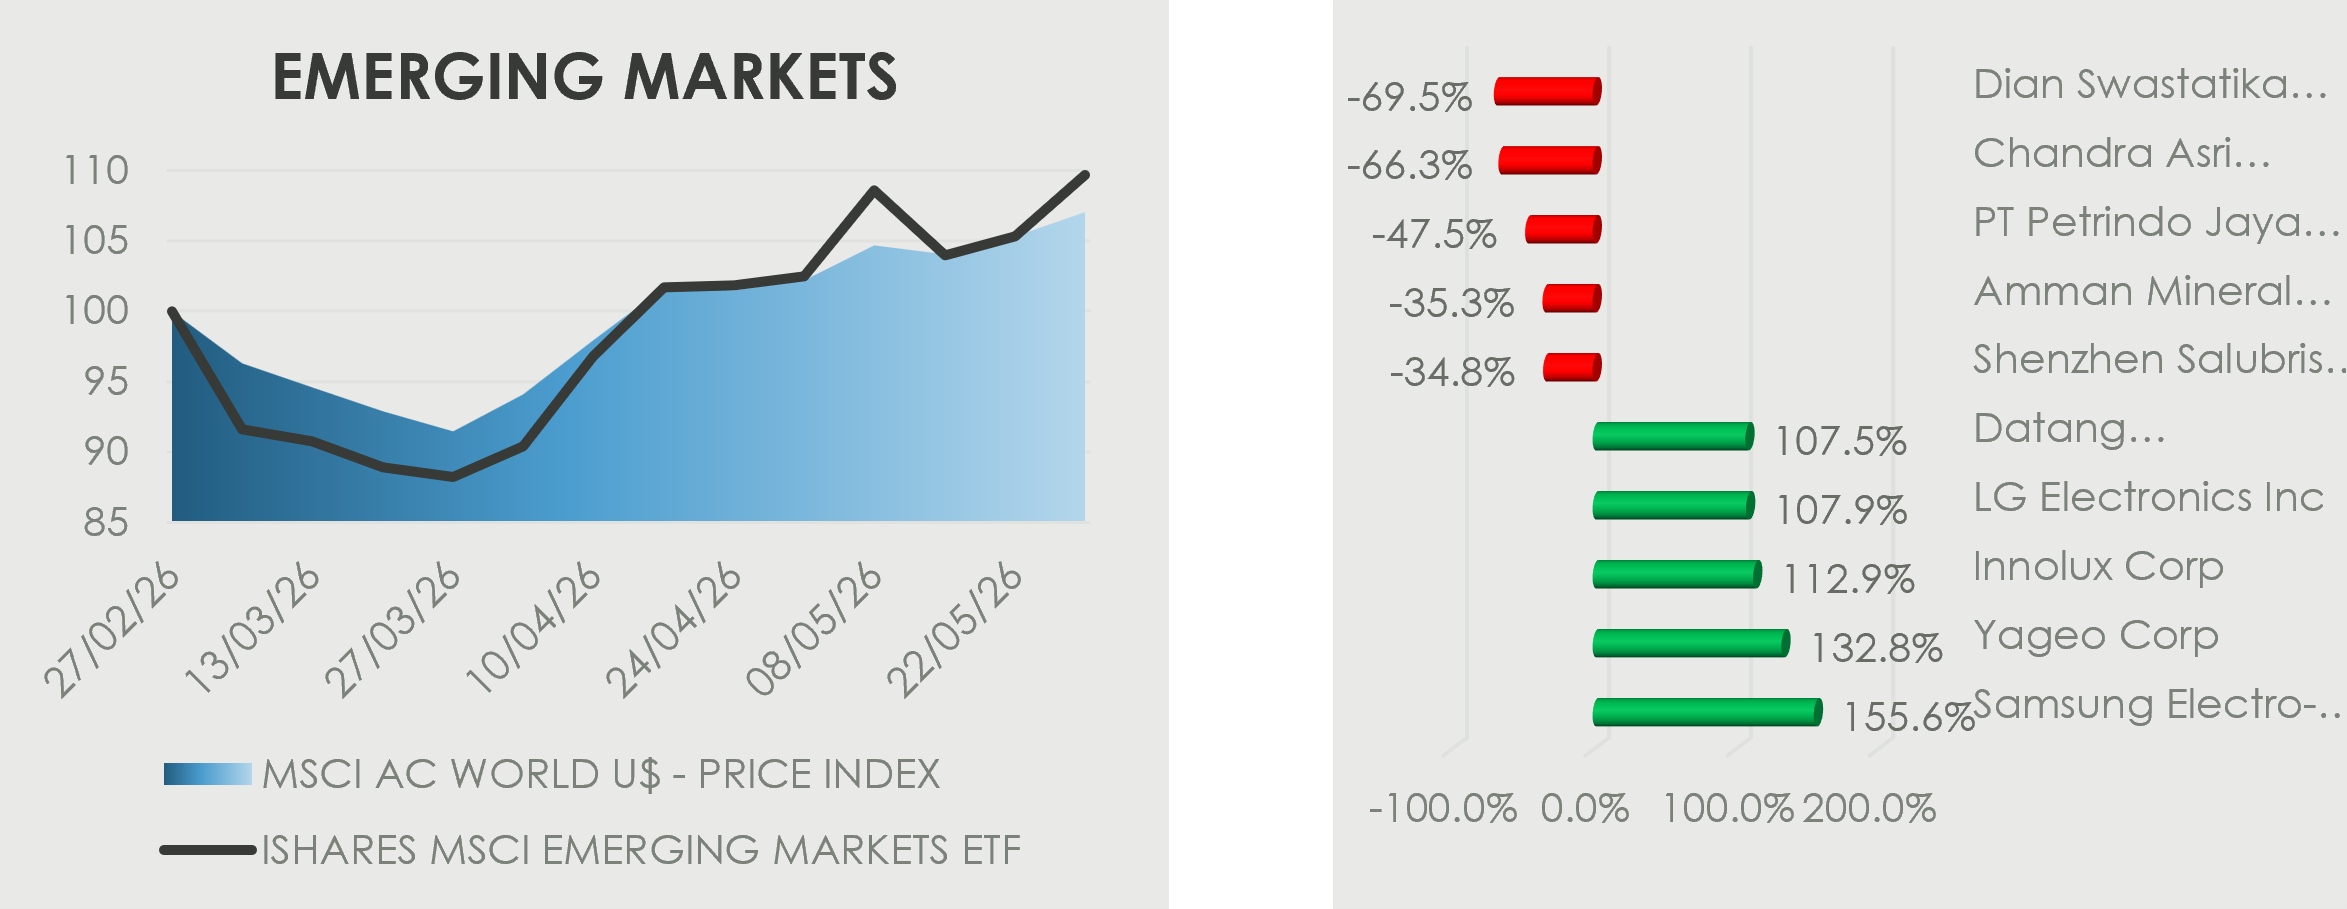
Japanese equities were led by semiconductor and electronic component suppliers, with Taiyo Yuden (+141.2%), Murata (+87.3%), Ibiden (+72.0%), Sumco (+57.7%) and Rohm (+56.5%) rallying on renewed AI-linked hardware demand. Similarly, other Asian equities were driven by tech hardware and electronics: Samsung Electro-Mechanics (+155.6%), Yageo (+132.8%), Innolux (+112.9%), LG Electronics (+107.9%), Lenovo (+105.5%), Sunny Optical (+31.6%), CATL (+22.5%), Semiconductor Manufacturing International (+15.1%). However, healthcare and e-commerce-related names were weaker, with Alibaba Health (-16.9%), JD Health (-15.3%), Hansoh Pharmaceutical (-15.3%), Geely (-17.8%) and JD Logistics (-14.6%) all under pressure amid softer consumer sentiment.
First-quarter earnings season painted a broadly robust picture; supported by accelerating earnings growth, continued consumer spending, improving capital markets activity, and another step-up in AI investment.
Tech: AI Investment Continues to Drive Growth
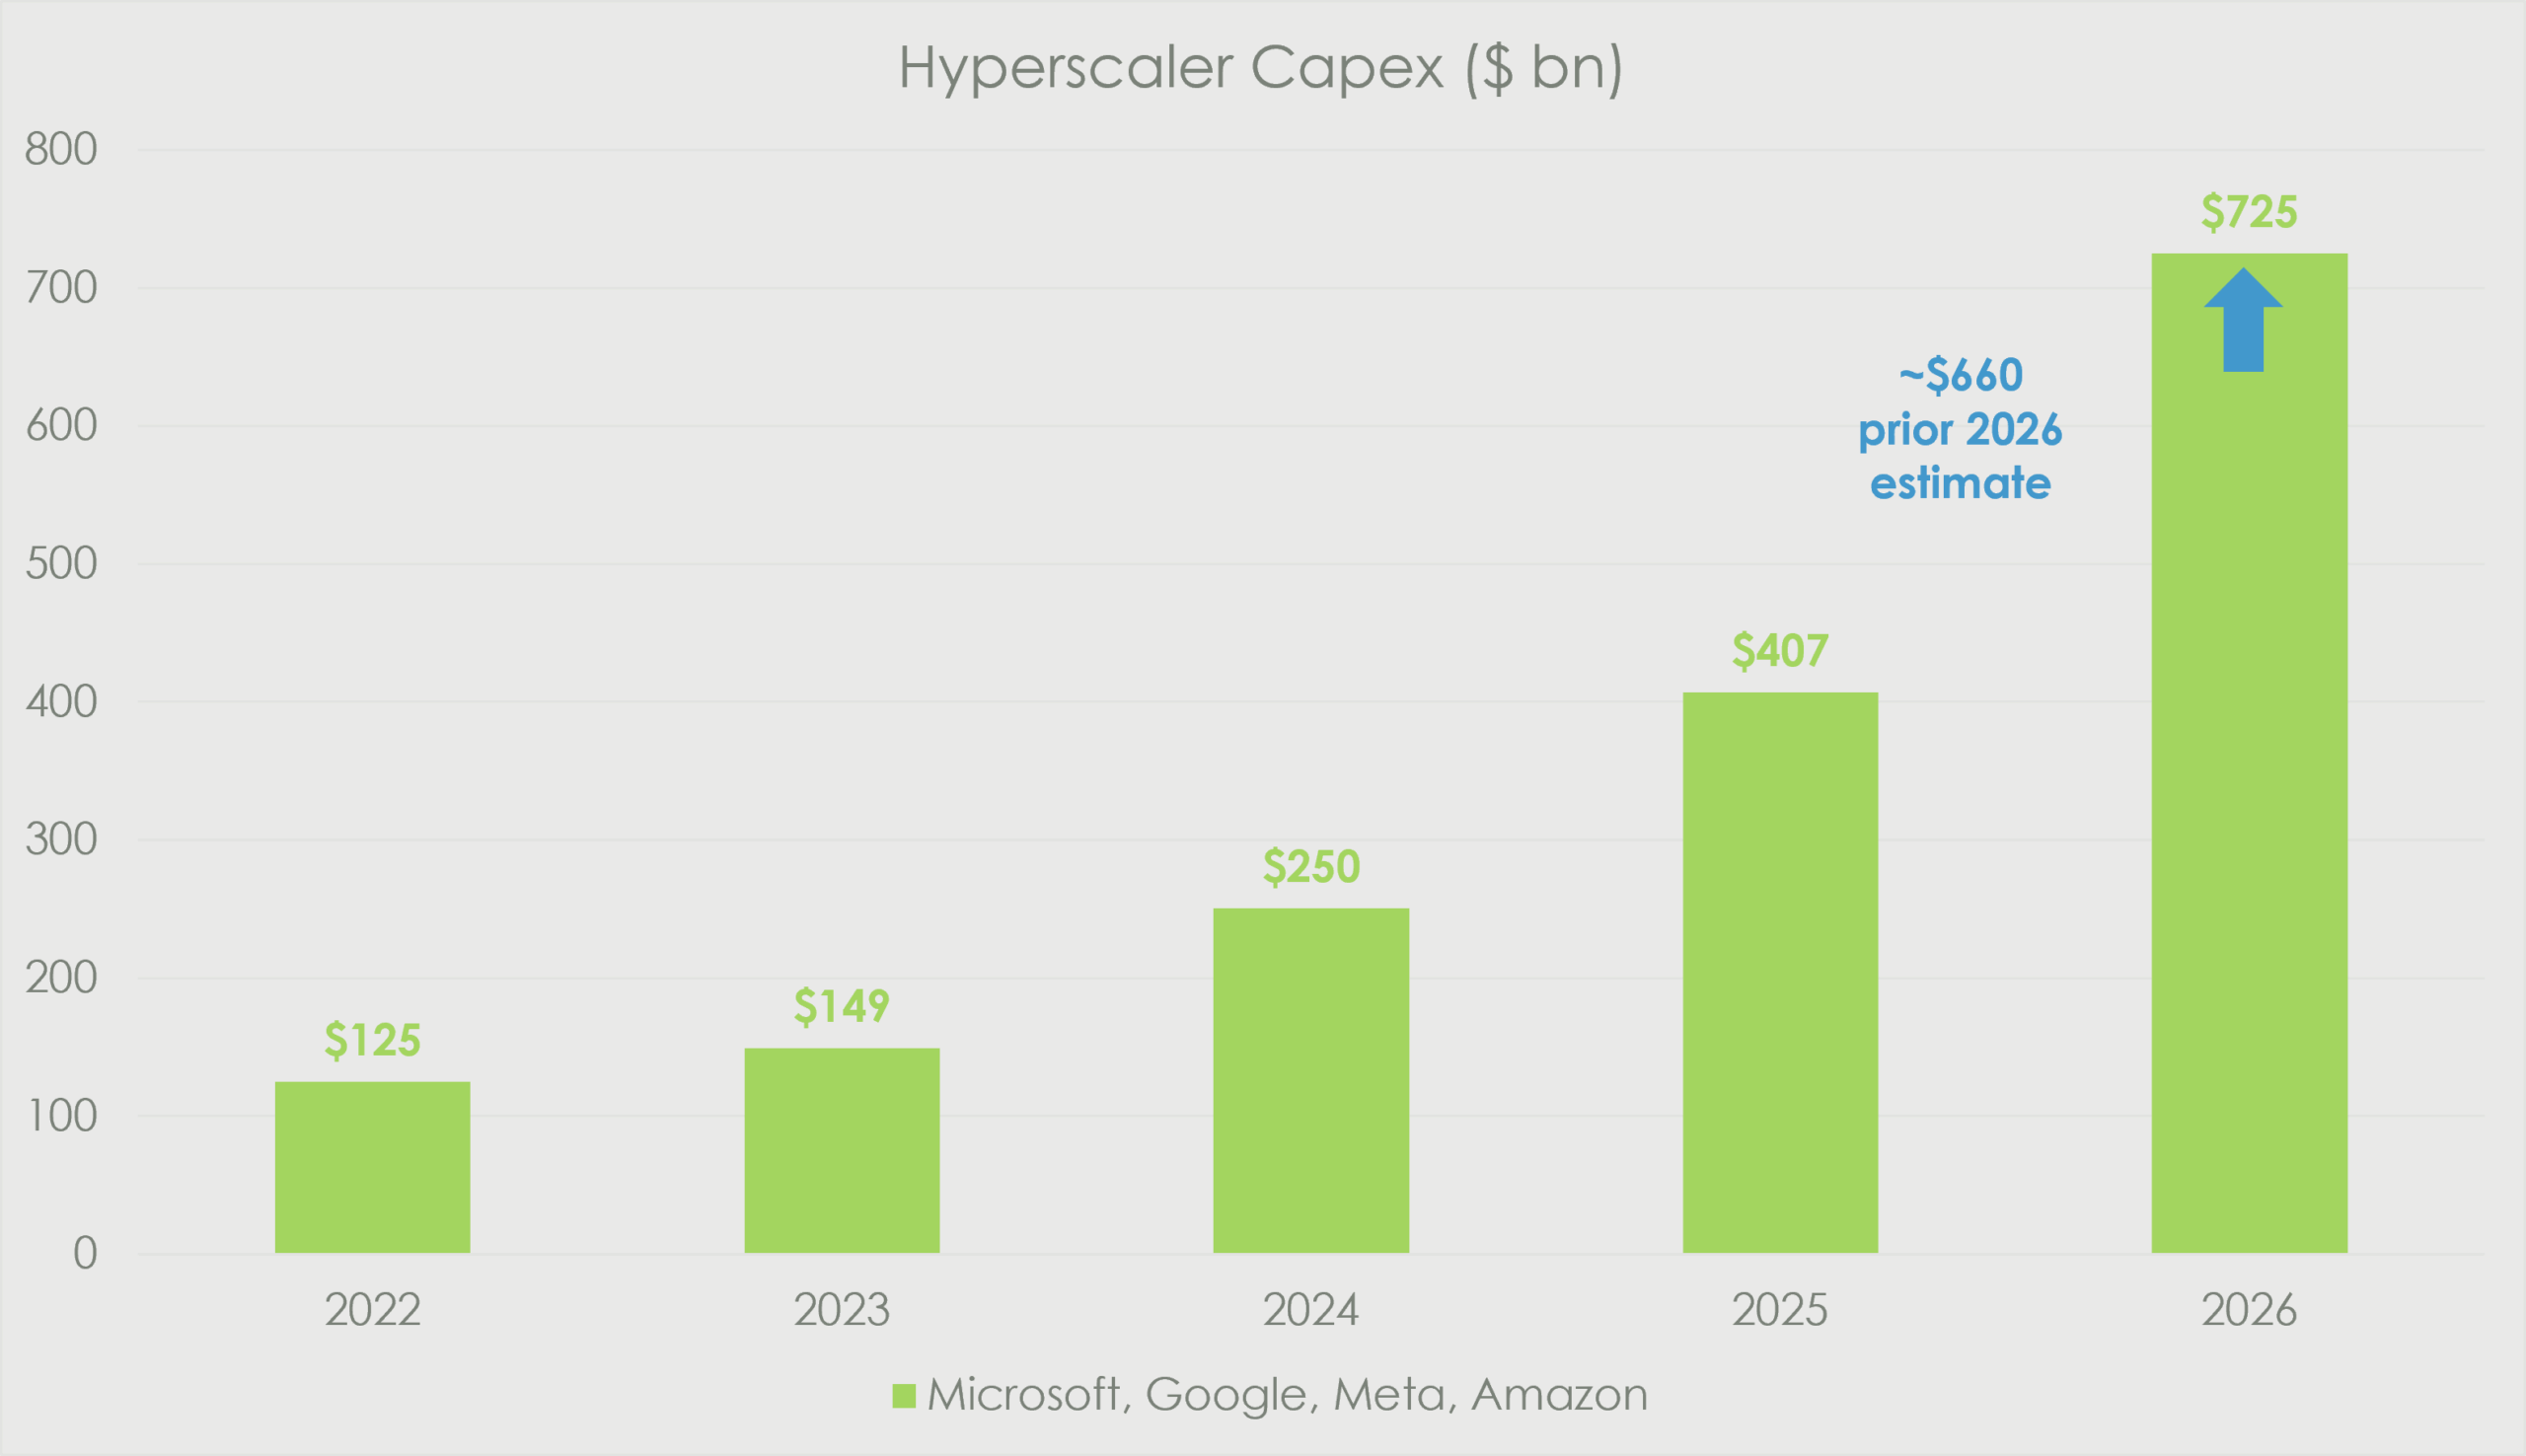
AI and cloud computing remained dominant growth engines across the tech sector, with hyperscalers continuing to invest heavily in data centres, cloud capacity and AI infrastructure. Demand for AI compute remains well ahead of available capacity; supporting strong results from cloud platforms, semiconductor manufacturers, and power-supply providers. It’s all about the physical buildout required to support AI workloads.
Alphabet reported revenue growth of 21.8% to $109.9bn, with EPS rising 82% to $5.11. The Cloud business continues to accelerate, with Cloud sales up 63% to $20.0bn. Management highlighted, “we are compute constrained in the near-term, and our Cloud revenue would have been even higher if we were able to meet demand.” Capex for the year is expected to be $190bn; more than double last year’s $91.5bn.
Microsoft delivered another strong quarter, with revenue increasing 18.3% to $82.9bn – of which Azure cloud computing grew 40% – and EPS rose 23% to $4.27. It was a record quarter driven by Cloud and accelerating AI monetization, with management repeatedly emphasizing that demand is exceeding capacity. Spending on AI infrastructure will accelerate this year, with capex expected to be $190bn vs prior guidance of $150bn.
Apple reported its best March quarter ever, with revenue increasing 16.5% to $111.2bn and EPS rising 22% to $2.01. Results were supported by strong demand for the iPhone 17 lineup, and another all-time high for Services revenue.
TSMC reinforced the strength of AI chip demand, with revenue growing 35.1% and earnings surging 58.3%. Management raised its full-year revenue outlook, and longer-term, increased its forecast for the global chip market to more than $1.5tn by 2030, up from $1tn. TSMC has been boosting capacity at a faster pace and intends to build more facilities.
Infineon raised full-year guidance, citing higher AI-related demand, improving industrial orders, and growth in areas such as grid buildout and energy storage. With some products fully booked through the next fiscal year, Infineon is well positioned as a “picks and shovels” beneficiary of the AI infrastructure buildout.
Across the tech space, we saw better-than-expected results with AI infrastructure spending continuing to surge.
Financials: Capital Markets Acceleration and Stable Credit Quality
The financial sector delivered solid performance driven by a boost in capital markets activity, as well as a favourable trading environment. Analysts kept a close eye on the health of the consumer and credit quality, which held up well. Proposed easing of U.S. bank capital rules could free up capital for lending, dividends and share buybacks, adding a tailwind to the already-improving capital markets backdrop.
Goldman Sachs reported EPS of $17.55 (+24.3%), ahead of expectations, driven by strength in investment banking and equities trading. Investment banking fees rose 48% to $2.84bn, supported by stronger capital markets activity. Looking forward, Goldman Sachs is well positioned to benefit from the upcoming wave of high-profile IPOs, with SpaceX selecting them as the lead underwriter for their upcoming IPO.
Blackstone reached a new AUM record of $1.304tn, up 11.7%, supported by strong inflows of $64.5bn for the quarter. The firm remains well positioned to deploy capital into areas such as credit, infrastructure and real assets, including data center opportunities. Management framed AI infrastructure as a key driver for the company saying, “we believe Blackstone has become the largest investor in AI-related infrastructure in the world,” and it is “going to be the single most important thing for the performance of our clients and ultimately, the growth of our business.” While private credit names have recently been pressured by concerns around redemption requests, management pushed back on negative news, arguing that redemption caps are a feature of these products rather than a sign of underlying stress.
HSBC delivered a resilient quarter, with profit before tax excluding notable items broadly stable and revenue up 3.8%. Banking net interest income guidance was raised on an improved interest rate outlook. The bank also delivered Return on Tangible Equity (RoTE) of 18.7%, its highest for nearly 20 years. Management remain confident in achieving their targets.
ING reported another strong quarter with loan growth of 8% and deposits up 4%. Management noted that they have “started the year off strongly” with continued customer growth, robust lending and deposit expansion. The bank announced a €1.0bn share buyback for the next 6 months and confirmed guidance – which was upgraded the previous quarter.
Visa traded over 8% higher for the day after reporting stronger-than-expected results, with revenue increasing 17% and EPS up 20%. Visa authorized a new $20bn share buyback program, and raised their guidance for the full year. The payment processors are likely to be a beneficiary of AI, with Agentic AI likely leading to increased transaction volumes.
Consumer Goods: Volume Growth, Pricing Power and Stable Consumer Demand
Consumer-facing companies delivered a mixed but resilient set of results. Companies showed improving volume growth and pricing power, while some categories faced pressure from lower-income consumers becoming more selective.
Unilever delivered underlying sales growth of 3.8%, driven by 2.9% volume growth and 0.9% price growth. Results showed a healthy balance between volume and price, with emerging markets and key brands supporting growth. Management reaffirmed guidance noting that pricing is expected to play a larger role in the second half of the year as they offset commodity pressures. The share price has been under pressure following the announced sale of their Foods business to McCormick & Company. A separation could sharpen Unilever’s portfolio around Beauty, Wellbeing and Personal Care, although investors appear sceptical of timing and complexity of execution.
Philip Morris reported a strong start to the year, supported by continued growth in its smoke-free portfolio and robust pricing. Smoke-free products represented 43% of total net revenues, up almost two percentage points year-over-year, with growth led by IQOS, ZYN and VEEV. The company continues to benefit from the structural shift in its portfolio and international growth.
Nike’s results were more mixed. Results were stronger-than-expected; however, commentary was still cautious. Revenue was $11.3bn, flat year-over-year, with margins lower due to higher tariffs. Management noted that its turnaround actions are improving the health of the business, but the recovery is still uneven across regions and channels. Nike remains a turnaround story with the CEO noting, “The work is not finished, but the direction is clear, our teams are moving with focus and urgency, and our foundation is getting even stronger to build the future of Nike.”
LVMH reported Q1 revenue of €19.1bn, down 6% on a reported basis but up 1% organically. As expected, management noted a deterioration in mall traffic in the Middle East – which accounts for about 6% of sales. Fashion & Leather Goods remained under pressure, down 2% organically, while Watches & Jewellery (+7%) delivered stronger growth.
Summary and Outlook
Looking ahead, the key risks remain inflation, interest rates, and geopolitical tension. However, based on Q1 results, earnings growth remains strong and the equity backdrop continues to be supported by strong fundamentals.

SpaceX is positioned to become one of the most historic and largest Initial Public Offerings (IPOs) in financial history. The official listing date will likely be June 12th.
The overwhelming excitement surrounding this listing is driven by the fact that SpaceX is a truly unique enterprise with virtually no direct competition in the specialized sectors it operates. The corporation consists of three high-quality, robust operating units that are valuable businesses in their own right:
- SpaceX Launch Services: The core division focused on launching satellites and rockets into space.
- Starlink: The rapidly expanding global satellite internet solutions provider.
- xAI: The newly integrated Large Language Model (LLM) and artificial intelligence business unit.
Market Demand & Valuation Dynamics
Early pricing indications point to an implied institutional value for SpaceX north of $1.75 trillion. In high-profile market events like this, massive retail investor appetite often drives momentum so rapidly that traditional valuation metrics are temporarily shifted to the sidelines. Consequently, there is little doubt among analysts that the stock will experience a substantial first-day trading surge over its initial IPO price.
Core Retail Risk: Allocation & Open-Market Volatility
Despite the massive upside potential, everyday retail investors face a major structural obstacle: price exposure risk.
Institutional Barrier: Primary allocations of highly anticipated IPO shares are almost exclusively granted to large U.S. institutional investors. The general public is forced to wait and acquire shares on the open secondary market, leaving retail buyers vulnerable if the stock pops aggressively at the open and subsequently drops.
Case Study: The Cerebras Cautionary Tale
This exact retail risk was vividly illustrated during the recent, highly anticipated public listing of Cerebras, a prominent AI infrastructure company.
- IPO Offering Price: $180
- U.S. Exchange Opening Price: $350
- Subsequent Pullback: $214.94 (corrected over the last two weeks)
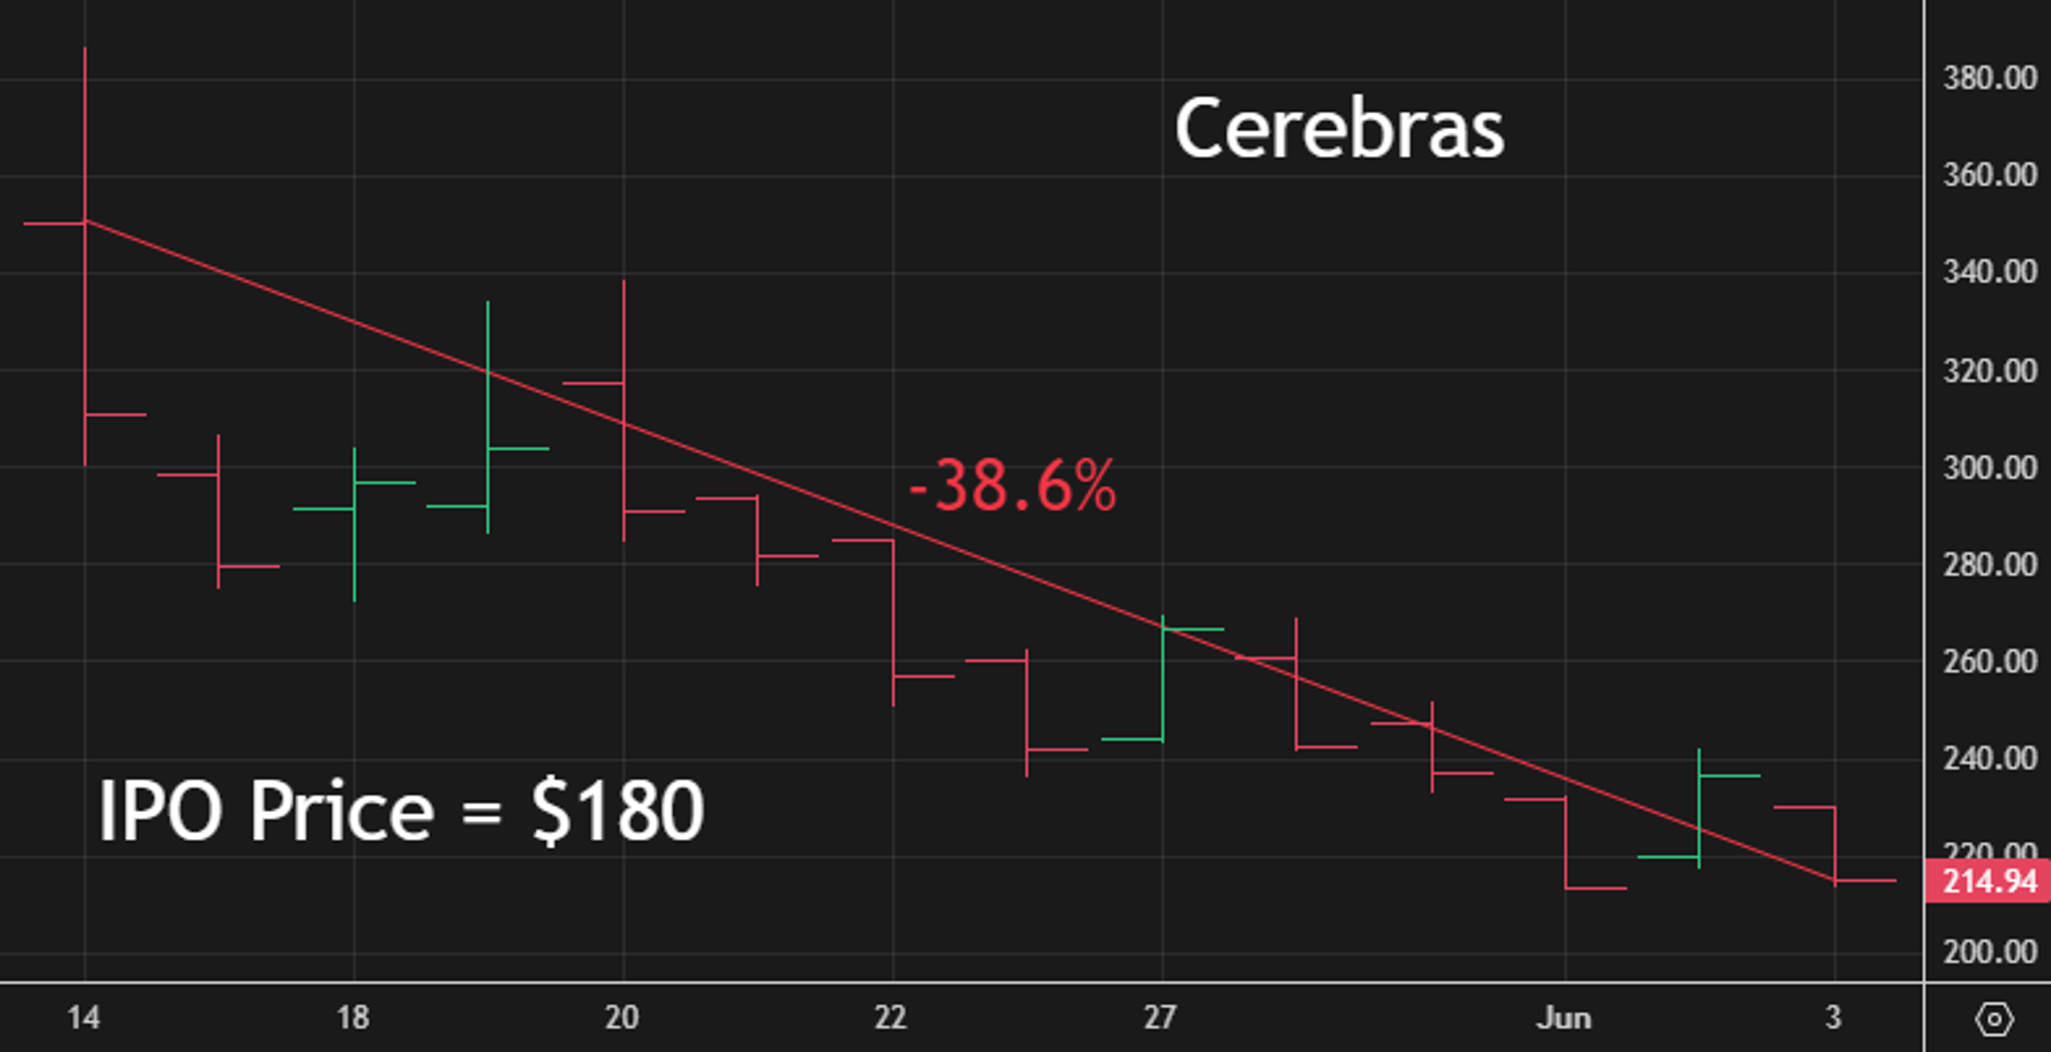
Because of this immediate volatility, investor returns diverged drastically based entirely on their institutional access:
- Allocated Investors (In at the $180 IPO price): Currently up 19.4%.
- Retail Investors (In at the $350 market open): Currently down 38.6%.
Strategic Alternative: Buying SMT for Pre-IPO Access
To minimize the open-market pricing risk of a direct SpaceX purchase, investors can utilize a specialized proxy vehicle: Scottish Mortgage Investment Trust (SMT). SMT is a publicly listed investment trust explicitly focused on backing high-conviction companies at the forefront of structural global change.
Portfolio Breakdown
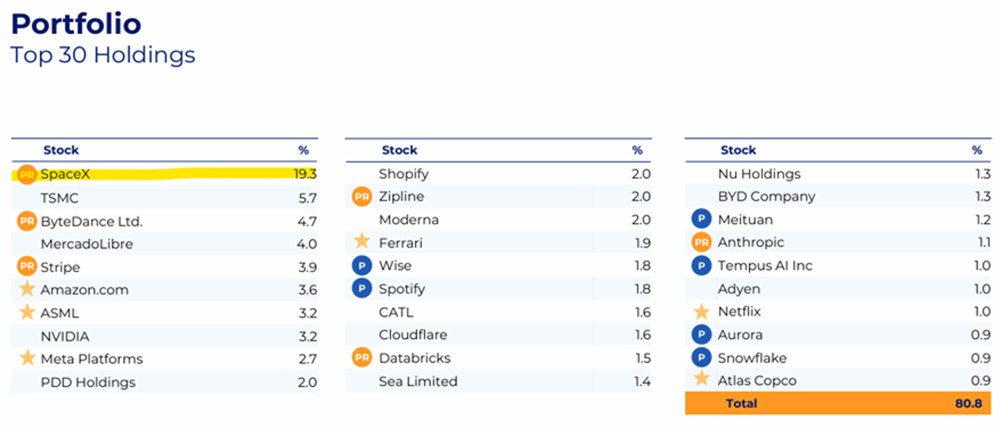
SMT’s mandate allows it to hold a diversified portfolio of both public (listed) and private (unlisted) companies. What makes SMT uniquely attractive right now is its massive private stake in SpaceX. Based on SMT’s internal metrics, this privately held SpaceX position makes up approximately 19.3% to 20% of SMT’s total portfolio.
Net Asset Value (NAV) Premium and Discount Trends
SMT currently trades at a share price of GBP 14.42 (as of 18 May), which represents a tight 2% premium relative to its underlying Net Asset Value (NAV).
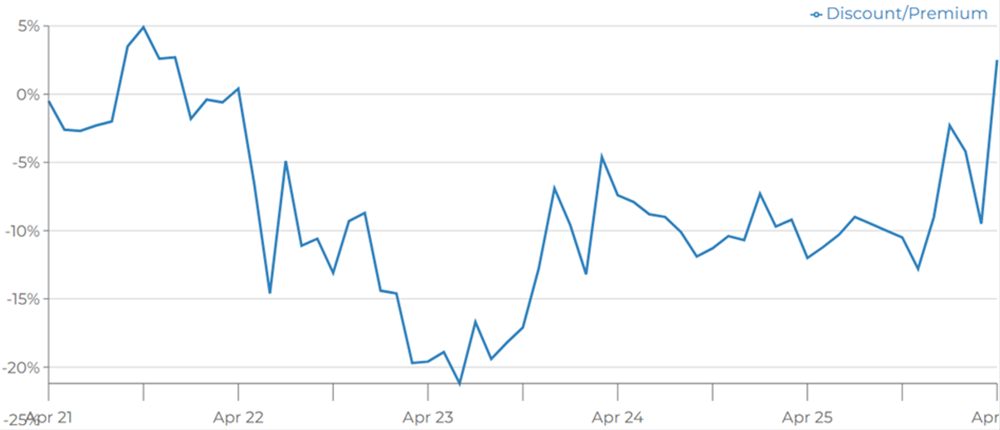
The trust’s premium/discount has historically fluctuated between +5% and -20%.
- Historical Average: The long-term tracking average sits at a -5% discount.
The swing into a 2% premium indicates that the broader market is actively pricing early optimism into SMT ahead of the imminent SpaceX public debut.
Valuation Arbitrage Scenarios
SMT currently factors SpaceX into its official NAV calculations using a private valuation baseline of $1.2 trillion. If SpaceX hits the widely speculated $2.0 trillion valuation mark when it crosses into public markets, it triggers an immediate mathematical revaluation for SMT holders:
- NAV Increase: A public valuation bump to $2 trillion instantly drives SMT’s underlying NAV upward by 13%.
- Implied Discount: This adjustment effectively shifts the current SMT entry price into an implied 12% discount to NAV, presenting immediate embedded upside for early buyers.
Summary Conclusion
Investing via SMT grants retail participants direct exposure to the highly anticipated first-day trading upside of the SpaceX public launch. It offers a rare, institutional-grade opportunity to capture pre-IPO valuations, maximizing initial pricing upside while strictly bounding the downside execution risks that typically plague retail investors during mega-listings.

By the Numbers
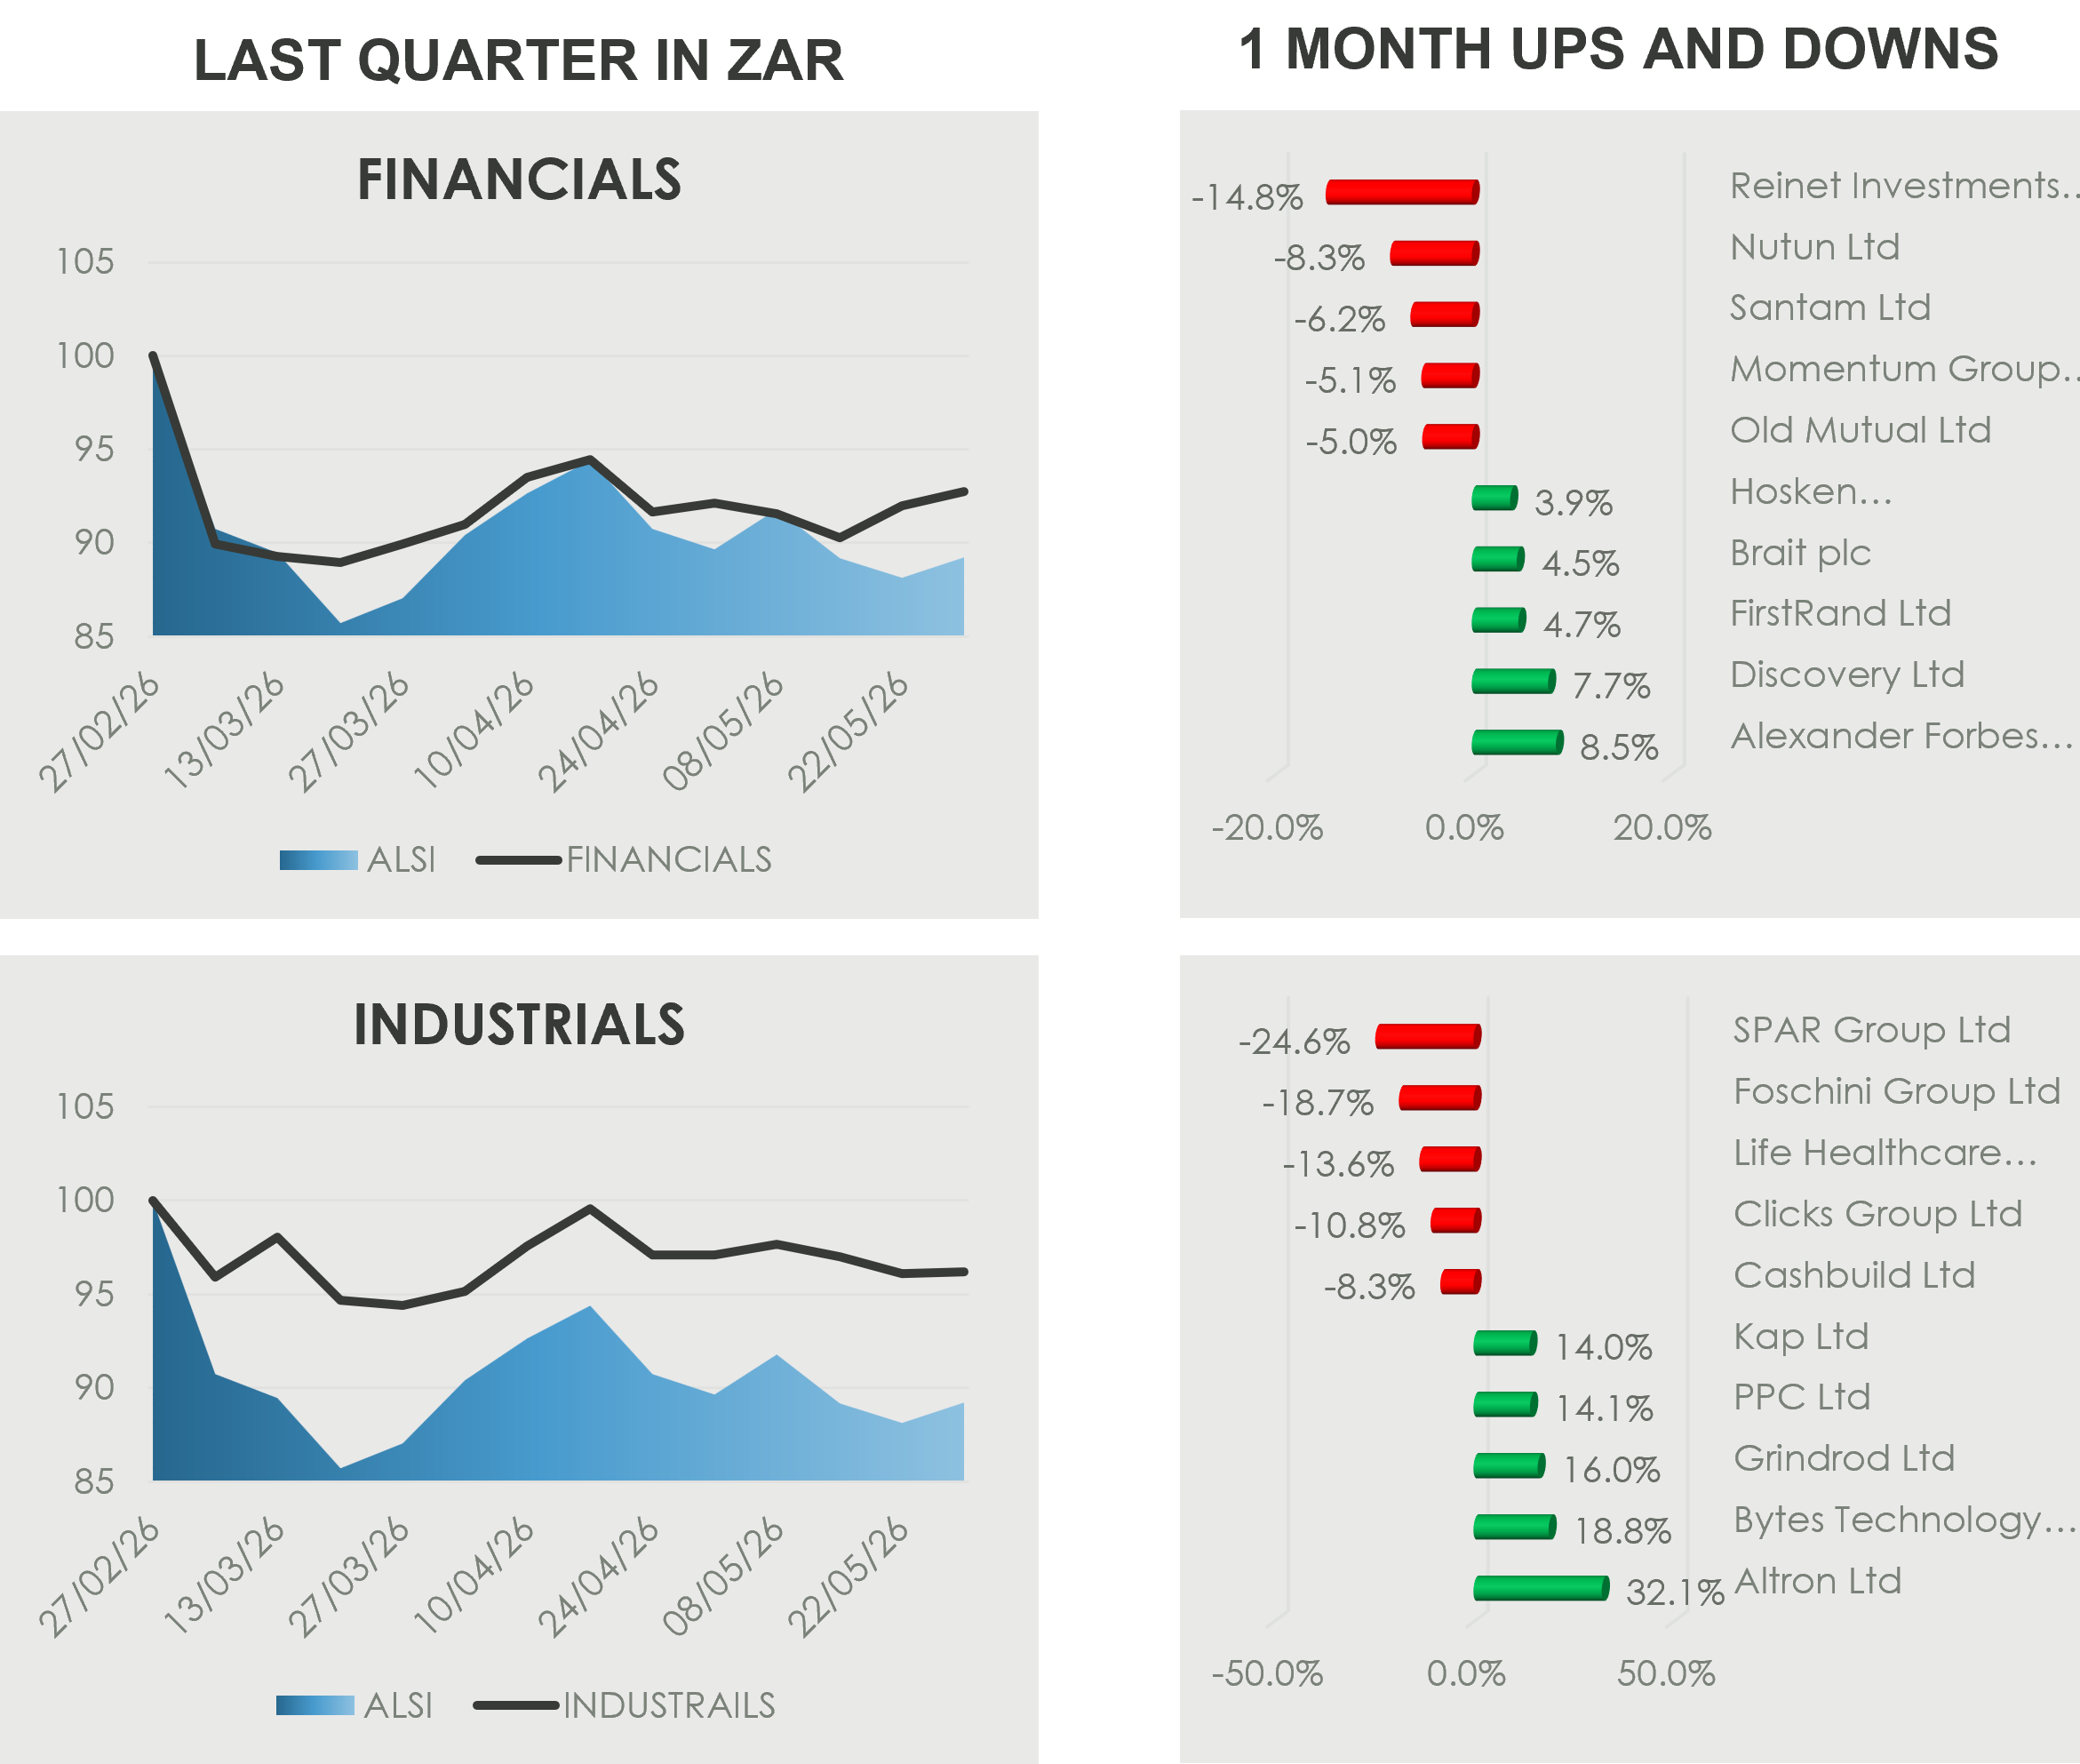
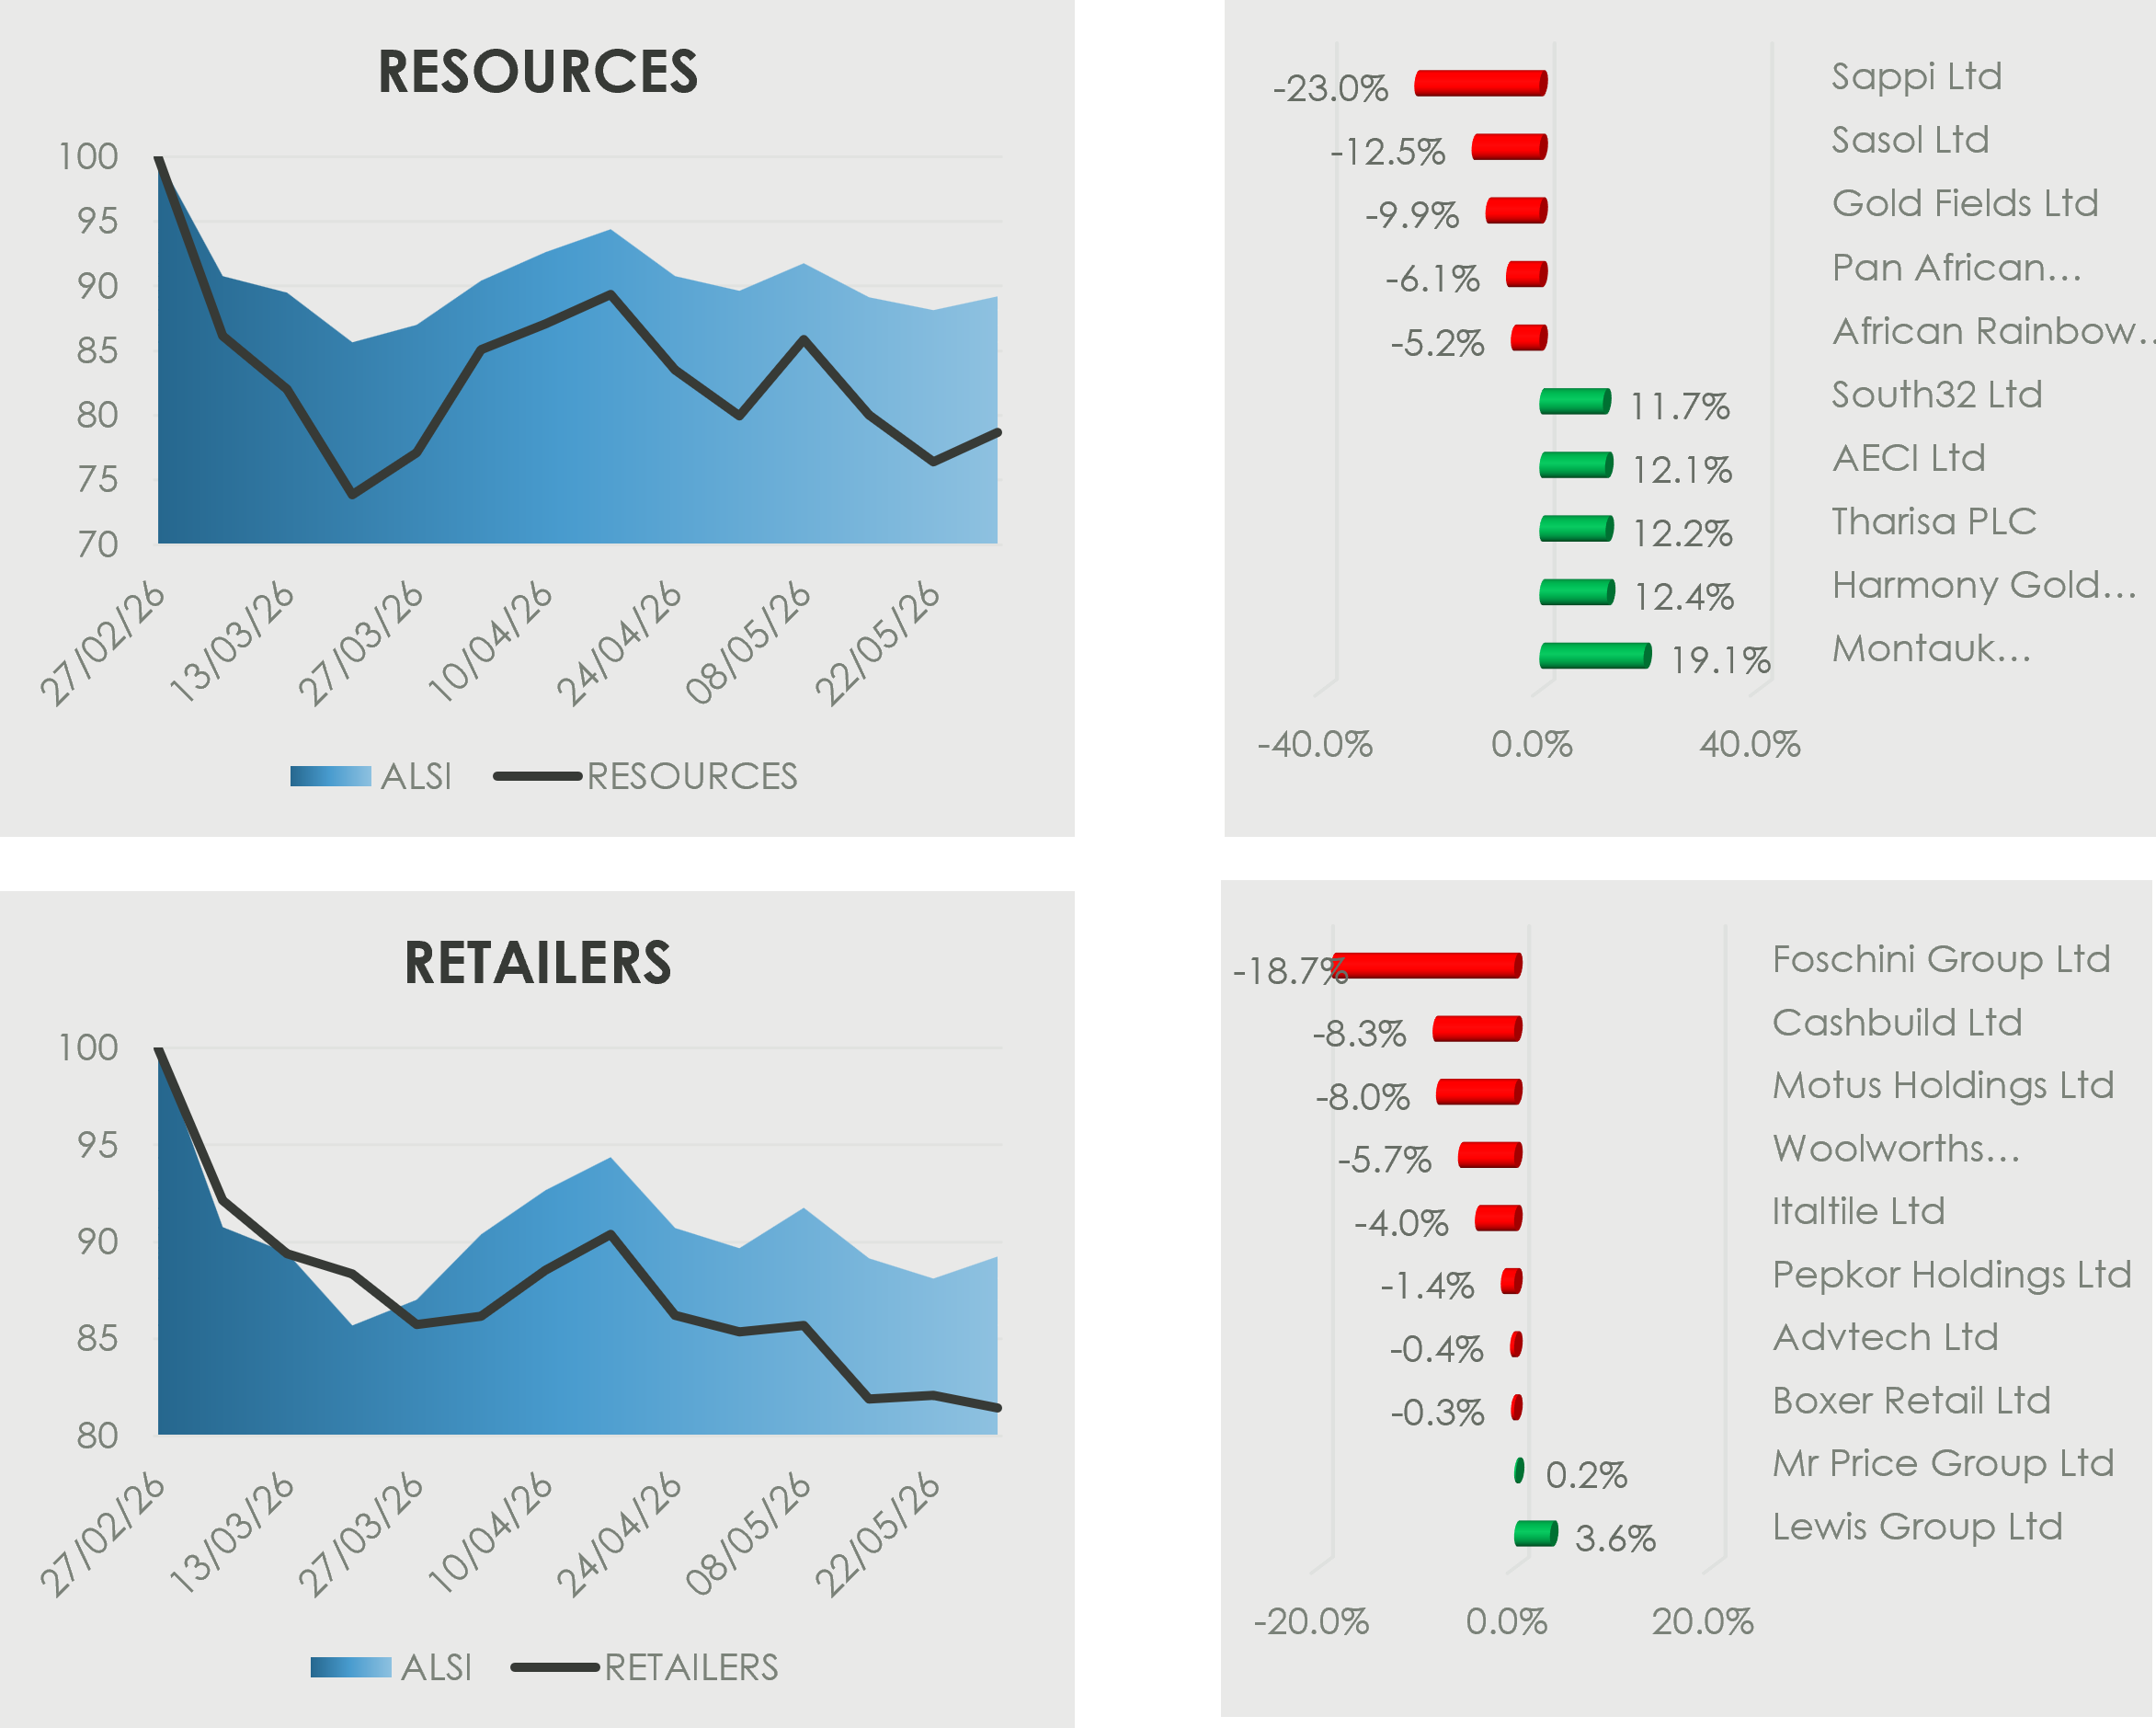
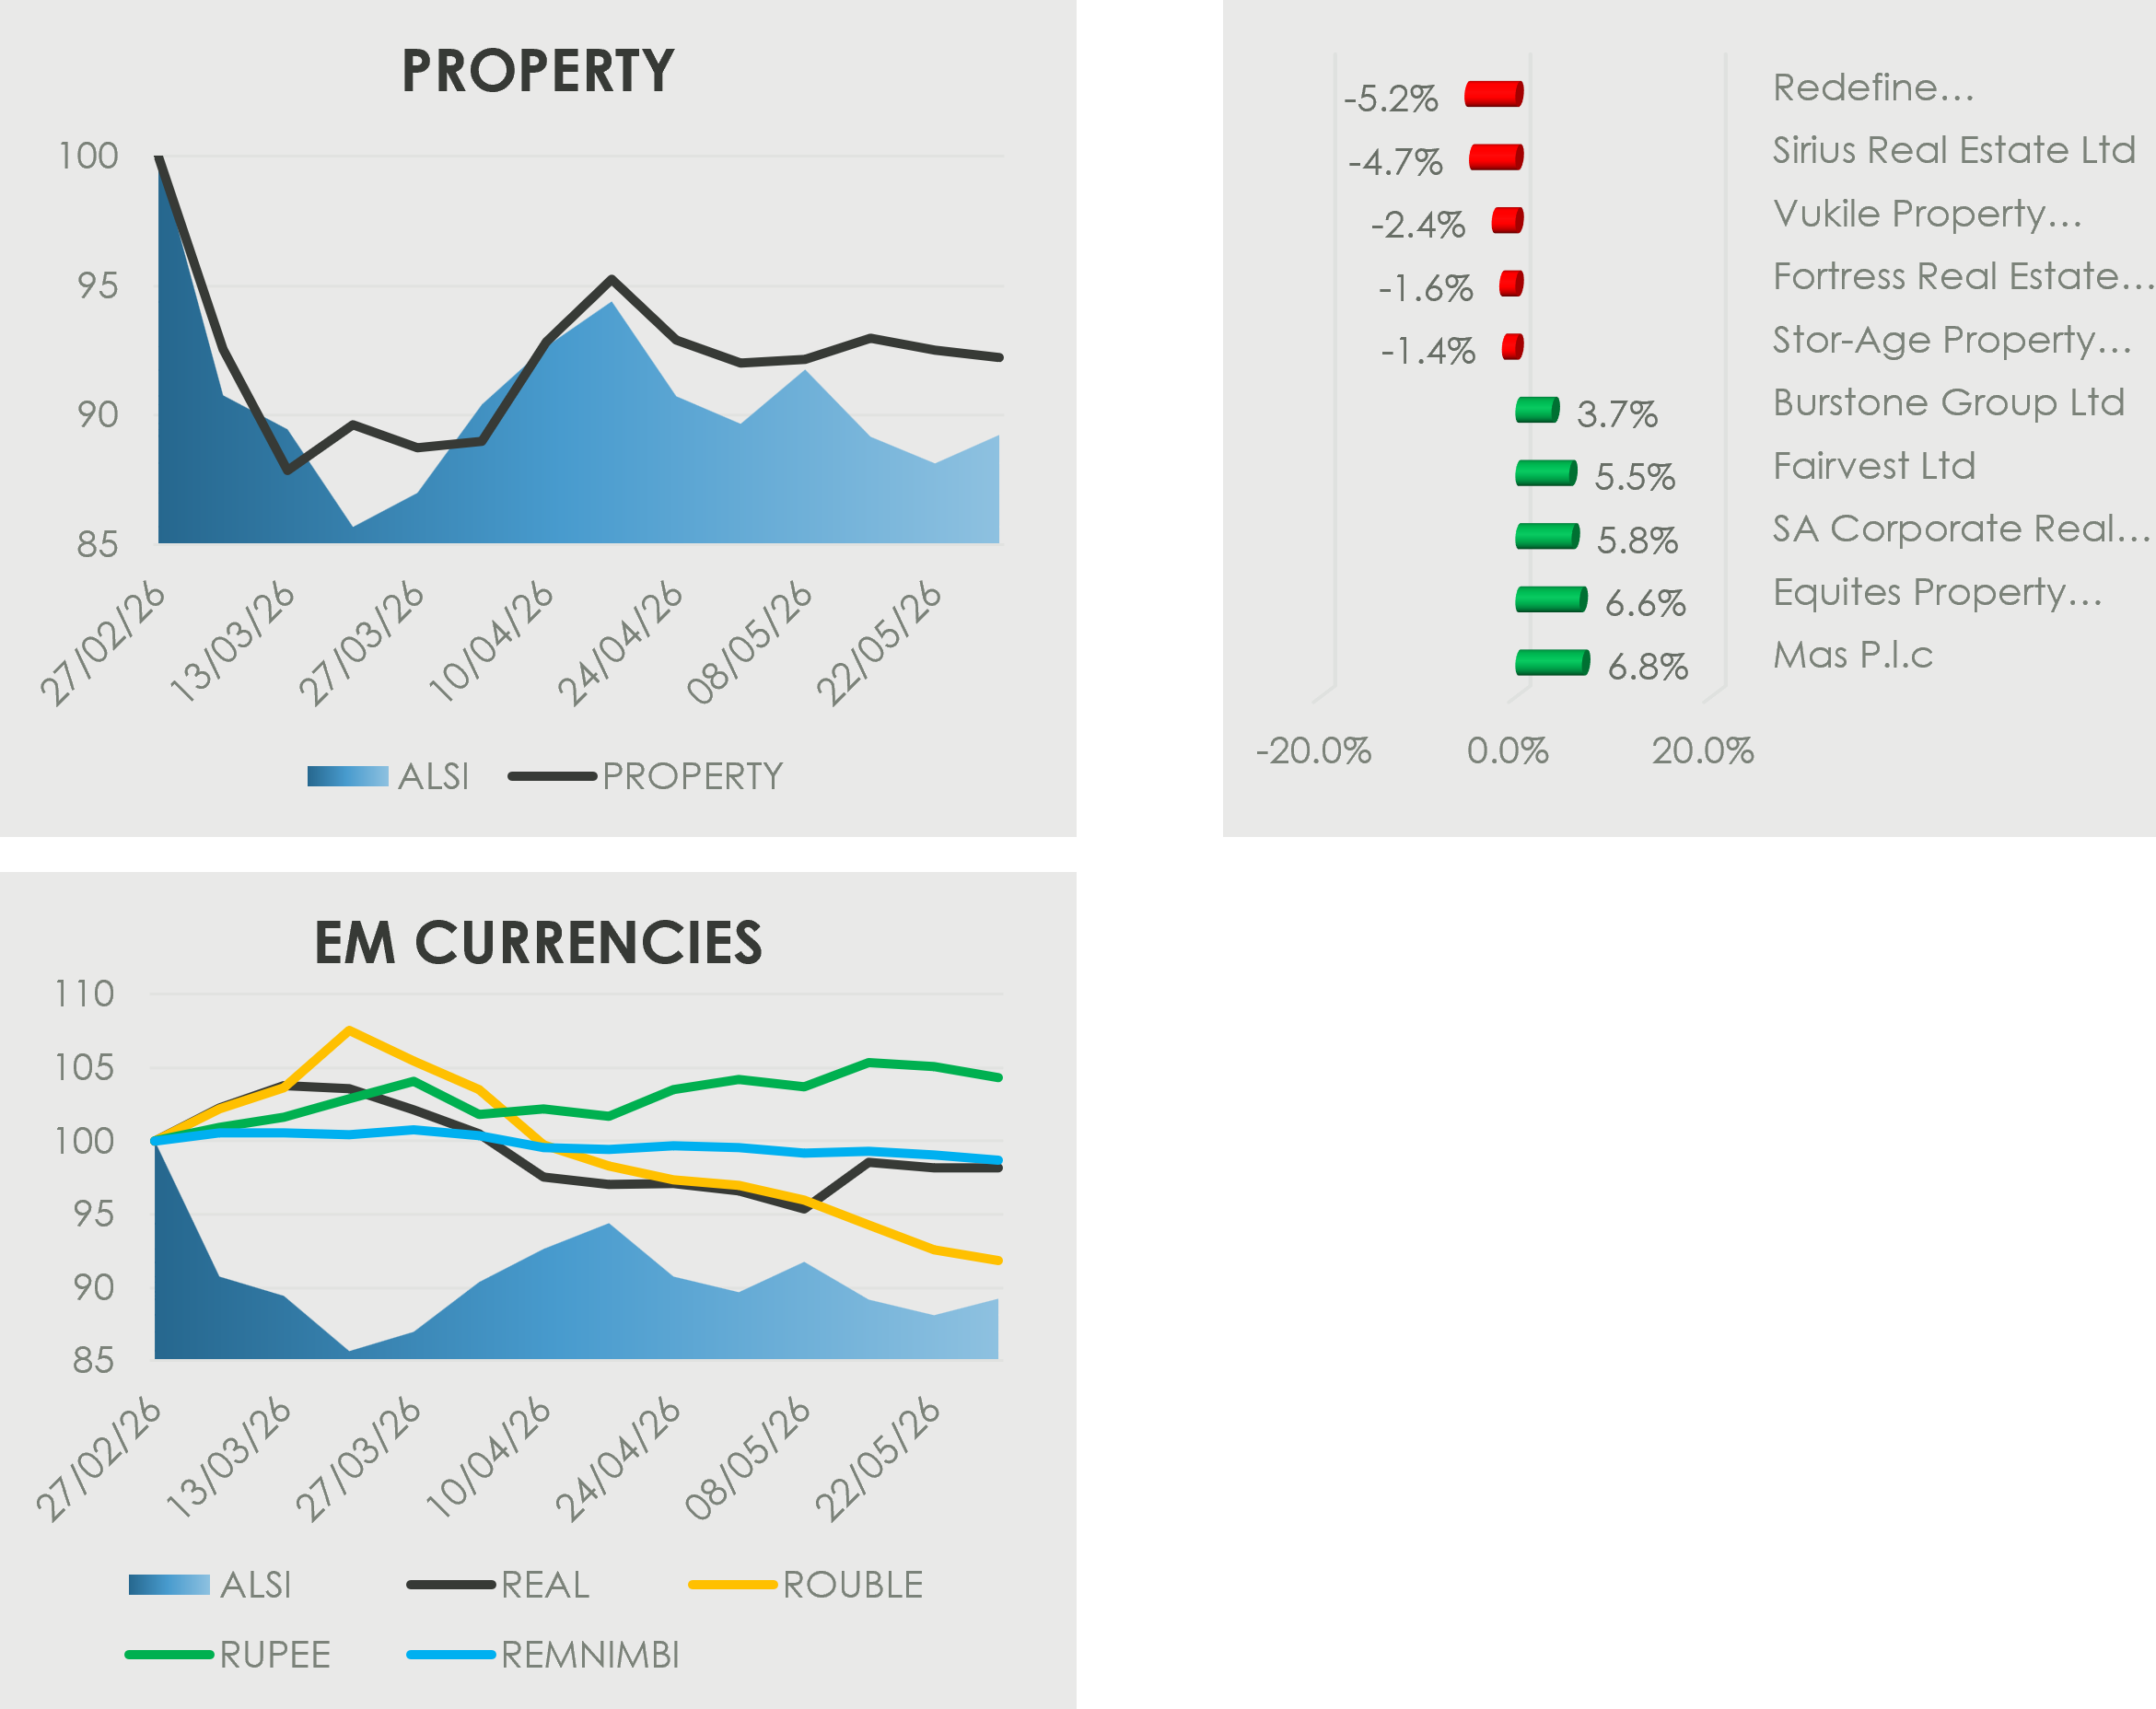
South African equities delivered a mixed performance, with the JSE ALSI closing the month 0.5% lower. Financials (+0.8%) and Property (+0.2%) posted modest gains, while Industrials (–0.9%), Retailers (–4.6%), and selected Resource counters (–1.7%) lagged.
Financials were supported by resilient earnings and improved sentiment. Alexander Forbes (+8.5%), Discovery (+7.7%), and FirstRand (+4.7%) advanced, while Reinet (–14.8%) declined after reporting a drop in FY26 NAV driven by currency weakness. Nutun (–8.3%) fell after posting a 1H26 net loss amid challenging conditions, and Santam (–6.2%) also weighed on the sector.
Property counters delivered a firmer month overall, supported by improving sentiment toward SA REITs and easing bond yields. MAS (+6.8%), Equites (+6.6%), SA Corporate (+5.8%), and Fairvest (+5.5%) led the gains. On the downside, Redefine (–5.2%), Sirius (–4.7%), and Vukile (–2.4%) ended lower, alongside smaller declines in Fortress (–1.6%) and Stor-Age (–1.4%).
Industrials were led by technology and logistics names. Altron (+32.1%) was the standout performer, surging on better-than-expected earnings, improved execution, and the declaration of both an increased dividend and a R500m special dividend. Bytes Technology (+18.8%) rallied on strong second-half momentum, while Grindrod (+16.0%) and PPC (+14.1%) posted solid gains. On the downside, Life Healthcare (–13.6%) declined on disappointing results and a softer outlook.
Resources were mixed, with diversified miners and chemicals outperforming. Montauk (+19.1%), Harmony (+12.4%), Tharisa (+12.2%), AECI (+12.1%), and South32 (+11.7%) all gained, supported by operational updates and diversified exposure. Harmony stood out among gold names after reaffirming full-year production, grade, and cost guidance. However, gold counters were weaker overall, with Gold Fields (–9.9%), Pan African (–6.1%), and DRDGOLD (–4.4%) declining as bullion prices softened. Sasol (–12.5%) fell on weaker oil prices, while Sappi (–23.0%) declined sharply amid weak pulp prices, margin pressure, and structural headwinds.
Retailers remained under pressure, reflecting constrained consumer demand. SPAR (–24.6%) tumbled after a weak 1H26 update, guiding to a potential 60% decline in EPS, while Foschini (–18.7%) flagged a 30–40% drop in HEPS. Woolworths (–5.7%), Motus (–8.0%), and Cashbuild (–8.3%) also declined. Lewis (+3.6%) and Mr Price (+0.2%) managed modest gains, while Boxer (–0.3%) and Pepkor (–1.4%) were relatively resilient.
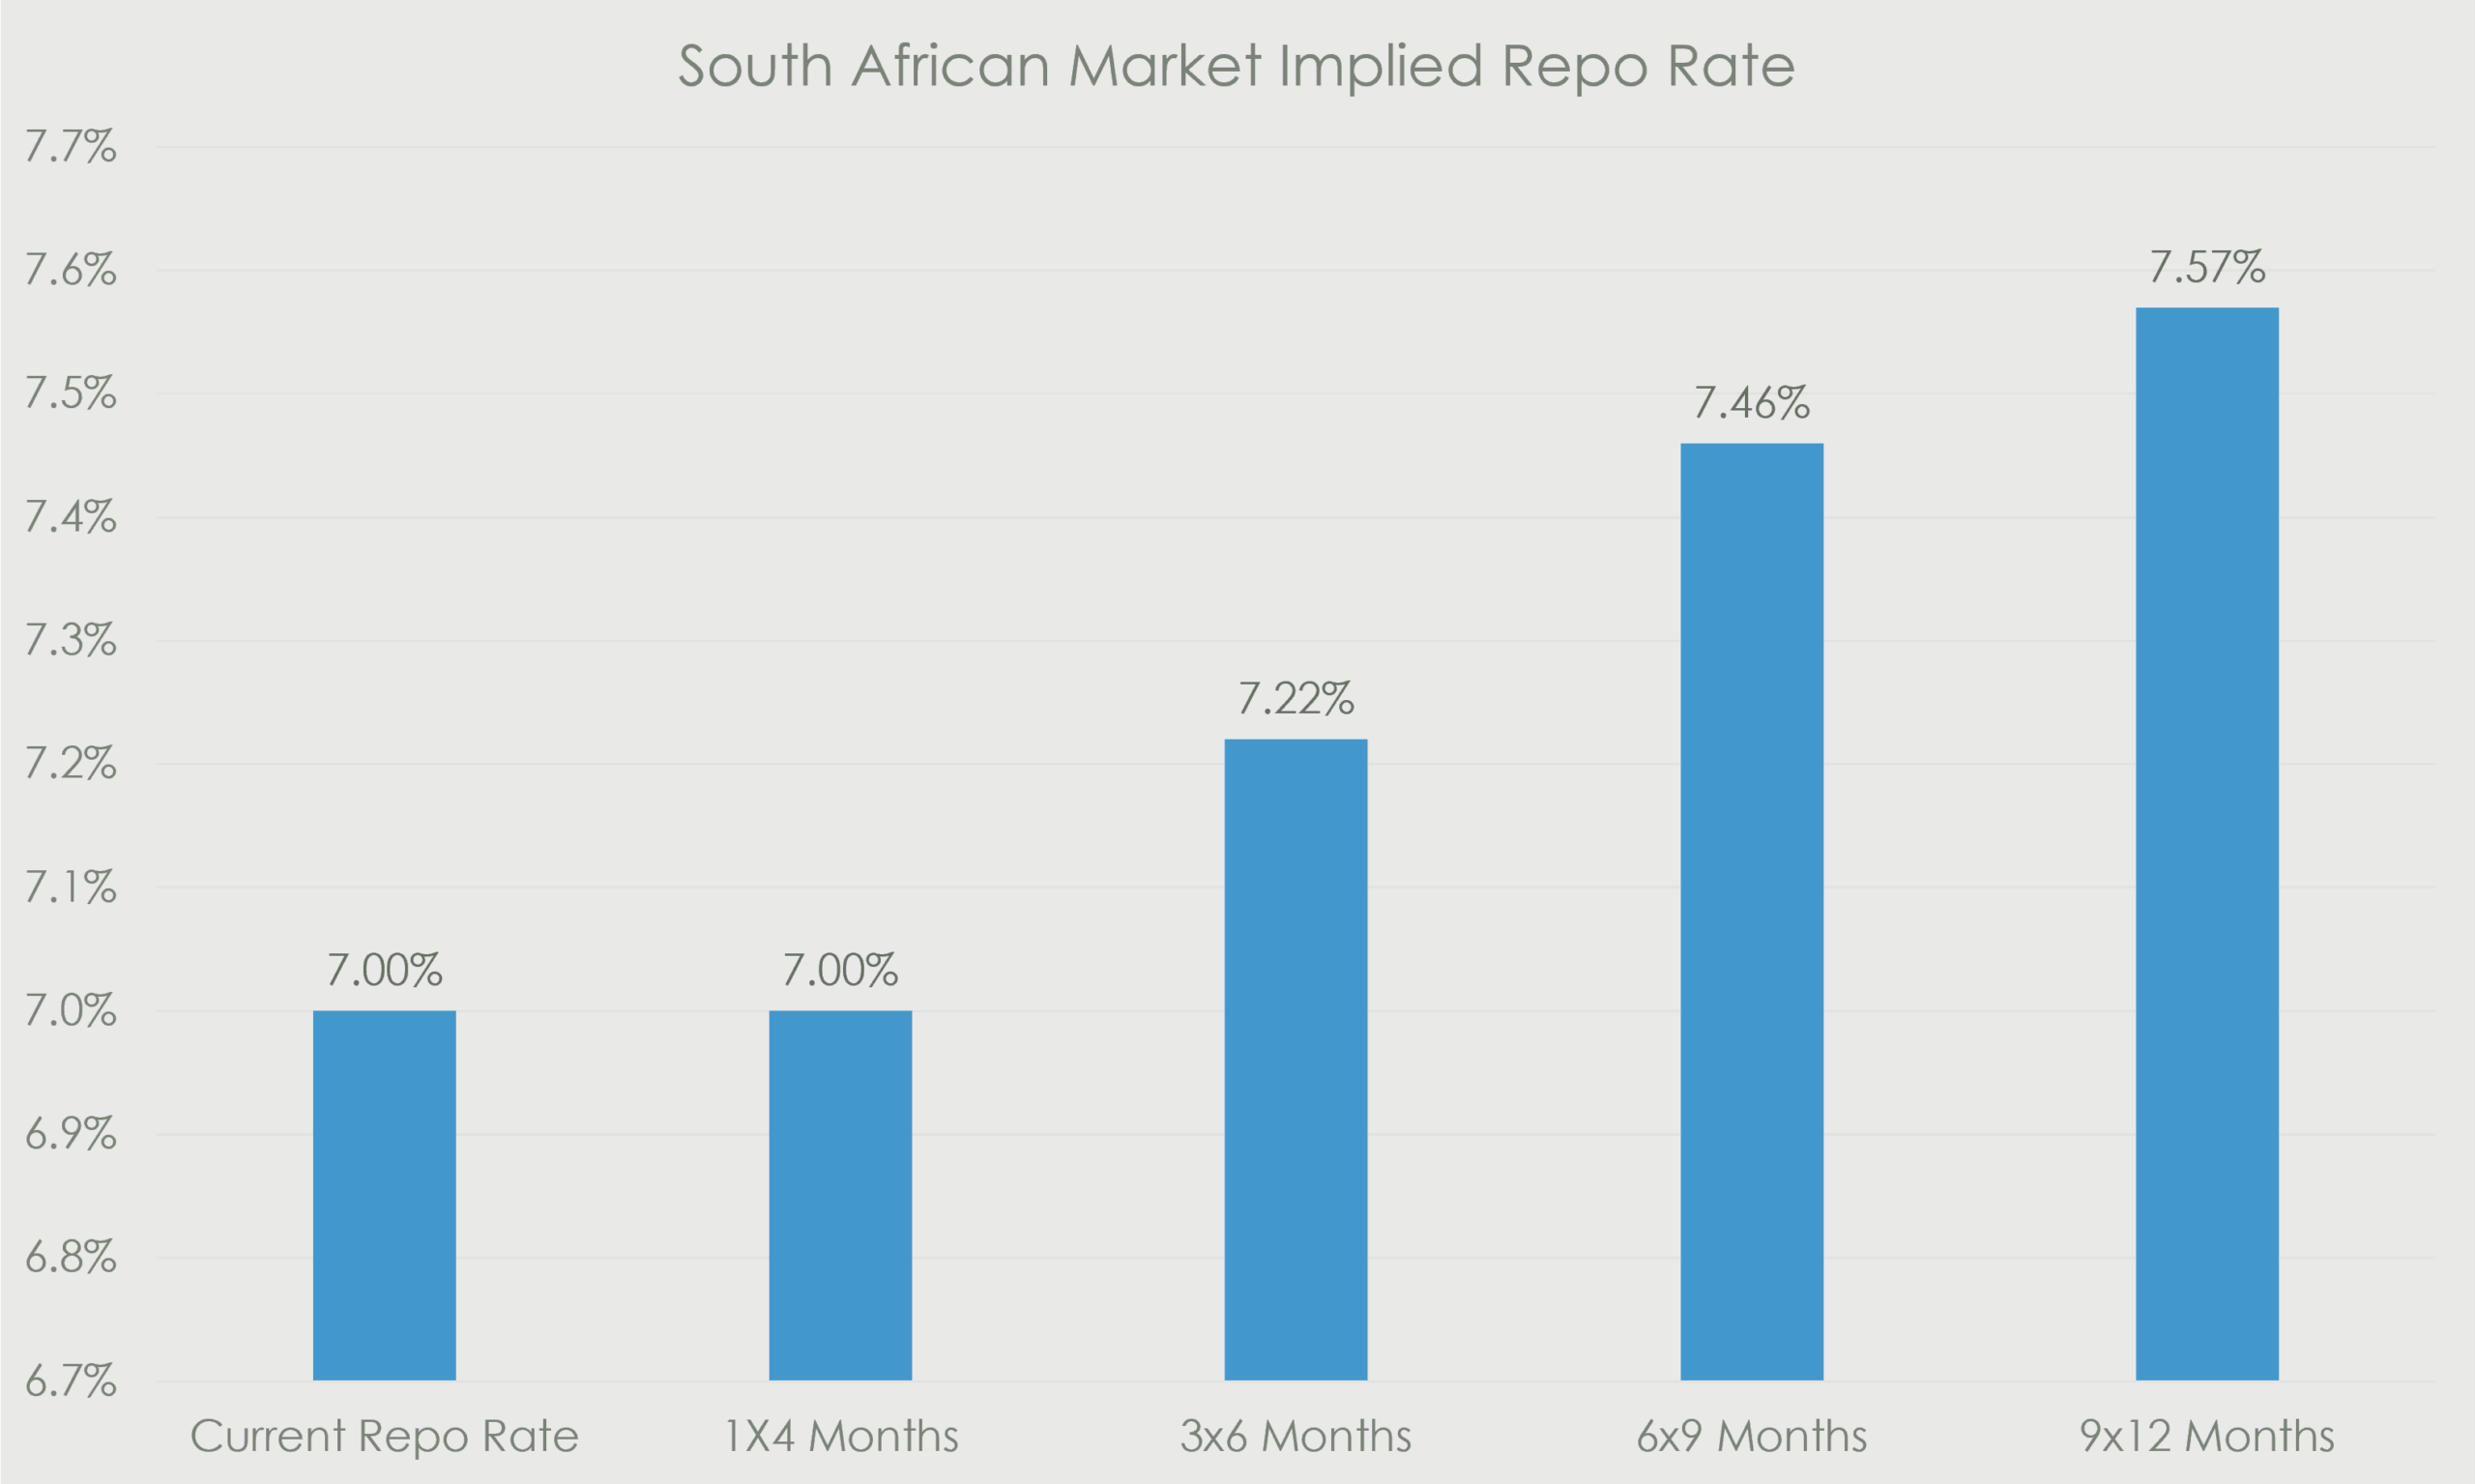
Three months into the Iran conflict, the data is beginning to reflect a clear shift in South Africa’s macro trajectory. Inflation expectations are rising, growth forecasts are being revised, and monetary policy expectations have turned more hawkish.
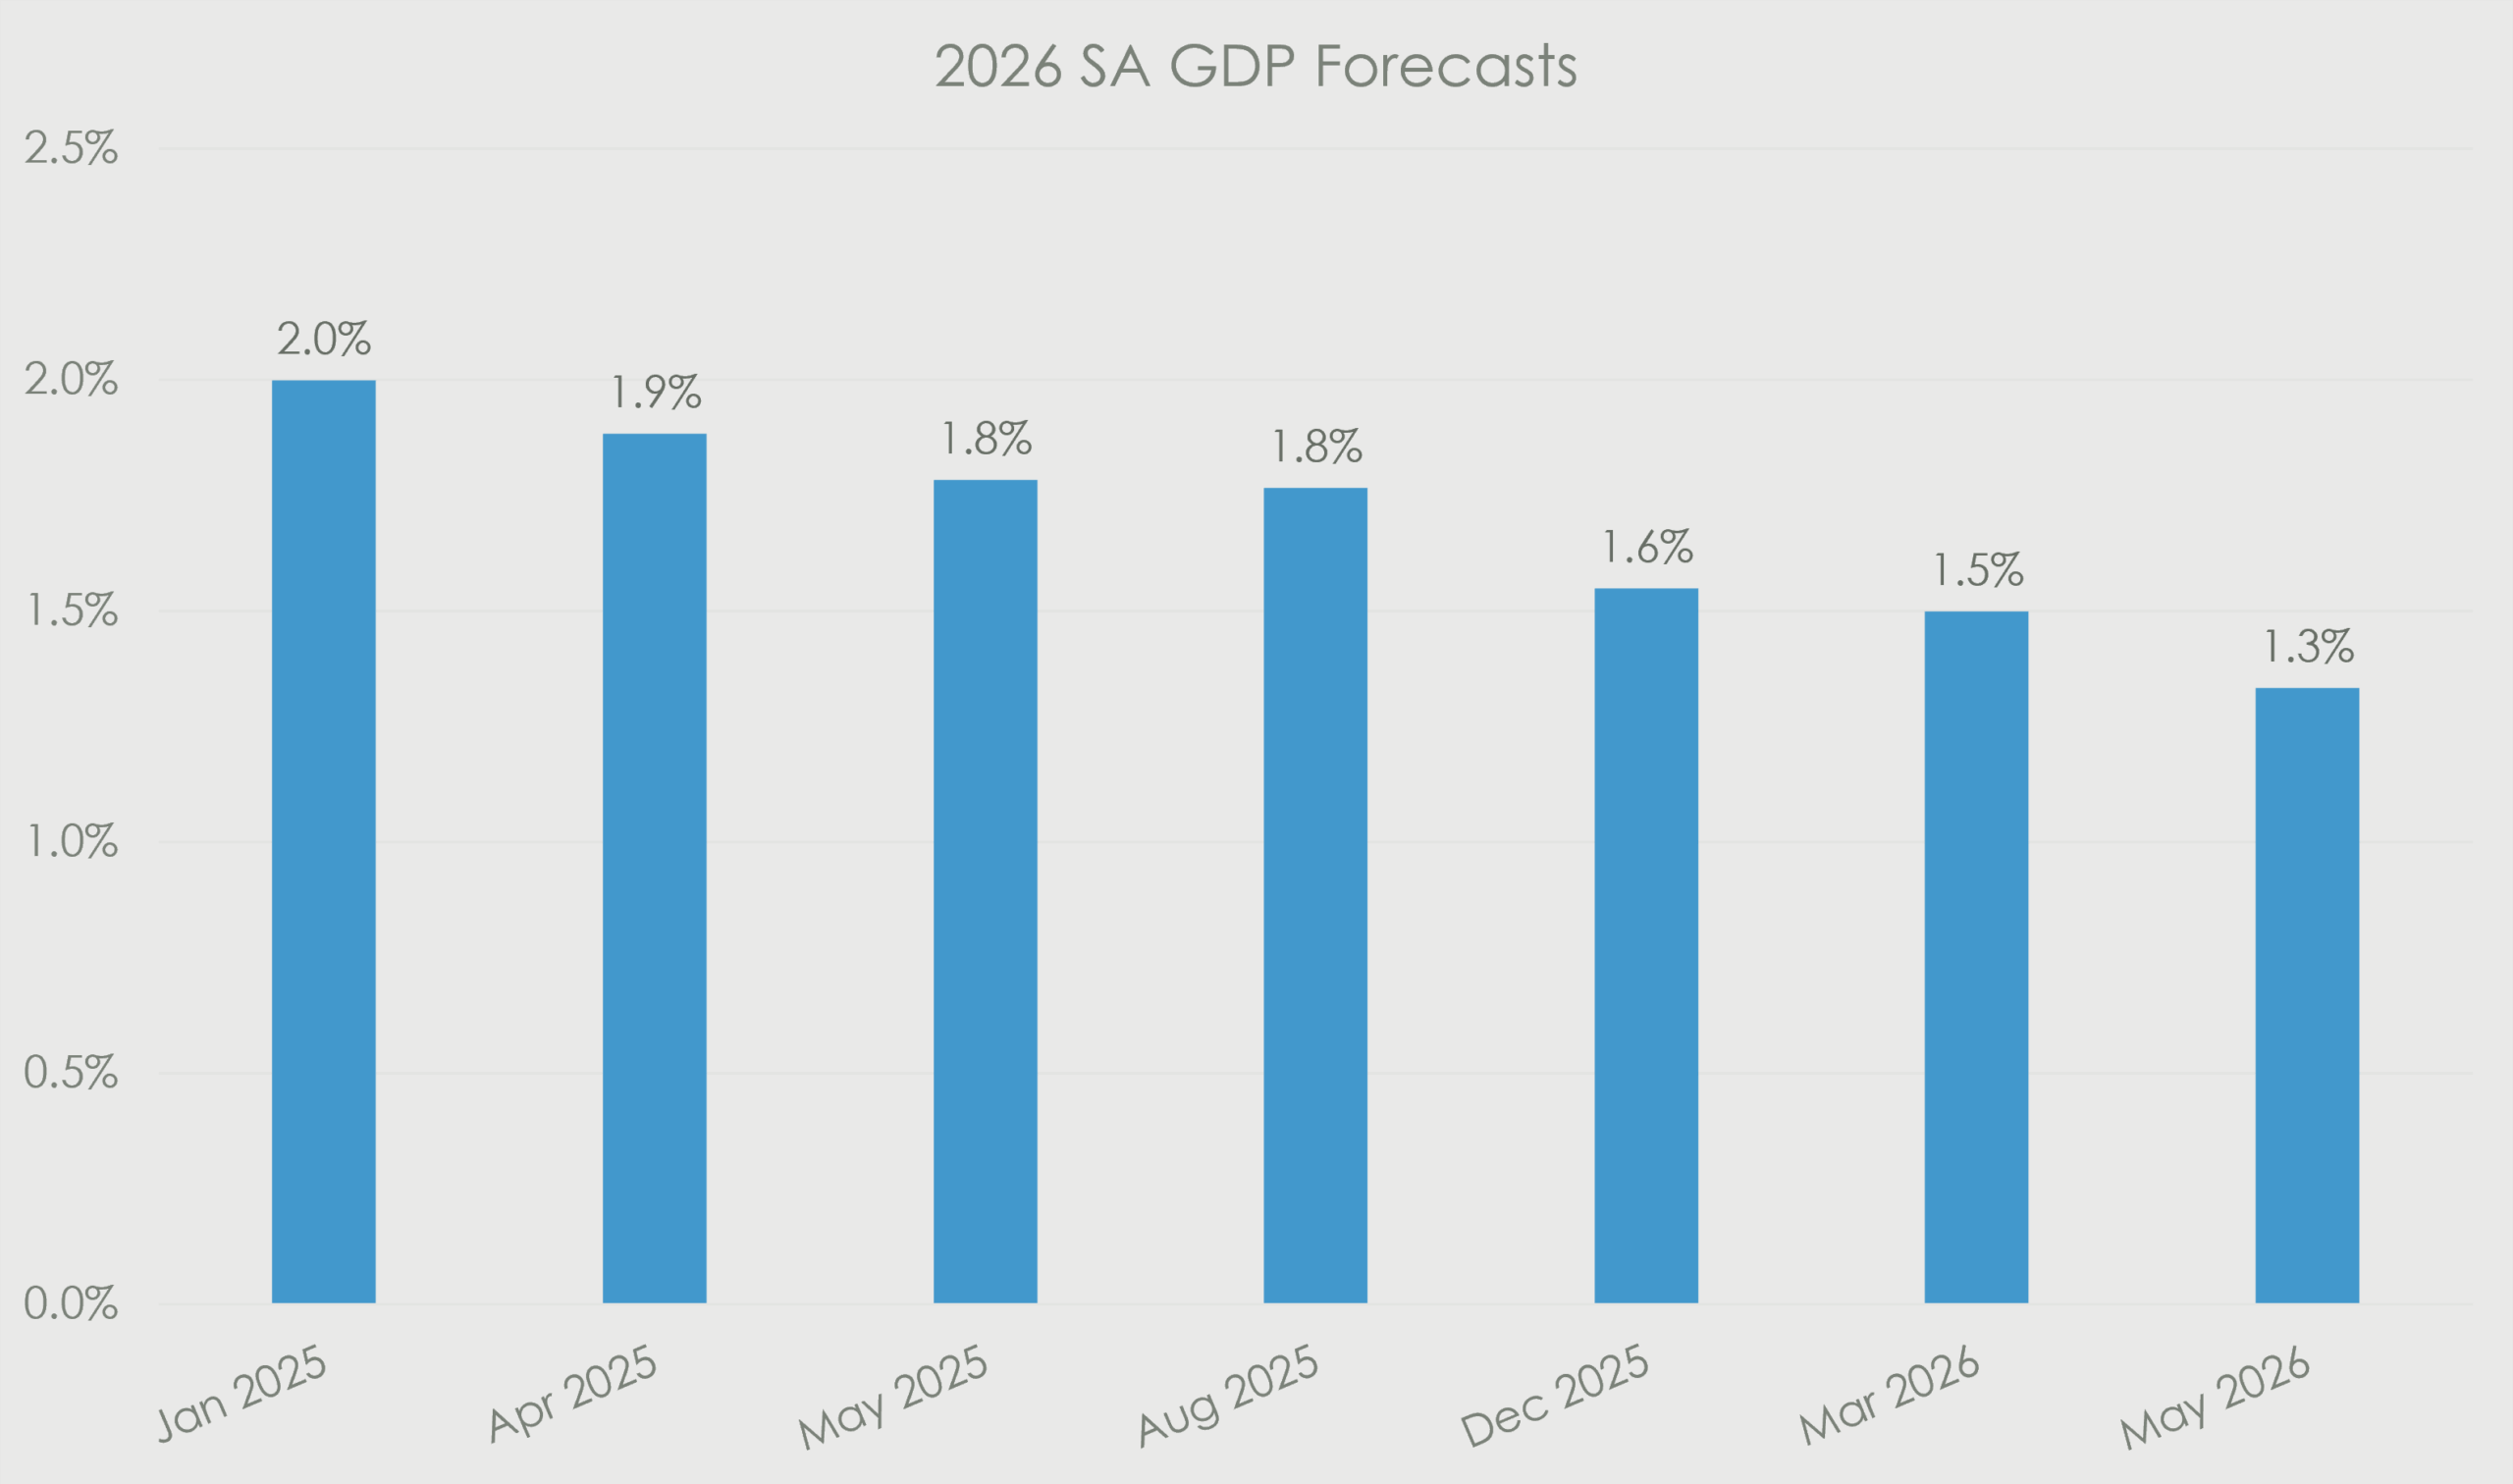
Following the recent rate hike – the first since 2023 – markets are now pricing in two additional hikes over the next 12 months. The SARB has lifted its 2026 inflation forecast by 70bps to 4.4%, while GDP growth expectations have been revised down from 1.4% to 1.2%.
Early Signs of Strain Emerging
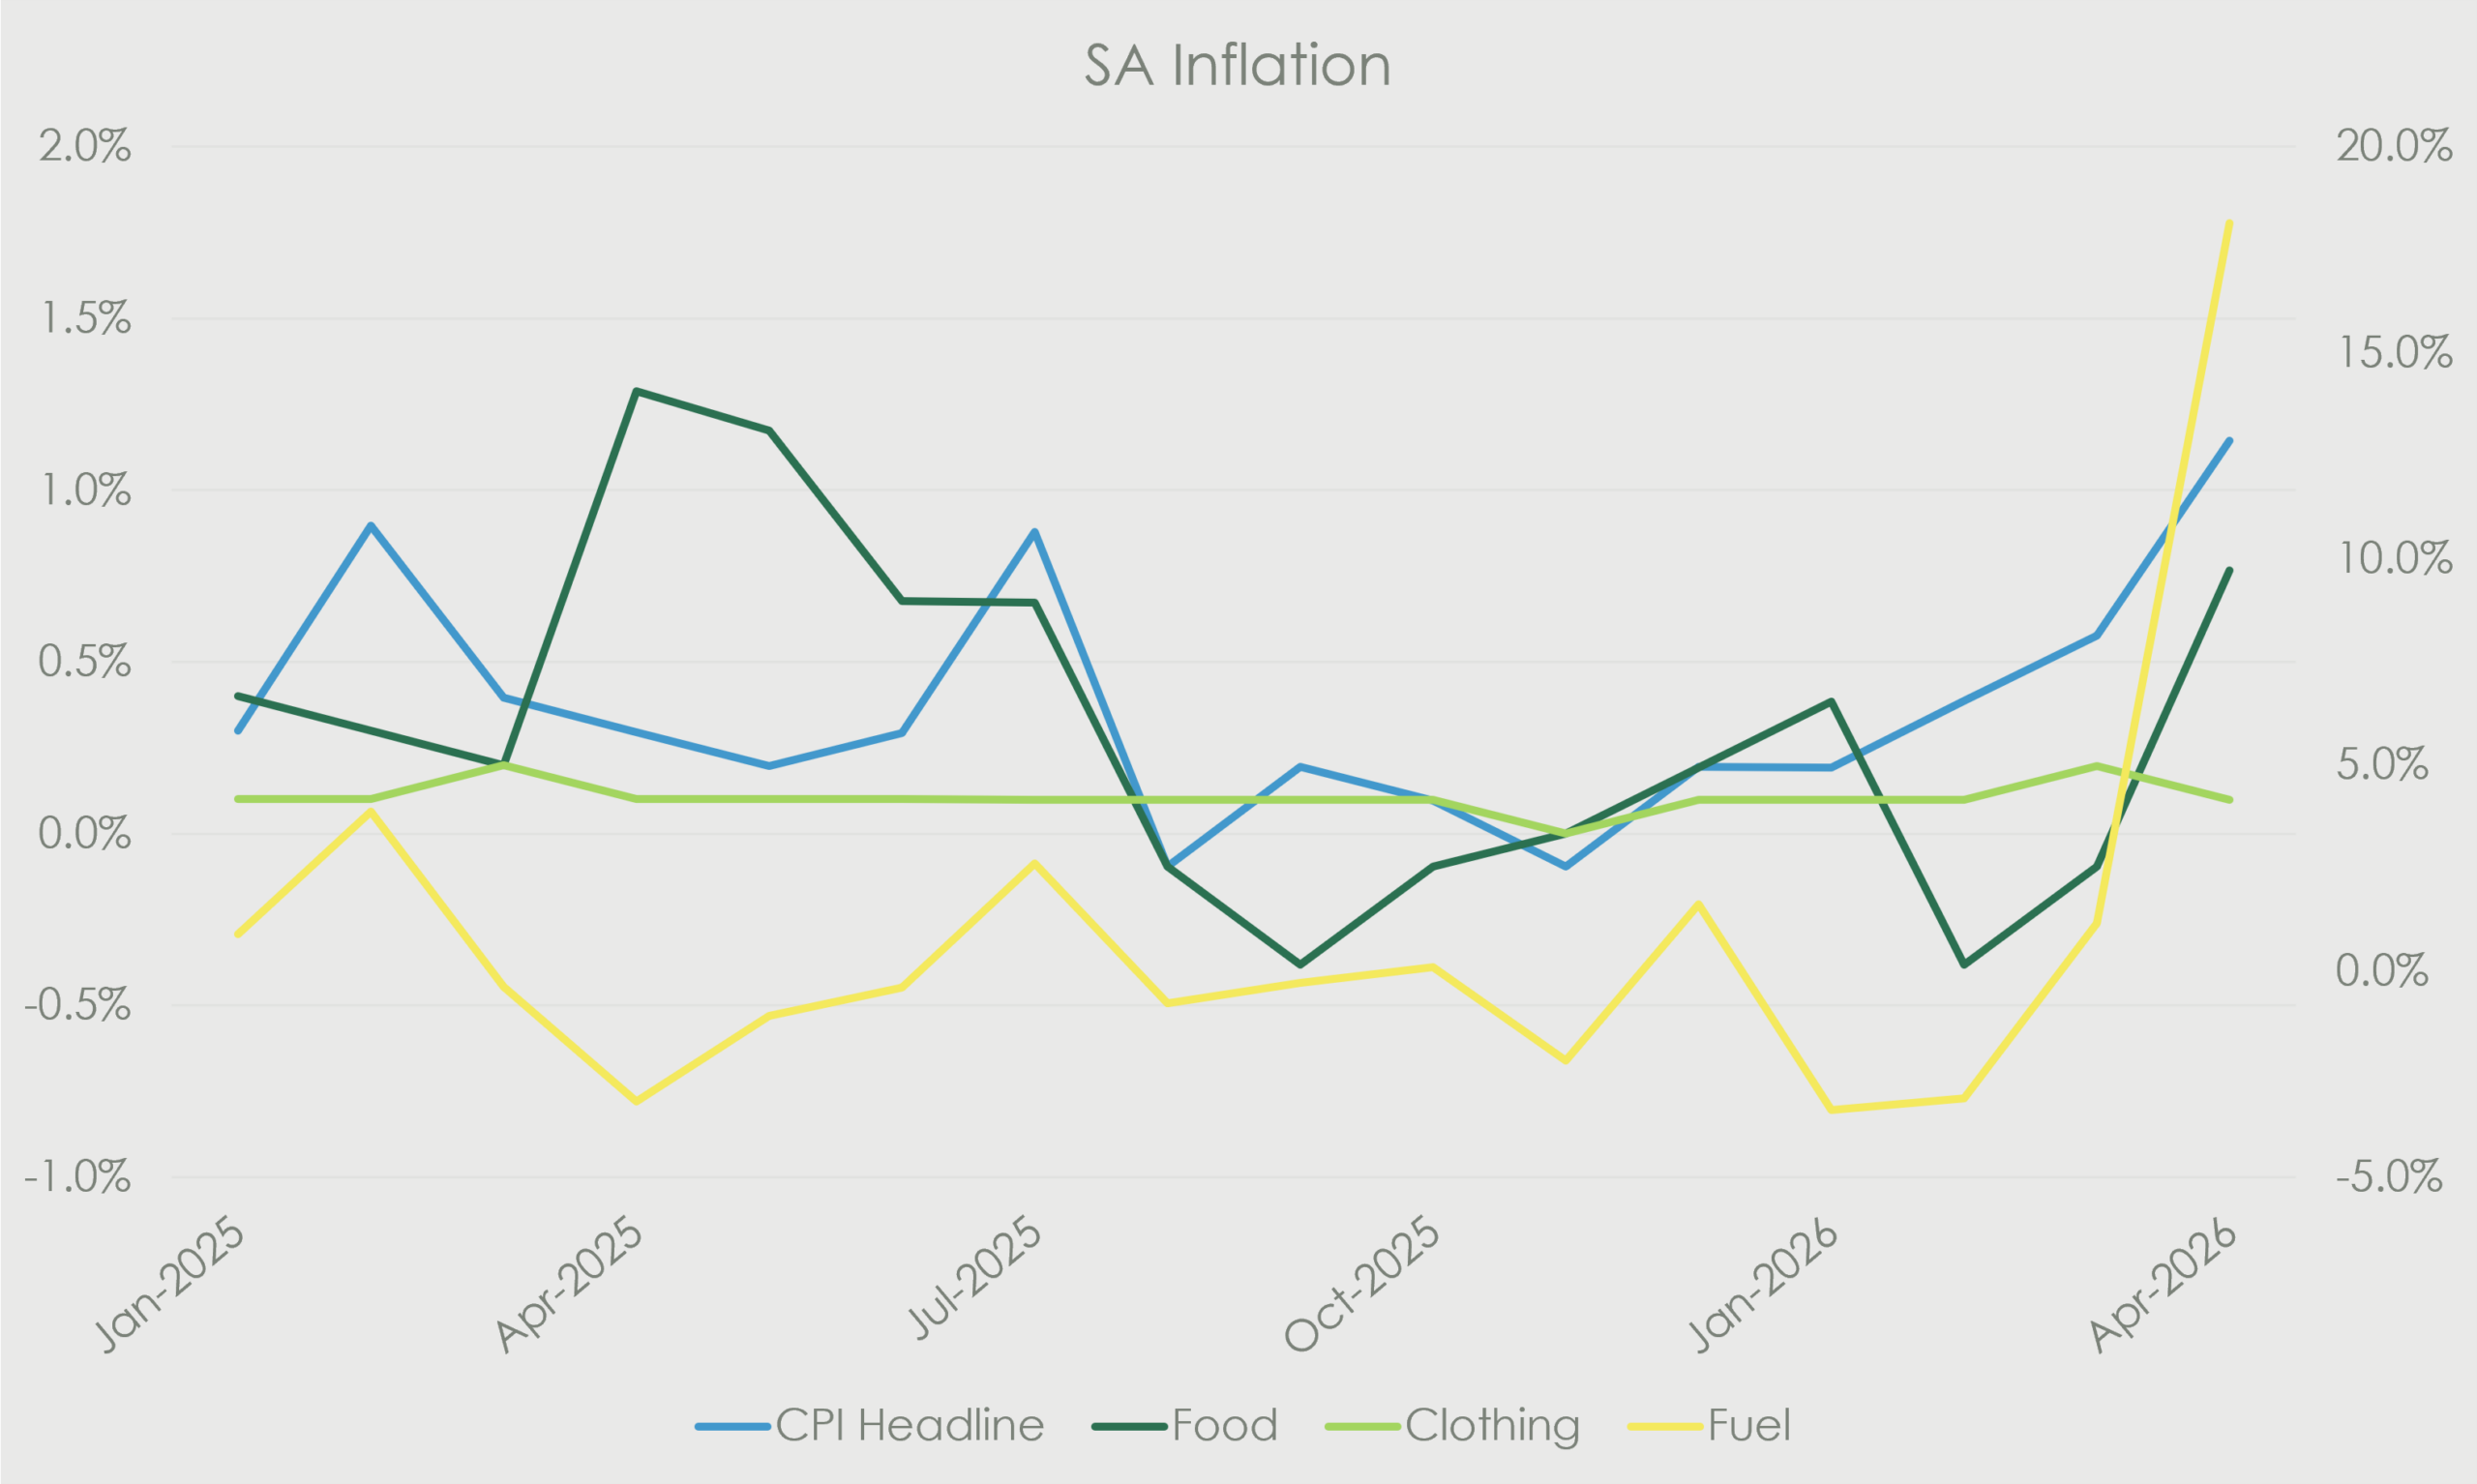
April inflation was 1.1% higher on a month-on-month basis, as fuel inflation rose by record levels to reflect the recently announced increases. Currently, inflation is driven primarily by energy, with expectations that food inflation will pick up. We expect this to broaden in the second half of the year, weighing on real wage growth in South Africa.
This tightening of financial conditions has begun to filter into the macro economy, with sentiment weakening and employment beginning to worsen. We saw a drop of over 300,000 in the number of people employed in first quarter employment data. Additionally, the war disrupted a recovery in business confidence, which weakened across most sectors.
All of this has led to downward revisions for GDP growth, as analysts digest the potential impact of higher fuel prices on a promising, but still fragile, economic recovery in South Africa.
On the positive side, Moody’s recently upgraded the nation’s sovereign credit outlook from stable to positive, a move which normally precedes a credit rating upgrade. The agency cited the continued positive trajectory of fiscal consolidation and reforms for the improvement in outlook.
South African Assets Have Held Up Well
Despite the deteriorating backdrop, the Rand has held up well since the beginning of the war, driven by still strong terms of trade. Further, following an initial sell-off in the first month of the war, the South African bond curve has caught a bid, with our ten-year yield consolidating around the 8.5% mark – not too far off recent multi-year lows.
SA equities, however, have continued to underperform emerging market peers, largely due to weakness in precious metals. Gold spot is down 15%, since the beginning of the war, with platinum and palladium down 19% and 24%, respectively.
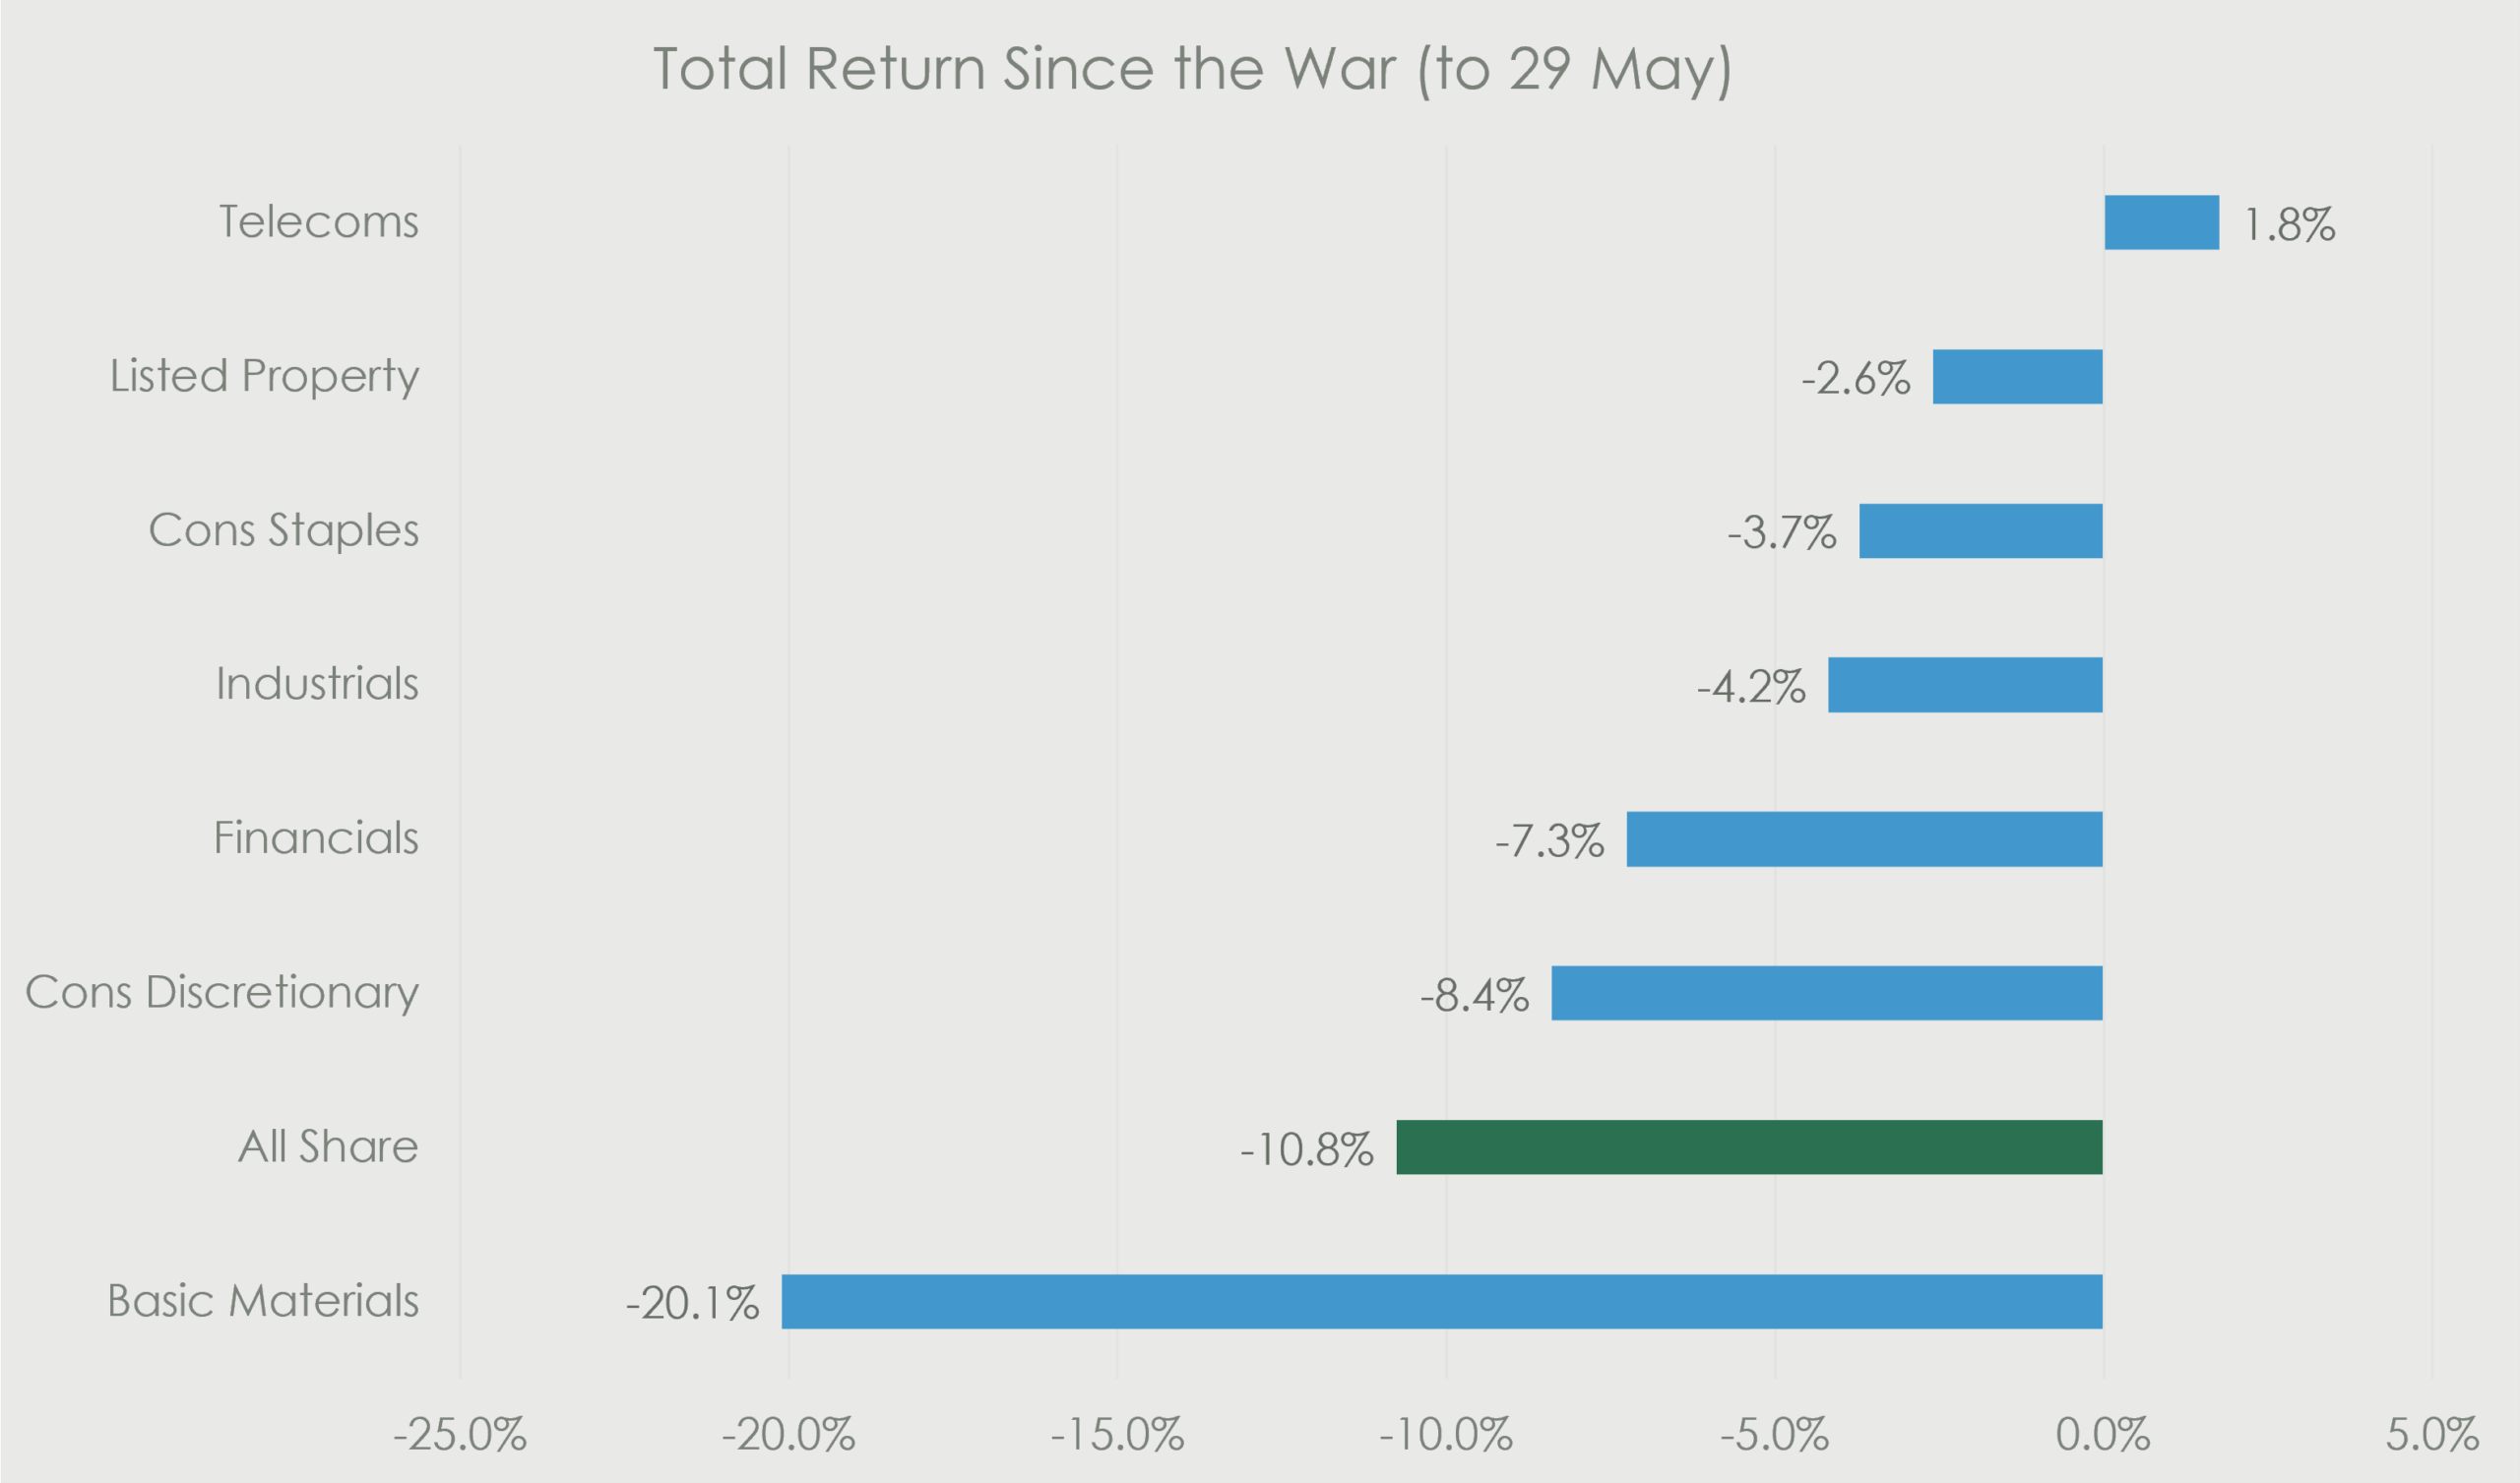
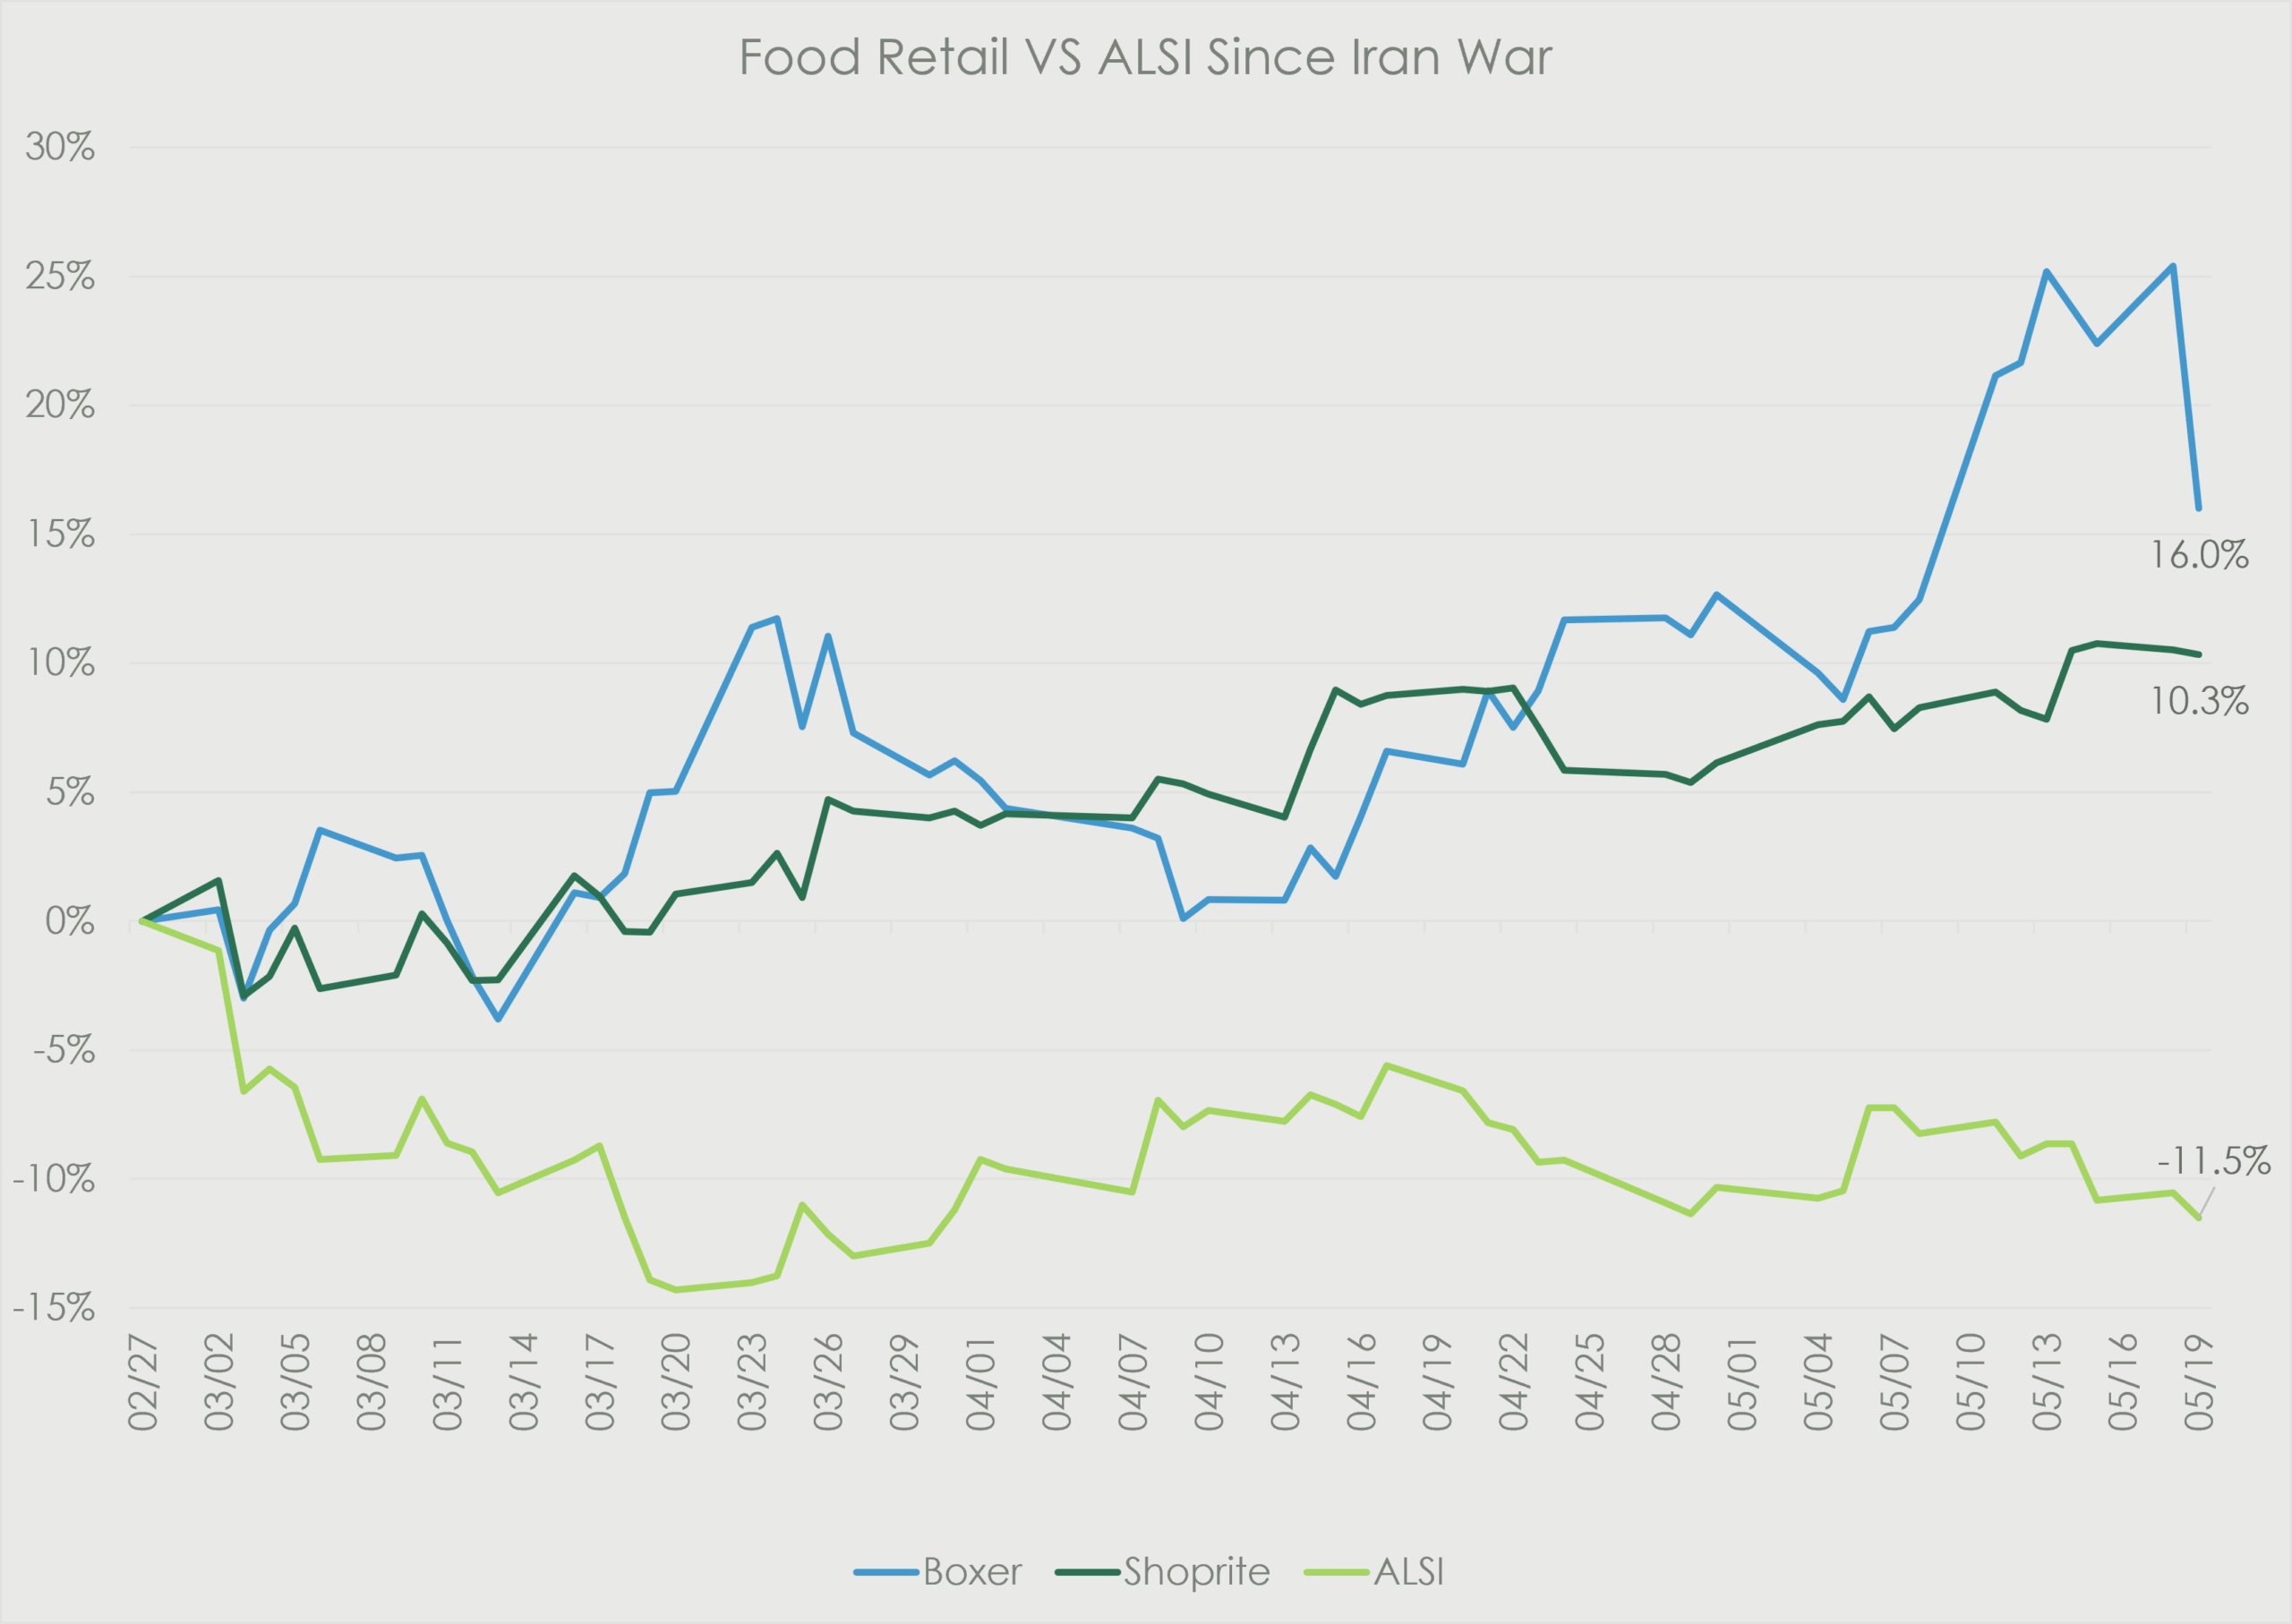
SA Inc sectors have shown resilience, supported by already depressed expectations. High quality food retailers have outperformed, in anticipation of an increase in food inflation, which would support topline growth and margins.
Inflation’s Upward Trajectory Will Drive Market Performance
Looking ahead, rising inflation and interest rates are likely to weigh on both consumption and investment, creating a more challenging environment for risk assets.
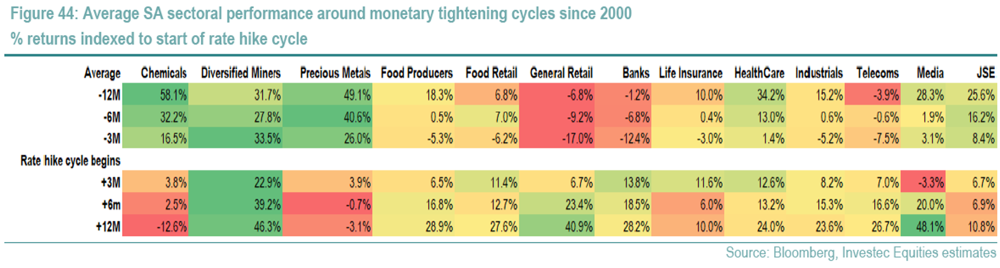
Historically, periods surrounding the start of rate hiking cycles have been associated with weaker equity returns, particularly in cyclical sectors such as discretionary retail, banks, and industrials. In contrast, defensive sectors – including food retail, healthcare, and diversified miners – tend to outperform.
Valuations and Positioning
Despite the softening macro-outlook, valuations continue to price in excessive levels of pessimism.
Against this backdrop, our focus has shifted toward businesses with strong pricing power and structural growth drivers – particularly those gaining market share and able to defend margins despite a weakening consumer environment.
Conclusion
It remains our view that the market may still be underestimating the potential impact of the current conditions. Rising inflation expectations and slowing growth are likely to delay any meaningful equity re-rating, even as underlying fundamentals improve.
Though relatively more defensive, our positioning aims to take advantage of prevailing conditions while selectively capturing opportunities in sectors best placed to navigate a higher inflation, lower growth environment.

As consumer headwinds intensify, we used the recent Pick n Pay placement of shares in Boxer on 18 May to increase our exposure to the stock. As a market-share-gaining, low-price food retailer, Boxer offers attractive protection in a weakening macro environment, with the added benefit of strong earnings growth potential and scope for a valuation re-rating.
The backdrop is becoming increasingly challenging. Elevated oil prices – driven by ongoing geopolitical tensions – have pushed fuel costs significantly higher, adding pressure to household budgets. As a result, inflation expectations are rising, growth forecasts are being revised down, and consumers are showing clear signs of strain. Encouragingly for value-focused retailers, this is driving a shift in behaviour, with consumers trading down and prioritising essential goods.
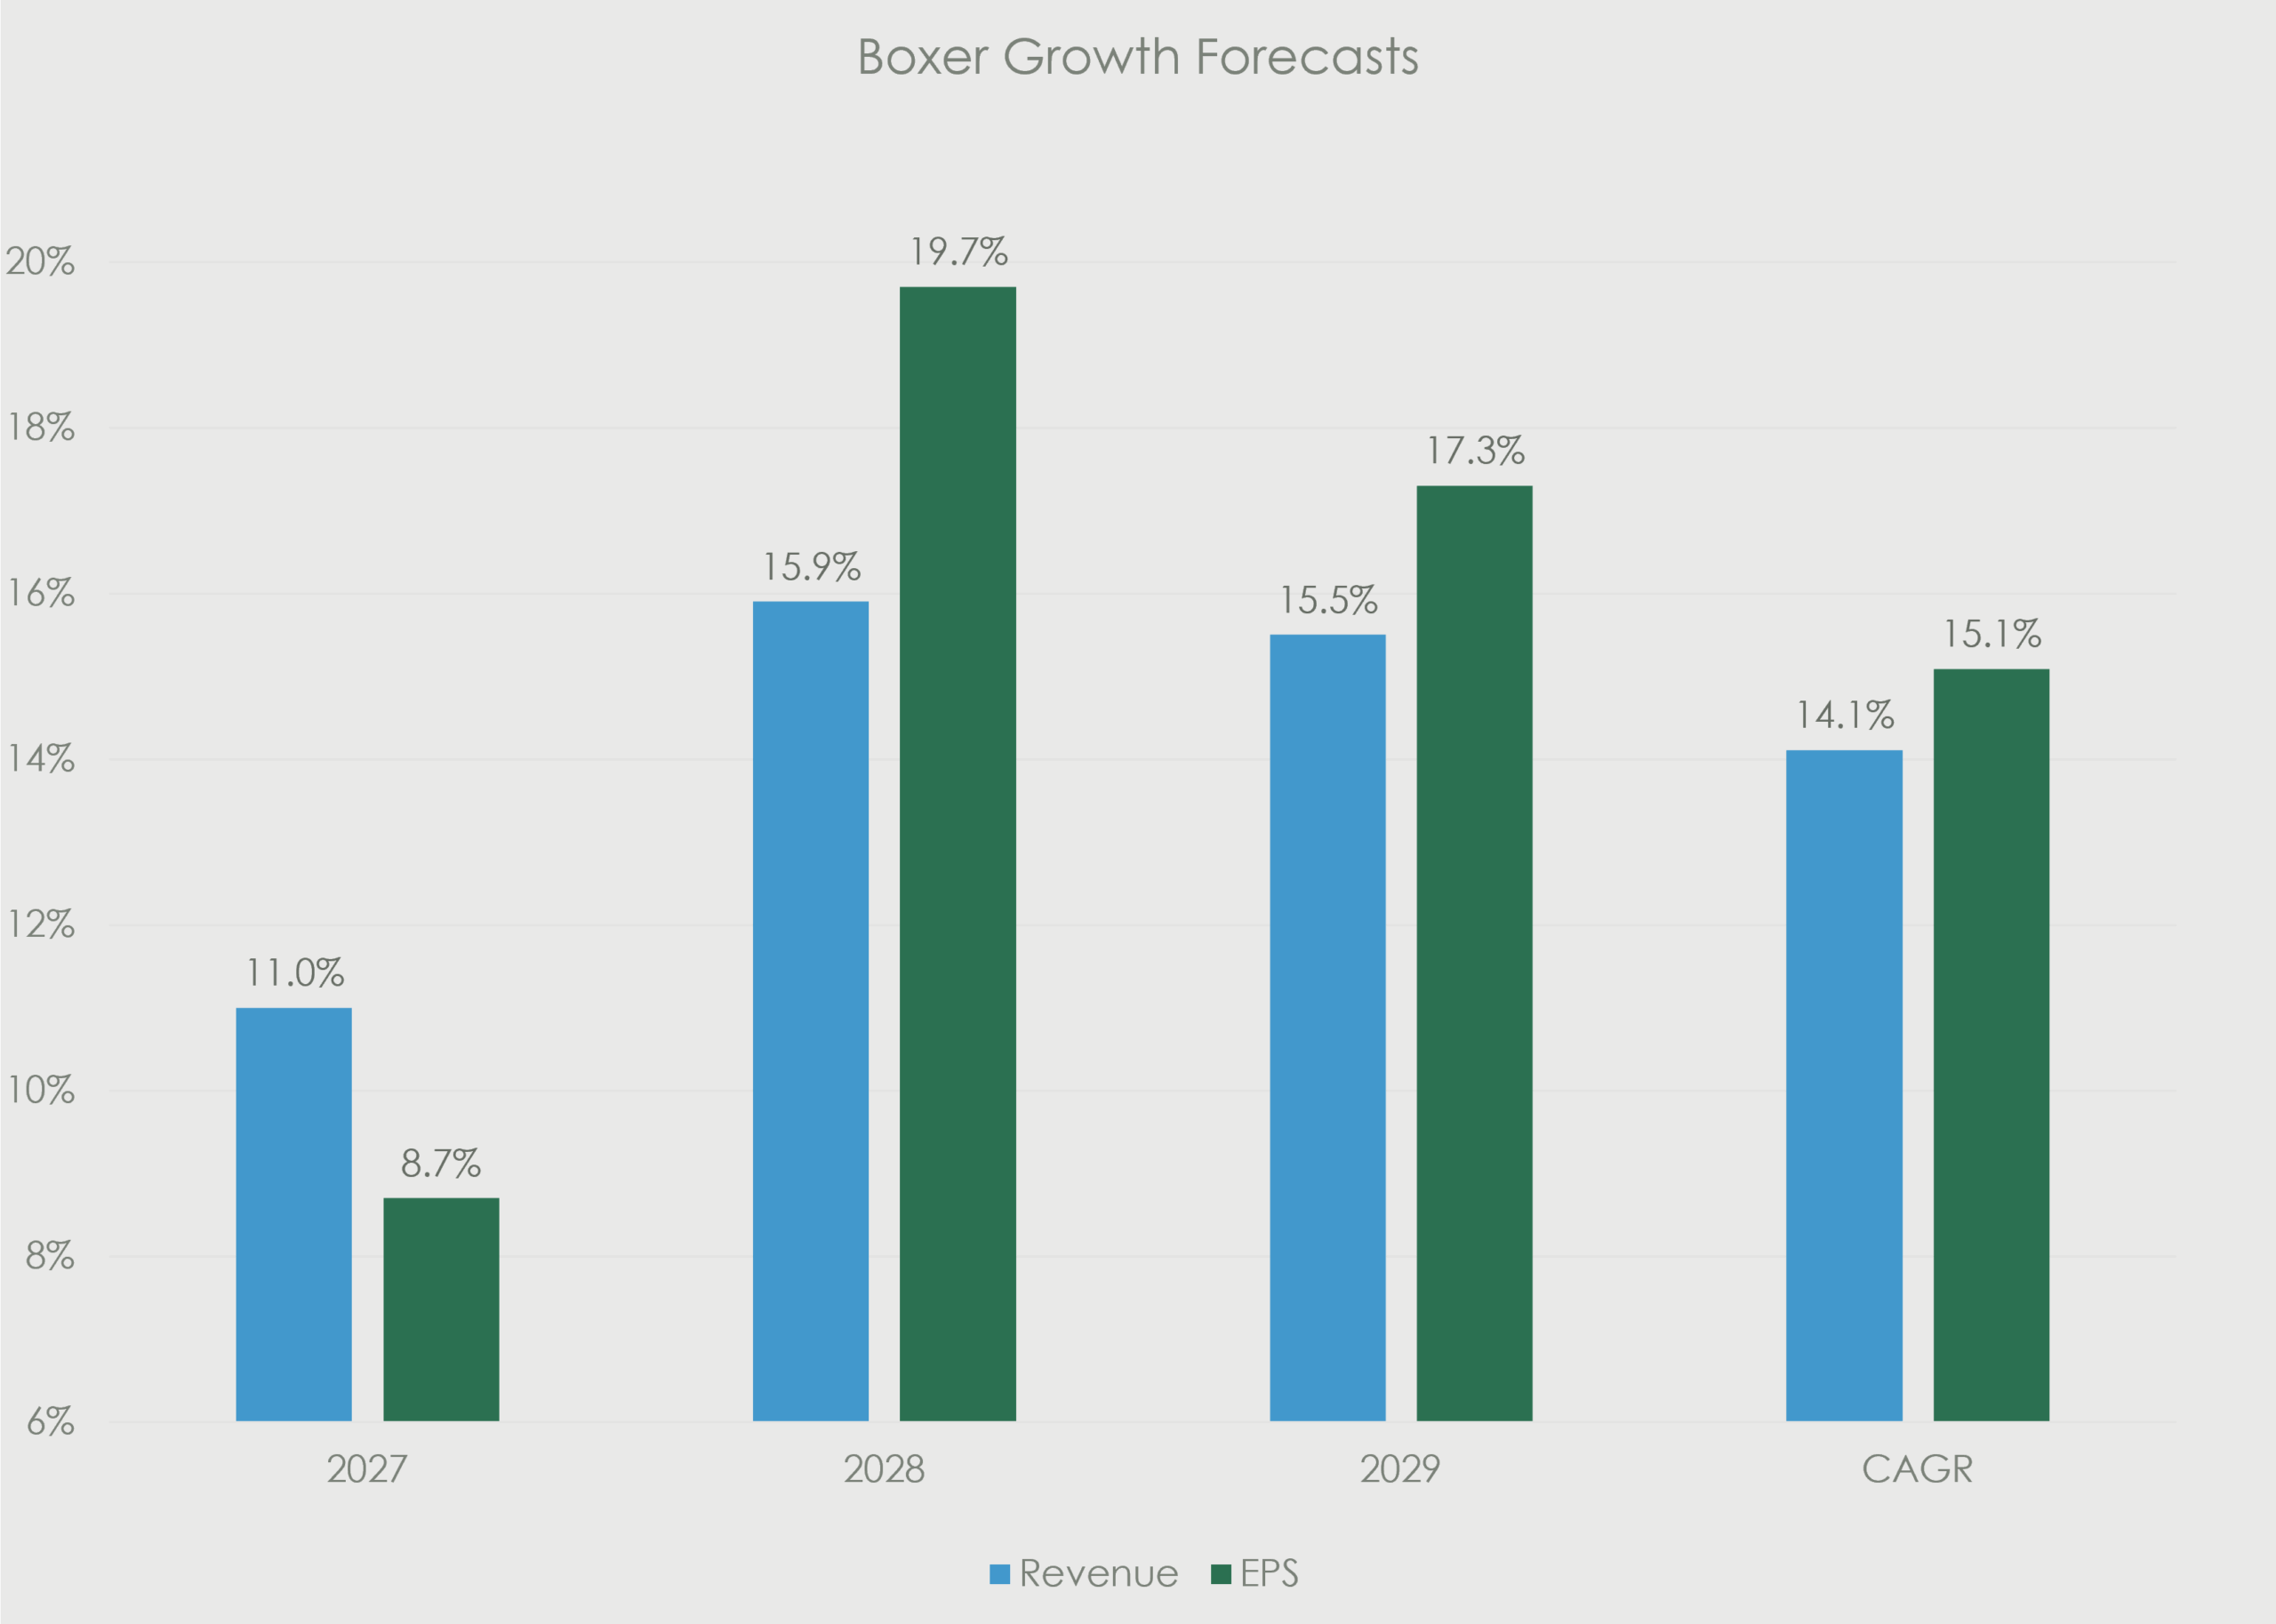
In this environment, Boxer is well positioned. The group delivered a strong FY26 performance, with 12.3% revenue growth despite negative selling price inflation, while still expanding margins – highlighting strong execution and pricing discipline. Looking ahead, we expect a more supportive pricing environment as input cost pressures (including fuel and agricultural inputs) begin to filter through, which should drive an acceleration in top-line growth into the mid-teens.
Importantly, Boxer retains multiple levers to support profitability. These include private label expansion, pricing optimisation, and operating efficiencies – all of which should underpin margin resilience. We therefore forecast earnings growth of around 15% over the next three years, supported by positive operating leverage.
From a valuation perspective, food retailers tend to command premium multiples during inflationary periods. Applying a 1.3x PEG ratio, we derive a forward P/E of 19.9x, implying a price target of R91.20, broadly in line with consensus. We also see potential for further upside, supported by continued market share gains and improved liquidity following the placement.
Overall, we believe Boxer represents a compelling combination of defensiveness and growth, making it a key holding in navigating an increasingly uncertain macro environment.